

The influence of CT and dual-energy X-ray absorptiometry (DXA) bone density on quantitative [18F] sodium fluoride PET
- PMID: 30976544
- PMCID: PMC6414779
- DOI: 10.21037/qims.2019.01.01
The influence of CT and dual-energy X-ray absorptiometry (DXA) bone density on quantitative [18F] sodium fluoride PET
Abstract
Background: [18F] sodium fluoride PET/CT provides quantitative measures of bone metabolic activity expressed by the parameters standardised uptake value (SUV) and bone plasma clearance (K i) that correlate with measurements of bone formation rate obtained by bone biopsy with double tetracycline labelling. Both SUV and K i relate to the tracer uptake in each millilitre of tissue. In general, the bone region of interest (ROI) includes both mineralised bone {generally with a high concentration of [18F]NaF} and bone marrow (with a much lower concentration), suggesting that correcting SUV and K i for volumetric bone mineral density (vBMD) and measuring them with respect to the tracer uptake in each gram of bone mineral might improve the correlation with the findings of bone biopsy. As a first test of this hypothesis, we looked for positive correlations between SUV and K i values with CT and DXA bone mineral density (BMD) parameters measured in the same ROI.
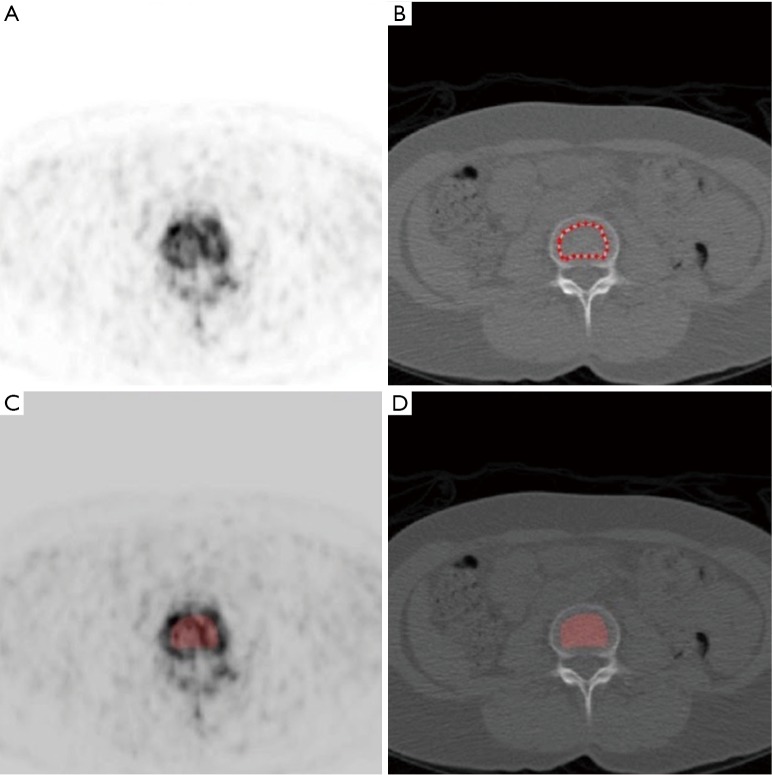
Methods: A retrospective reanalysis was performed of 63 lumbar spine [18F]NaF PET/CT scans acquired in four earlier studies. The quantitative PET parameters SUV and K i were measured in L1-L4 and Hounsfield units (HU) measured on the CT scans in the same ROI. Spine BMD data was also obtained from DXA scans in the form of areal BMD and used to derive the bone mineral apparent density (BMAD, an estimate of vBMD). Scatter plots were drawn of SUV and K i against HU, BMAD and areal BMD and the Spearman rank correlation coefficients derived for each plot.
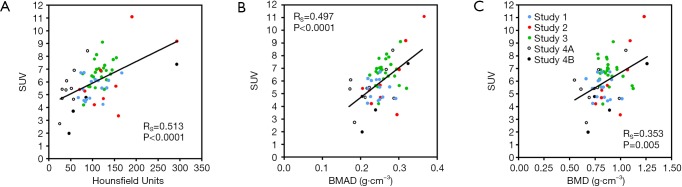
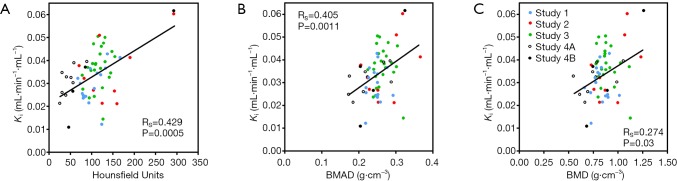
Results: All correlations were positive and statistically significant. Correlations were highest for HU (SUV: RS =0.513, P<0.0001; K i: RS =0.429, P=0.0005) and lowest for areal BMD (SUV: RS =0.353, P=0.005; K i: RS =0.274, P=0.03).
Conclusions: The results demonstrate significant positive correlations between SUV and K i and vBMD measurements in the form of HU from CT or BMAD and areal BMD from DXA. These findings justify further exploration of the relationship between SUV and K i [18F]NaF PET/CT measurements and CT or DXA measurements of vBMD to examine whether normalization for bone density might improve their correlation with bone metabolic activity as measured by bone biopsy.
Keywords: [18F] sodium fluoride {[18F]NaF}; [18F]NaF bone plasma clearance; bone metabolic activity; computed tomography (CT); dual X-ray absorptiometry (DXA); positron emission tomography (PET); standardised uptake value (SUV).
Conflict of interest statement
Conflicts of Interest: The authors have no conflicts of interest to declare.
Figures
References
-
- Raynor W, Houshmand S, Gholami S, Emamzadehfard S, Rajapakse CS, Blomberg BA, Werner TJ, Høilund-Carlsen PF, Baker JF, Alavi A. Evolving Role of Molecular Imaging with 18F-Sodium Fluoride PET as a Biomarker for Calcium Metabolism. Curr Osteoporos Rep 2016;14:115-25. 10.1007/s11914-016-0312-5 - DOI - PubMed
-
- Dempster DW, Zhou H, Recker RR, Brown JP, Recknor CP, Lewiecki EM, Miller PD, Rao SD, Kendler DL, Lindsay R, Krege JH, Alam J, Taylor KA, Melby TE, Ruff VA. Remodeling- and Modeling-Based Bone Formation With Teriparatide Versus Denosumab: A Longitudinal Analysis From Baseline to 3 Months in the AVA Study. J Bone Miner Res 2018;33:298-306. 10.1002/jbmr.3309 - DOI - PubMed
Grants and funding
LinkOut - more resources
Full Text Sources
Research Materials