Review
. 2019 Aug 19;70(16):4305-4317.
doi: 10.1093/jxb/erz176.

Arabidopsis glucosinolate storage cells transform into phloem fibres at late stages of development

Affiliations
Review

Arabidopsis glucosinolate storage cells transform into phloem fibres at late stages of development

Pascal Hunziker et al. J Exp Bot. .

Abstract

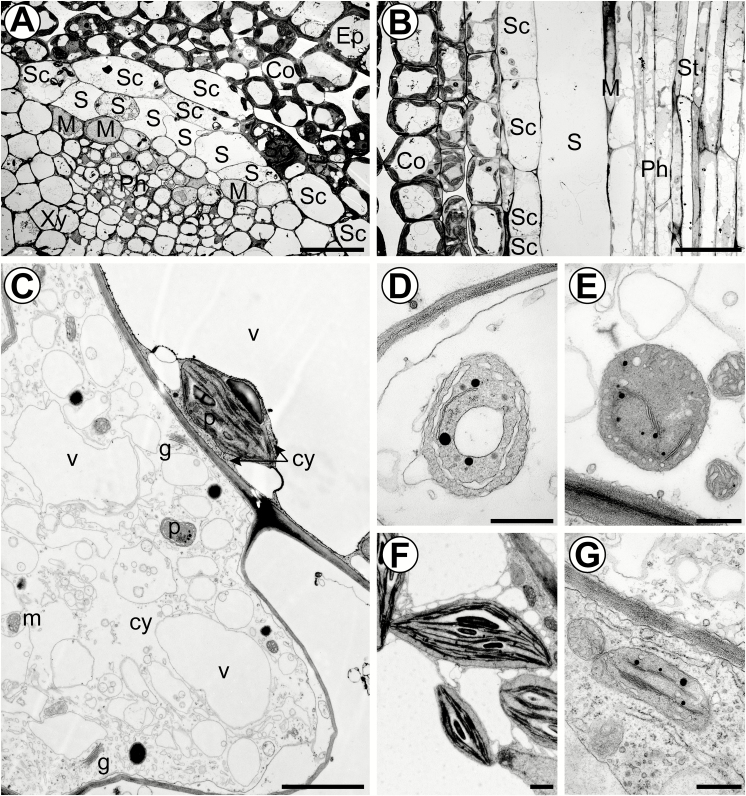
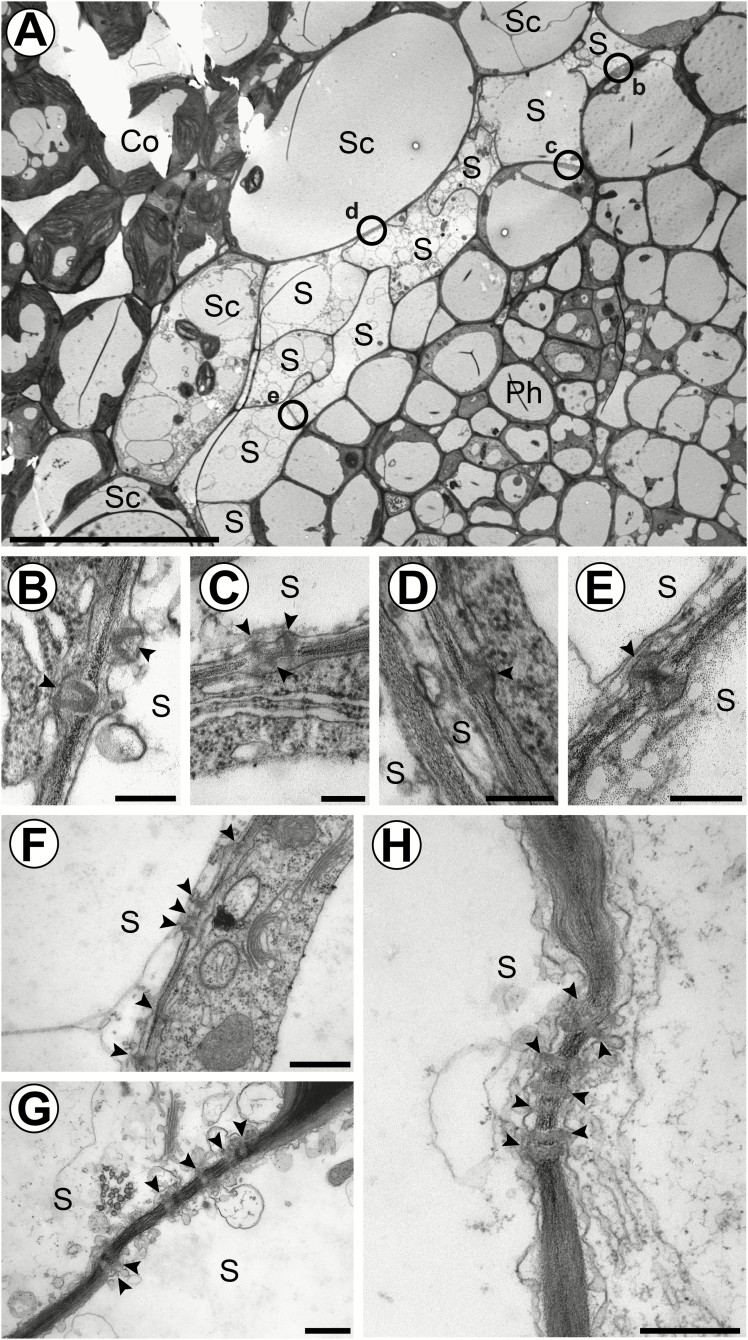
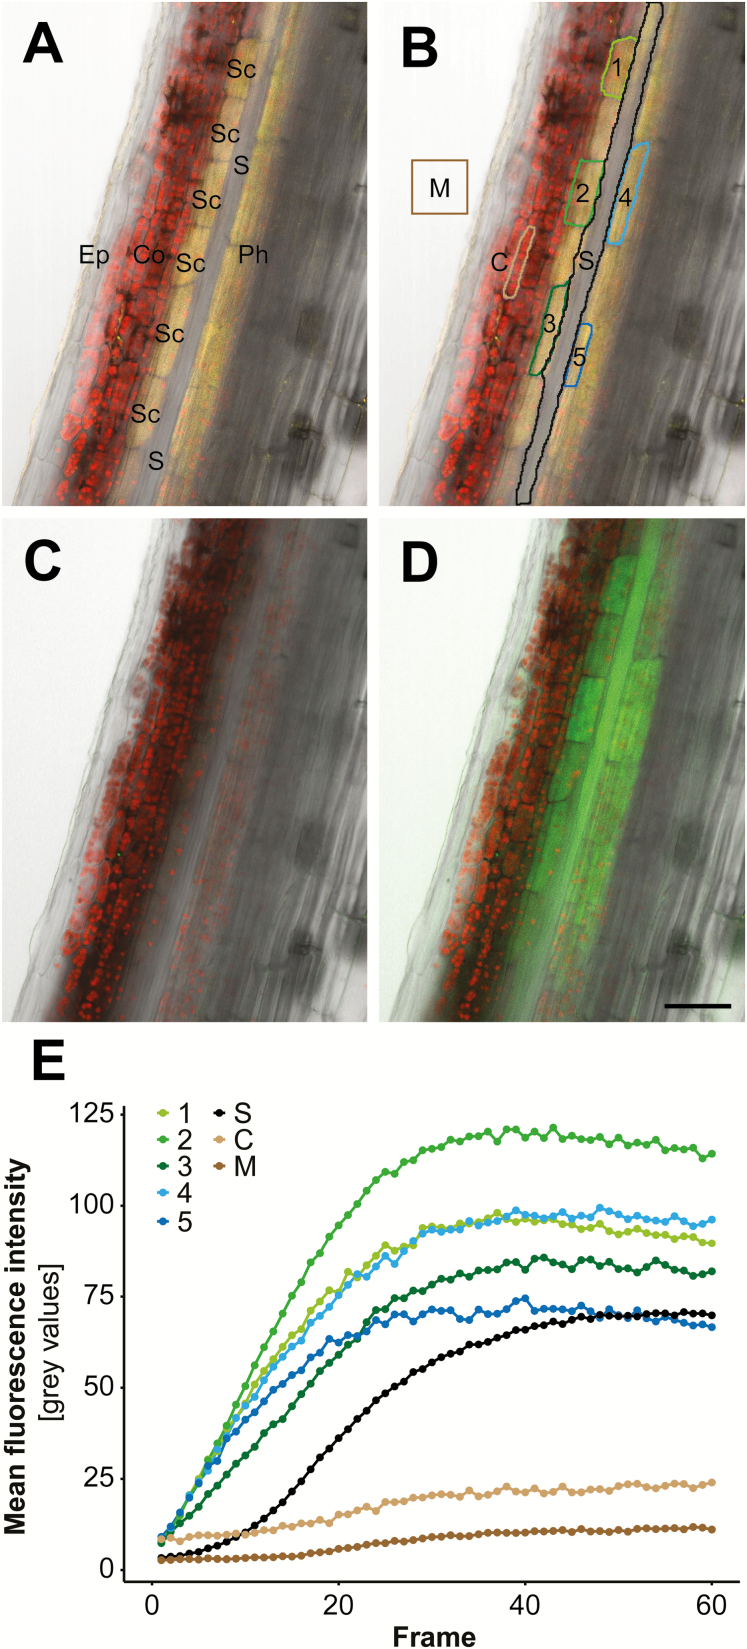
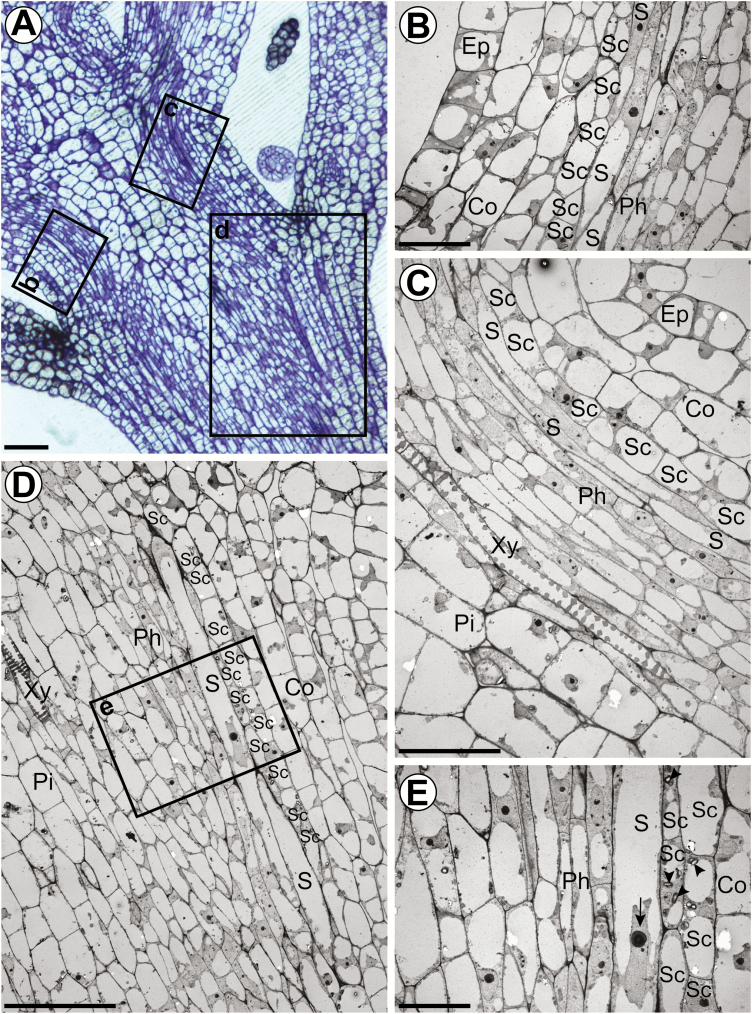
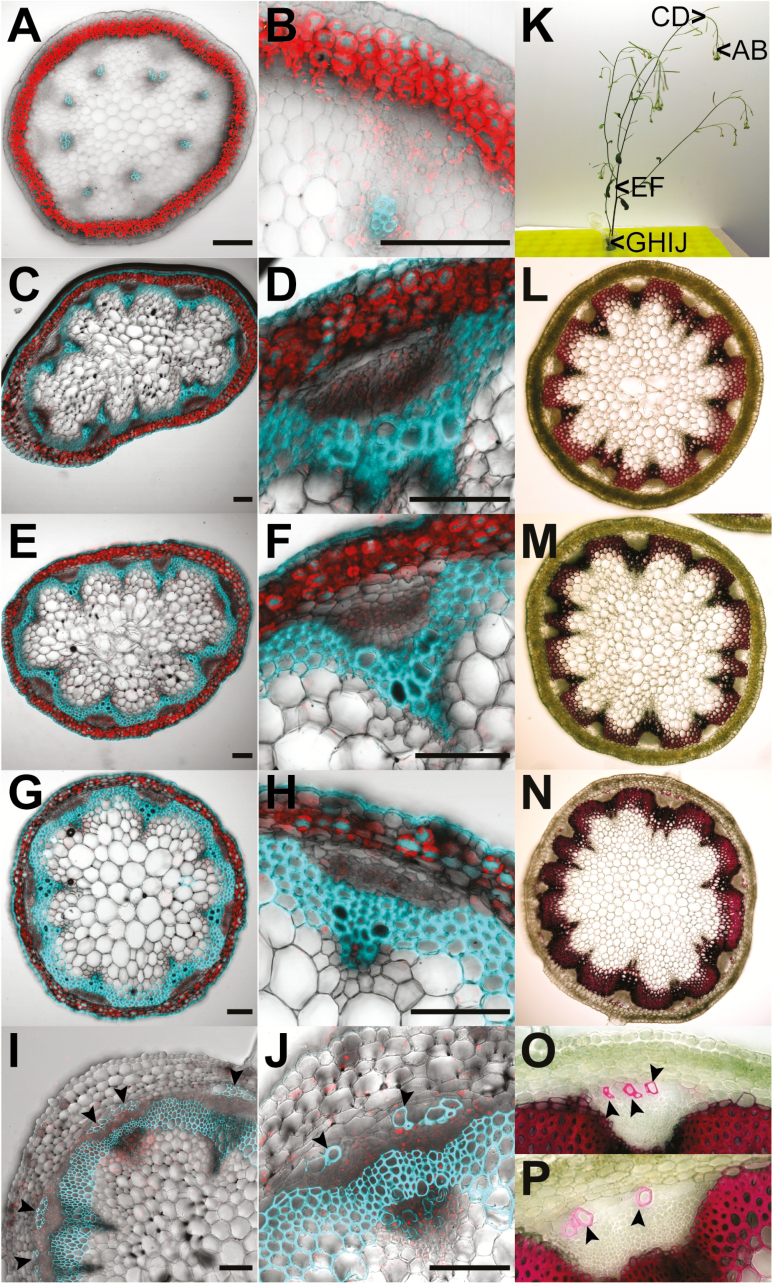
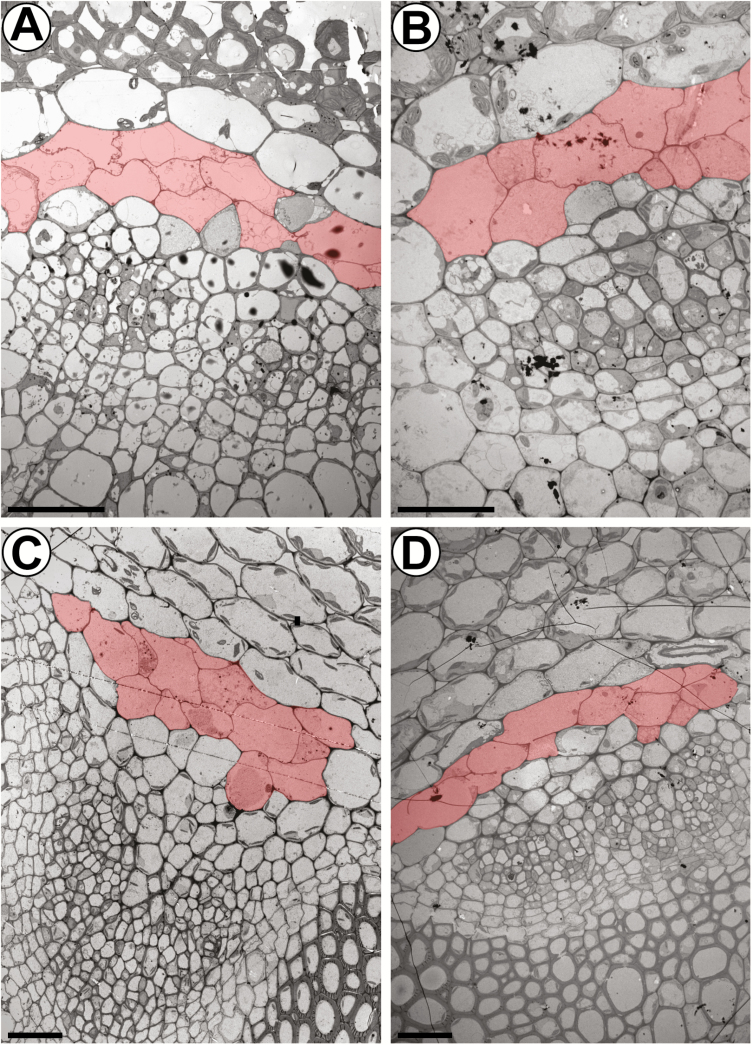
The phloem cap of Arabidopsis thaliana accumulates glucosinolates that yield toxic catabolites upon damage-induced hydrolysis. These defence compounds are stored in high concentrations in millimetre long S-cells. At early stages of development, S-cells initiate a process indicative of programmed cell death. How these cells are maintained in a highly turgescent state following this process is currently unknown. Here, we show that S-cells undergo substantial morphological changes during early differentiation. Vacuolar collapse and rapid clearance of the cytoplasm did not occur until senescence. Instead, smooth endoplasmic reticulum, Golgi bodies, vacuoles, and undifferentiated plastids were observed. Lack of chloroplasts indicates that S-cells depend on metabolite supply from neighbouring cells. Interestingly, TEM revealed numerous plasmodesmata between S-cells and neighbouring cells. Photoactivation of a symplasmic tracer showed coupling with neighbouring cells that are involved in glucosinolate synthesis. Hence, symplasmic transport might contribute to glucosinolate storage in S-cells. To investigate the fate of S-cells, we traced them in flower stalks from the earliest detectable stages to senescence. At late stages, S-cells were shown to deposit thick secondary cell walls and transform into phloem fibres. Thus, phloem fibres in the herbaceous plant Arabidopsis pass a pronounced phase of chemical defence during early stages of development.

Keywords: Glucosinolates; S-cell; phloem cap; phloem fibre; photoactivation; plasmodesmata.


Figures

Fig. 1.
Fig. 1.
Ultrastructural characteristics of S-cells in flower stalks of 6-week-old plants. (A) Overview of a vascular bundle in a transverse section 5 mm below the SAM. (B) Longitudinal section of an S-cell 5 mm below the SAM. (C) S-cell located next to a starch sheath cell with a typical amyloplast. (D) Proplastid-like structures observed in S-cell found 5 mm below the SAM. (E) Proplastid-like structures observed in S-cells found in the basal internode. (F) Amyloplasts observed in starch sheath cells. (G) Chloroplasts observed in adjacent phloem parenchyma cells. Ep, epidermis; Co, cortex; SC, starch sheath cell; S, S-cell; Ph, protophloem; Xy, protoxylem; M, myrosin idioblast; St, sieve-tube; v, vacuole; m, mitochondrion; p, plastid; g, Golgi apparatus; cy, cytosol. Scale bars (A and B) 20 µm; (C) 2 µm; (D–G) 500 nm. See also Supplementary Fig. S1 where the cell types are false colour-labelled.
Fig. 2.
Fig. 2.
TEM reveals that PDs connect S-cells to adjacent cells and organize into clusters during cell maturation. (A) Overview of a vascular bundle in a transverse section 5 mm below the SAM of flower stalks from 6-week-old plants. Circles indicate the localization of PDs shown in (B–E). (B) Cell wall interface between an S-cell and a phloem parenchyma cell. (C) Cell wall interface between an S-cell and a phloem parenchyma cell. (D) Cell wall interface between an S-cell and a starch sheath cell. (E) Cell wall interface between two adjacent S-cells. (F) Cluster of PDs found between an S-cell and a phloem parenchyma cell in a central internode. (G) Cluster of PDs found between two adjacent S-cells in the basal internode. (H) Cluster of PDs found between an S-cell and a starch sheath cell in the basal internode. Arrowheads highlight individual PDs. Ep, epidermis; Co, cortex; SC, starch sheath cell; S, S-cell; Ph, protophloem; Xy, protoxylem; Pi, pith. Scale bars (A) 20 µm; (B–E), 200 nm; (F–H) 500 nm.
Fig. 3.
Fig. 3.
Cell coupling between CYP83A1-positive cells and S-cells revealed by photoactivation and tracing of CMNB-caged fluorescein. (A) Overlay of chlorophyll autofluorescence (red), transmission light (grey), and mVenus (yellow) channels of a longitudinal section through an apical inflorescence stem expressing pCYP83A1:CYP83A1-mVenus. CYP83A1-mVenus is localized to starch sheath and phloem parenchyma cells, but not to adjacent S-cells. (B) ROIs selected for photoactivation of CMNB-caged fluorescein in CYP83A1-positive cells (cells numbered 1–5) and quantification of cell coupling (M, C, and S). (C) Overlay of high-resolution pre-photoactivation images of chlorophyll autofluorescence (red), transmission light (grey), and fluorescein (green) channels. (D) Overlay of high-resolution post-photoactivation images of chlorophyll autofluorescence (red), transmission light (grey), and fluorescein (green) channels. (E) Quantification of mean fluorescence intensity of photoactivated target cells 1–5 and non-photoactivated cells of interest including S-cells (S), imaging medium (M), and a cortical cell (C) over the course of photoactivation as shown in Supplementary Video S1. Colours match the ROIs outlined in (B). Ep, epidermis; Co, cortex; SC, starch sheath; S, S-cell; phloem. Scale bar=50 µm.
Fig. 4.
Fig. 4.
Early developmental stages of S-cells in Arabidopsis inflorescence stems. (A) Light microscopic image of a crystal violet-stained longitudinal semi-thin section through the generative SAM displaying the third to fifth internode. Rectangles represent ROIs shown in (B–D). (B–D) Electron micrographs of S-cell precursors in the third, fourth, and fifth internode, respectively (200, 350, and 500 µm from the SAM). Extensively elongated precursor cells are consistently located between the starch sheath and protophloem. Precursor S-cells are equipped with a full set of organelles including a single, centrally arranged nucleus, large vacuoles, and electron-dense cytoplasm. The specimen shown in (D) has been sectioned slightly oblique. (E) Higher magnification of the region outlined in (D). The starch sheath is characterized by the presence of amyloplasts (arrowheads). Note the high amount of euchromatin in the large nucleus of the S-cell (arrow). Ep, epidermis; Co, cortex; SC, starch sheath cell; S, S-cell; Ph, protophloem; Xy, protoxylem; Pi, pith. Scale bars (A), (C), (D), 40 µm; (B), (E) 20 µm. (This figure is available in colour at JXB online.)
Fig. 5.
Fig. 5.
Lignification of S-cells. (A–J) Overlays of confocal images depicting chlorophyll in red and lignin in cyan in transverse sections of flower stalks from 6-week-old (A–H) and 8-week-old (I and J) wild-type plants of ~10 cm and 30 cm height, respectively. Sections were taken at 5 mm distance from the SAM (A, B), at 5 cm distance from the SAM (C, D), the second internode (E, F), and the third internode at the very base of the flower stalk (G, H) as depicted in (K). (A) Lignin is found exclusively in the xylem. (B) Zoom-in on a single vascular bundle from (A). (C) Lignification of interfascicular fibres is initiated at ~5 cm from the SAM. (D) Zoom-in on a single vascular bundle from (C). (E) Lignification of interfascicular bundles is intensified in the second internode. (F) Zoom-in on a single vascular bundle from (E). (G) Lignification in the basal internode. (H) Zoom-in on a single vascular bundle from (G). Note that S-cells are not lignified at that stage. (I) Lignification of S-cells at the phloem cap is initiated at the very base of flower stalks from 8-week-old plants showing ripeness of the first siliques. (J) Zoom-in of a single vascular bundle from (I). Note that not all S-cells started to lignify at this stage. (K) Photograph of a 6-week-old (left) and an 8-week-old (right) plant. Arrowheads depict the position of sections shown in this figure. (L–P) Phloroglucinol-HCl staining of transverse sections from flower stalks of 8-week-old wild-type plants confirms the deposition of lignin in S-cells. Sections were taken at 5 cm distance from the SAM (L) and at the top (M) and bottom (N–P) of the basal internode as depicted in (K). Lignin is depicted in red. (L) Lignification of interfascicular fibres is consistent with the pattern of lignin autofluorescence observed in (C) and (D). (M) No S-cells were lignified in the top part of the basal internode. (N) Lignin is found in S-cells at the phloem cap, confirming that the autofluorescence observed in (I) and (J) is not due to other compounds. (O and P) Zoom-in on single vascular bundles from (N) Note that the pattern of lignification at the phloem cap is comparable with that of (I) and (J). Lignified S-cells are marked by arrowheads. Scale bars=250 µm.
Fig. 6.
Fig. 6.
The ultrastructure of S-cells is not affected in GLS-deficient myb28 myb29 cyp79b2 cyp79b3 mutant plants. (A and B) Electron micrographs showing the phloem cap of vascular bundles in the top 5 mm of inflorescence stems from 6-week-old (A) wild-type and (B) mutant plants. (C and D) Electron micrographs showing the phloem cap of vascular bundles in the basal 5 mm of inflorescence stems from 6-week-old (C) wild-type and (D) mutant plants. S-cells are false-coloured in red according to their characteristic ultrastructure and size. Scale bars=20 µm.

References

    1. Ageeva MV, Petrovská B, Kieft H, Sal’nikov VV, Snegireva AV, van Dam JE, van Veenendaal WL, Emons AM, Gorshkova TA, van Lammeren AA. 2005. Intrusive growth of flax phloem fibers is of intercalary type. Planta 222, 565–574. - PubMed
    1. Altamura MM, Possenti M, Matteucci A, Baima S, Ruberti I, Morelli G. 2001. Development of the vascular system in the inflorescence stem of Arabidopsis. New Phytologist 151, 381–389.
    1. Andersen TG, Halkier BA. 2014. Upon bolting the GTR1 and GTR2 transporters mediate transport of glucosinolates to the inflorescence rather than roots. Plant Signaling & Behavior 9, e27740. - PMC - PubMed
    1. Andersen TG, Nour-Eldin HH, Fuller VL, Olsen CE, Burow M, Halkier BA. 2013. Integration of biosynthesis and long-distance transport establish organ-specific glucosinolate profiles in vegetative Arabidopsis. The Plant Cell 25, 3133–3145. - PMC - PubMed
    1. Andréasson E, Bolt Jørgensen L, Höglund AS, Rask L, Meijer J. 2001. Different myrosinase and idioblast distribution in Arabidopsis and Brassica napus. Plant Physiology 127, 1750–1763. - PMC - PubMed

Publication types

MeSH terms