. 2019;15(7-8):1488-1495.
doi: 10.1080/21645515.2019.1596712. Epub 2019 Apr 12.

HPV vaccine coverage in Australia and associations with HPV vaccine information exposure among Australian Twitter users

Affiliations

HPV vaccine coverage in Australia and associations with HPV vaccine information exposure among Australian Twitter users

Amalie Dyda et al. Hum Vaccin Immunother. 2019.

Abstract

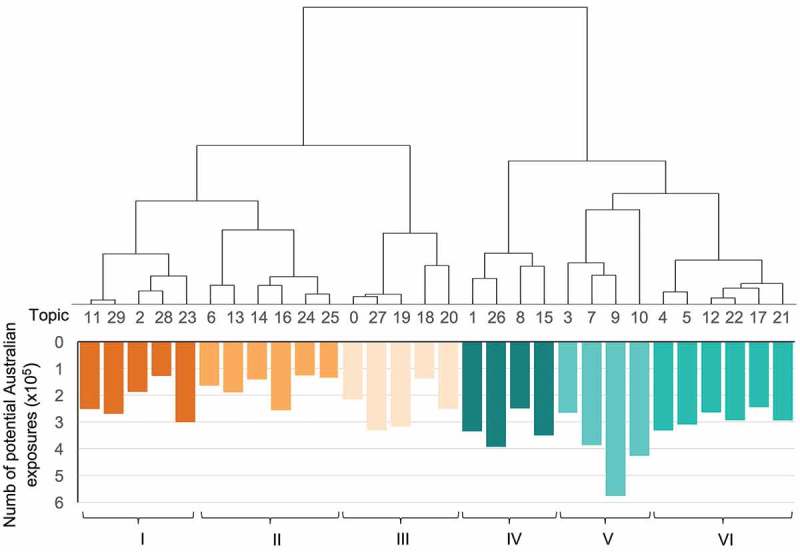
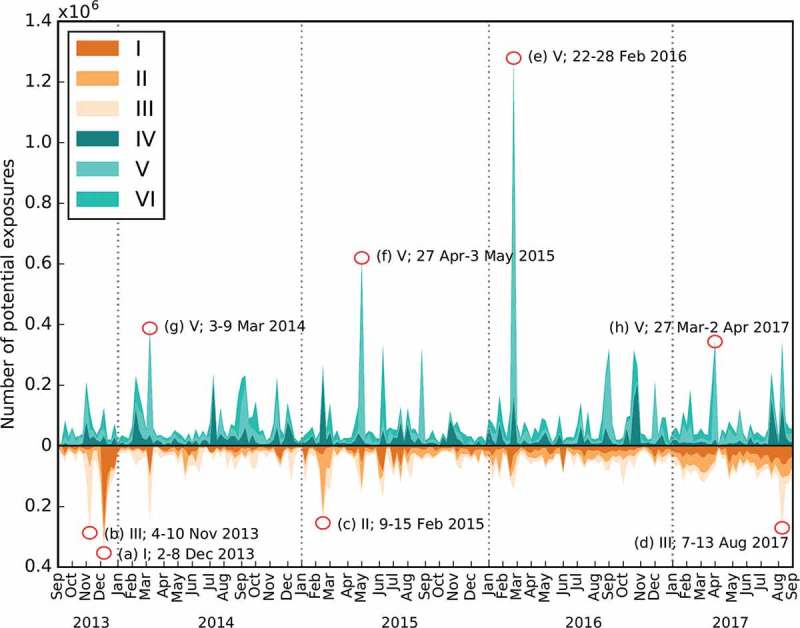
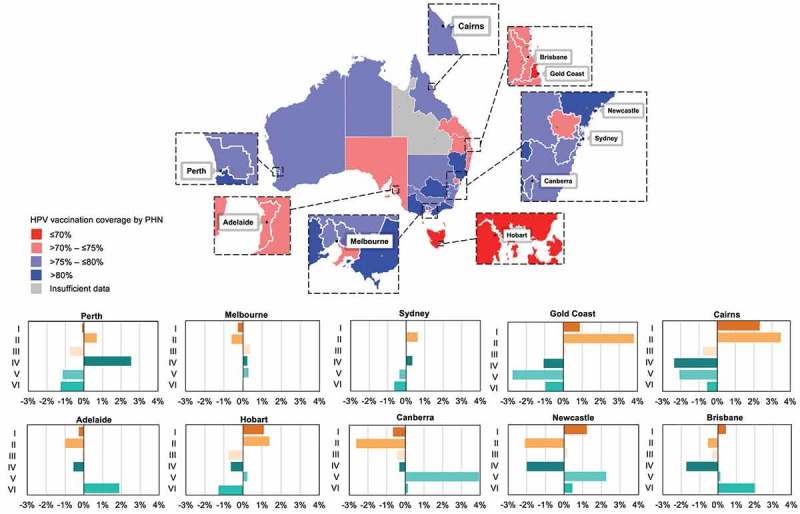
Introduction: Human papillomavirus (HPV) vaccine coverage in Australia is 80% for females and 76% for males. Attitudes may influence coverage but surveys measuring attitudes are resource-intensive. The aim of this study was to determine whether Twitter-derived estimates of HPV vaccine information exposure were associated with differences in coverage across regions in Australia. Methods: Regional differences in information exposure were estimated from 1,103,448 Australian Twitter users and 655,690 HPV vaccine related tweets posted between 6 September 2013 and 1 September 2017. Tweets about HPV vaccines were grouped using topic modelling; an algorithm for clustering text-based data. Proportional exposure to topics across 25 regions in Australia were used as factors to model HPV vaccine coverage in females and males, and compared to models using employment and education as factors. Results: Models using topic exposure measures were more closely correlated with HPV vaccine coverage (female: Pearson's R = 0.75 [0.49 to 0.88]; male: R = 0.76 [0.51 to 0.89]) than models using employment and education as factors (female: 0.39 [-0.02 to 0.68]; male: 0.36 [-0.04 to 0.66]). In Australia, positively-framed news tended to reach more Twitter users overall, but vaccine-critical information made up higher proportions of exposures among Twitter users in low coverage regions, where distorted characterisations of safety research and vaccine-critical blogs were popular. Conclusions: Twitter-derived models of information exposure were correlated with HPV vaccine coverage in Australia. Topic exposure measures may be useful for providing timely and localised reports of the information people access and share to inform the design of targeted vaccine promotion interventions.

Keywords: Social media; attitudes; human papillomavirus vaccines; media representation.


Figures

Figure 1.
Figure 1.
The hierarchical structure of topics determined from the set of intrusion tests performed over the 30 topics (Appendix 1), and included in one of 6 groups (Table 2). Exposure counts represent the total number of unique Australian Twitter users (of those localised to one of the 25 geographical regions) who may have been exposed to tweets from that topic. Orange groups tend to include mostly negative topics and cyan groups tend to include mostly positive topics. Differences in colour were used to denote groups across figures.
Figure 2.
Figure 2.
Potential exposures among Australian Twitter users per week in the period 6 September 2013 to 1 September 2017. Peaks correspond to (a) Australian research showing cervical cancer risk was reduced; (b) Canadian and Australian research showing cervical cancer risk was reduced; (c) Reduction in cervical cancer risk in the United States; (d) discussions of coverage rates in Australia and reduction in risk in New Zealand; (e) research showing that one dose may be enough; (f) debates about the representation of HPV vaccines on a television show hosted by Katie Couric; (g) responses to the reversal of a false balance story written in the Toronto Star newspaper; and (h) videos and stories of adverse events and harm.
Figure 3.
Figure 3.
Examples of topic exposure within individual cities in Australia by topic group (I-VI, inset), where bars represent the city-level difference in proportional exposure to each of the 6 topic groups relative to proportional exposure for all Australian Twitter users. The map illustrates differences in HPV vaccine coverage (population-weighted 3 dose completion aggregated for female and male adolescents) across the 31 Primary Health Networks (PHNs).

References

    1. Australian Institute of Health and Welfare Web update: HPV immunisation rates 2015–16 released 2018 March 22. [accessed 2019 Feb 1] https://myhealthycommunities.gov.au/our-reports/HPV-rates/march-2018.
    1. Brotherton JML, Fridman M, May CL, Chappell G, Saville AM, Gertig DM.. Early effect of the HPV vaccination programme on cervical abnormalities in Victoria, Australia: an ecological study. The Lancet. 2011;377(9783):2085–92. doi:10.1016/S0140-6736(11)60551-5. - DOI - PubMed
    1. Omer SB, Salmon DA, Orenstein WA, deHart MP, Halsey N. Vaccine refusal, mandatory immunization, and the risks of vaccine-preventable diseases. N Engl J Med. 2009;360(19):1981–88. doi:10.1056/NEJMsa0806477. - DOI - PubMed
    1. Dempsey AF, Zimet GD, Davis RL, Koutsky L. Factors that are associated with parental acceptance of human papillomavirus vaccines: a randomized intervention study of written information about HPV. Pediatrics. 2006;117(5):1486–93. doi:10.1542/peds.2005-1381. - DOI - PubMed
    1. Rosenthal SL, Rupp R, Zimet GD, Meza HM, Loza ML, Short MB, Succop PA. Uptake of HPV vaccine: demographics, sexual history and values, parenting style, and vaccine attitudes. J Adolesc Health. 2008;43(3):239–45. doi:10.1016/j.jadohealth.2008.06.009. - DOI - PubMed

Publication types

MeSH terms

Substances