

Middle-aged death and taxes in the USA: Association of state tax burden and expenditures in 2005 with survival from 2006 to 2015
- PMID: 30978199
- PMCID: PMC6461276
- DOI: 10.1371/journal.pone.0214463
Middle-aged death and taxes in the USA: Association of state tax burden and expenditures in 2005 with survival from 2006 to 2015
Abstract
Background: Longevity in the United States ranks below most other Western nations despite spending more on healthcare per capita than any other country. Across the world, mortality has been declining, but in the USA the trend toward improvement has stalled in some middle-aged demographic groups. Cross-national studies suggest that social welfare is positively associated with longevity. The United States has less government sponsored welfare, education and healthcare than almost all other Western nations, but the level of this social welfare commitment varies across the states. In this study we examined the association of state tax burden and state government expenditures with subsequent middle-aged mortality.
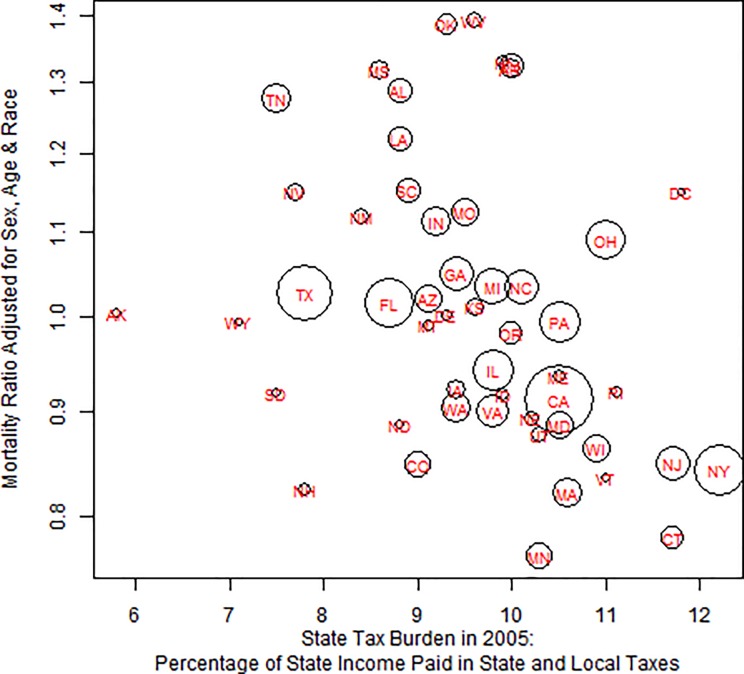
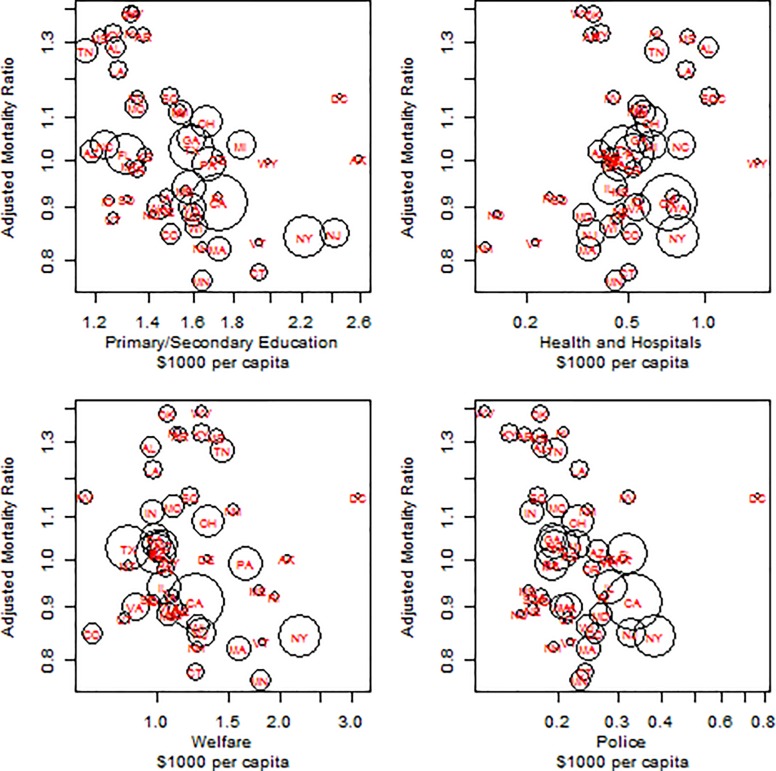
Methods: The primary exposure was state tax burden in 2005, defined as proportion of all state income paid to the state. We also examined the impact of state expenditures per capita in 2005 for education, healthcare, welfare, police and highways. The dependent variable was mortality during the subsequent 10 years. Death counts and population sizes by sex, age group and race strata for 2006-2015 were abstracted from CDC WONDER. Binomial logistic regression was employed based on the number of deaths and underlying population within each county-sex-age-race bin.
Results: State tax burden in 2005 varied from 5.8% to 12.2%. An increase of 1.0 percentage point in state tax burden was associated with a 5.8% (SE = 0.1%) reduction in mortality adjusted for sex, age and race, but was associated with a 1.1% (SE = 0.1%) reduction when further adjusting for state income and education levels. Controlling for sex, age and race each type of state expenditures was associated with decreases in middle aged mortality, notably K-12 education (reduction of 4.7%, SE = 0.1%, per 10% expenditure increase) except healthcare but all types were associated with mortality decreases further controlling for state income and education.
Conclusion: The residents of states with higher state taxation and higher expenditures per capita have lower middle aged mortality rates.
Conflict of interest statement
The authors have declared that no competing interests exist.
Figures
References
-
- Case A, Deaton A. Rising morbidity and mortality in midlife among white non-Hispanic Americans in the 21st century. Proc Natl Acad Sci [Internet]. 2015. December 8 [cited 2017 Oct 16];112(49):15078–83. Available from: http://www.pnas.org/content/112/49/15078 10.1073/pnas.1518393112 - DOI - PMC - PubMed
-
- Wilmoth JR, Boe C, Barbieri M. Geographic Differences in Life Expectancy at Age 50 in the United States Compared with Other High-Income Countries [Internet]. National Academies Press; (US); 2010. [cited 2018 May 22]. Available from: https://www.ncbi.nlm.nih.gov/books/NBK62591/
-
- Montez JK, Zajacova A, Hayward MD. Disparities in Disability by Educational Attainment Across US States [Internet]. 10.2105/AJPH.2017.303768. 2017 [cited 2018 May 22]. Available from: http://ajph.aphapublications.org/ - DOI - PMC - PubMed
MeSH terms
LinkOut - more resources
Full Text Sources
Medical
