Review
. 2019 Aug:58:129-136.
doi: 10.1016/j.copbio.2019.03.001. Epub 2019 Apr 10.

Beyond bulk: a review of single cell transcriptomics methodologies and applications

Affiliations
Review

Beyond bulk: a review of single cell transcriptomics methodologies and applications

Ashwinikumar Kulkarni et al. Curr Opin Biotechnol. 2019 Aug.

Abstract

Single-cell RNA sequencing (scRNA-seq) is a promising approach to study the transcriptomes of individual cells in the brain and the central nervous system (CNS). This technology acts as a bridge between neuroscience, computational biology, and systems biology, enabling an unbiased and novel understanding of the cellular composition of the brain and CNS. Gene expression at the single cell resolution is often noisy, sparse, and high-dimensional, creating challenges for computational analysis of such data. In this review, we overview fundamental sample preparation and data analysis processes of scRNA-seq and provide a comparative perspective for analyzing and visualizing these data.


Conflict of interest statement

Conflict of interest statement

Nothing declared.

Figures
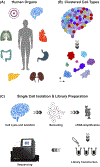
Figure 1:
Figure 1:. Schematic diagram of a single cell transcriptomic experiment.
(A) Single cell gene expression profiling can be carried out from any tissue from humans or model systems. (B) The human brain, as an example, is composed of diverse types of cells, each of which contain gene expression patterns that can be resolved into clusters of cells of similar cell types. (C) A generalized scRNA-seq pipeline from source tissue to sequencing.
Figure 2:
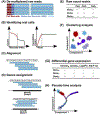
Figure 2:. General workflow of scRNA-seq data analysis.
(A) Raw BCL files containing reads are quality-filtered and de-multiplexed. These reads contain information for the cell barcode, a molecular barcode or UMI, and the cDNA sequence. (B) Using UMI tools [31], one can distinguish real cells from potential background noise. UMI tools estimates these cell barcodes from the data using the knee method. This whitelist of cell barcodes is then used to extract cDNA reads corresponding to the estimated real cells. (C) The next step is to align the reads to the reference genome, for example using STAR [32] and (D) assign reads to the reference annotation gene model using a tool such as featureCounts [33]. (E) UMI tools can further collapse the read counts corresponding to each gene in each cell creating a raw digital expression count matrix. (F) Using the raw count table, clustering pipelines such as Seurat [37, 38] separate the cells into different clusters based on the cell types and (G) facilitate differential gene expression analysis between any given clusters. One can additionally use tools like SCDE [78, 79] which are designed specifically for single cell transcriptional data to calculate differential expression. (H) Additional analyses could include a pseudo-time trajectory of cells using tools such as Velocyto [52] and Monocle [80]. etc.
Figure 3:
Figure 3:. Comparison of non-linear dimensionality reduction techniques.
Using the same dataset of 62,778 mouse striatal neurons (unpublished dataset), plotting the cells using t-SNE embeddings (A) does not spatially capture the trajectory of distinct cell types like (B) UMAP. Arrow shows the progression of neural progenitor clusters to fully mature spiny projection neuron clusters that is visible in UMAP, however, no such trajectory can be visually discerned using t-SNE.
Figure 4:
Figure 4:. Example schematic of a comparative single-cell transcriptomic study.
(A-B) Control vs. experimental cells can be clustered together and visualized using a dimensionality reduction tool. (C-D) Gene expression differences within distinct cell-types between control and experimental cells can be uncovered and cell-type composition within the tissue can be compared across samples. (E) Other scRNA-seq tools, such as pseudo-time analyses, can be examined between control and experimental systems.

References

    1. Raj A and van Oudenaarden A, Nature, nurture, or chance: stochastic gene expression and its consequences. Cell, 2008. 135(2): p. 216–26. - PMC - PubMed
    1. Munsky B, Neuert G, and van Oudenaarden A, Using Gene Expression Noise to Understand Gene Regulation. Science, 2012. 336: p. 183–187. - PMC - PubMed
    1. Stegle O, Teichmann SA, and Marioni JC, Computational and analytical challenges in singlecell transcriptomics. Nature Reviews Genetics, 2015. 16: p. 133. - PubMed
    1. Cristinelli S and Ciuffi A, The use of single-cell RNA-Seq to understand virus–host interactions. Current Opinion in Virology, 2018. 29: p. 39–50. - PubMed
    1. Gross A, et al., Technologies for single-cell isolation. International Journal of Molecular Sciences, 2015. 16(8). - PMC - PubMed

Publication types