. 2016 Mar 3;8(3):73.
doi: 10.3390/polym8030073.

Polyelectrolyte Threading through a Nanopore

Affiliations

Polyelectrolyte Threading through a Nanopore

Pai-Yi Hsiao. Polymers (Basel). .

Abstract

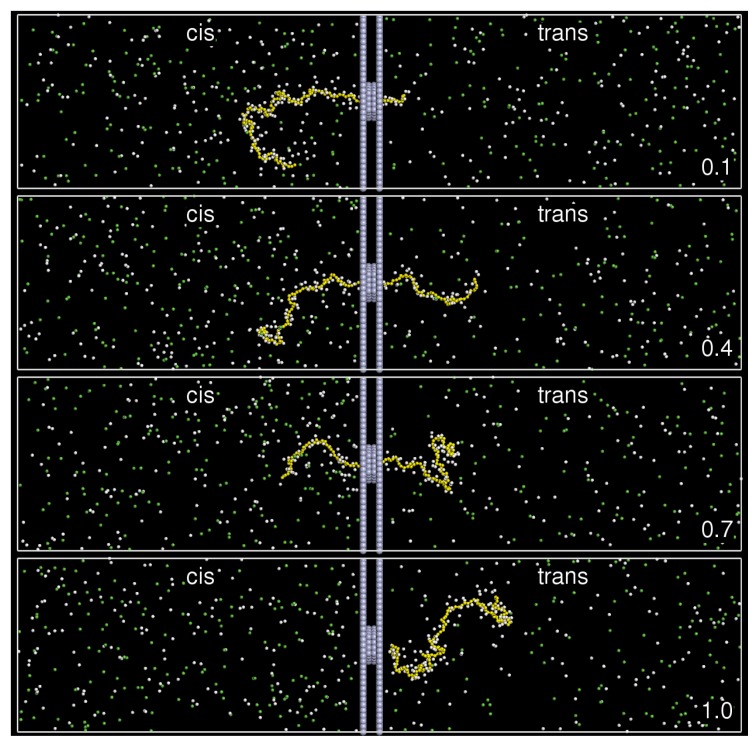
Threading charged polymers through a nanopore, driven by electric fields E, is investigated by means of Langevin dynamics simulations. The mean translocation time 〈 τ 〉 is shown to follow a scaling law Nα, and the exponent α increases monotonically from 1.16 (4) to 1.40 (3) with E. The result is double-checked by the calculation of mean square displacement of translocation coordinate, which asserts a scaling behavior tβ (for t near τ) with β complying with the relation αβ = 2. At a fixed chain length N, 〈τ〉 displayed a reciprocal scaling behavior E-1 in the weak and also in the strong fields, connected by a transition E-1.64(5) in the intermediate fields. The variations of the radius of gyration of chain and the positions of chain end are monitored during a translocation process; far-from-equilibrium behaviors are observed when the driving field is strong. A strong field can strip off the condensed ions on the chain when it passes the pore. The total charges of condensed ions are hence decreased. The studies for the probability and density distributions reveal that the monomers in the trans-region are gathered near the wall and form a pancake-like density profile with a hump cloud over it in the strong fields, due to fast translocation.

Keywords: conformation; density distribution; ion condensation; molecular simulations; polyelectrolyte; probability distribution; scaling behavior; translocation.


Conflict of interest statement

The author declares no conflict of interest.

Figures

Figure 1
Figure 1
(a) Snapshot of a system of N=128, where N refers to the number of monomers; (b) the membrane wall viewed from the trans side of the system. A pore is punched through the wall at the center. The gray beads represent the wall. The yellow, white, and green beads represent the monomers, cations, and anions, respectively.
Figure 1
Figure 1
(a) Snapshot of a system of N=128, where N refers to the number of monomers; (b) the membrane wall viewed from the trans side of the system. A pore is punched through the wall at the center. The gray beads represent the wall. The yellow, white, and green beads represent the monomers, cations, and anions, respectively.
Figure 2
Figure 2
Snapshots of a typical translocation run for N=128 in E=0.5 at time t=0.1τ, 0.4τ, 0.7τ, and 1.0τ. The color scheme is the same as described in Figure 1.
Figure 3
Figure 3
Mean translocation time τ as a function of (a) chain length N at a given E, and (b) field strength E at a given N. The error bar is smaller than the data symbol.
Figure 4
Figure 4
w/τ as a function of E for different N. (Inset) Probability distributions P(τ) of translocation time at E=4.0. The number N is indicated near the curve.
Figure 5
Figure 5
t˜-variation of the averaged Rg for the chain of N=128 in the cis-(I), the trans-(III), and the whole (tot) region at E=0.2, 2.0, 4.0, 16.0, and 32.0. The gray-colored region denotes the distribution range of a curve.
Figure 6
Figure 6
Averaged z-coordinates of chain end, z1 and zN, and the difference z1zN, as a function of t˜ at different field strengths for N=128. The gray region denotes the distribution range of a curve.
Figure 7
Figure 7
t˜-variation of the averaged Nm for N=128 in the cis-region (I); the pore-region (II); and the trans-region (III). The field strength E is indicated in the figure.
Figure 8
Figure 8
MSD (Nm,III(t)Nm,III(0))2 at E=0.5, plotted with the normalized time t˜, for N=128, 256, and 384. (Inset) Exponent β vs. E for different N.
Figure 9
Figure 9
(Left) Variations of the average number of condensed counterions Nc(+1) in the cis-region (I), the pore-region (II), and the trans-region (III) for N=128. (Right) Fraction of charges neutralized on the chain, |Qc/Ne|, during a translocation process. The field strength E is indicated in the legend.
Figure 10
Figure 10
Probability distributions in the z-direction for (a) monomers; (b) counterions; and (c) coions; at E=0.2, 2.0, and 16.0 (N=128). The gray color denotes the z-location of the pore. The value given near a curve is the normalized time t˜ at which the probability density was calculated. For clarity, the curves have been shifted upward with a fixed step value, one curve after the others.
Figure 11
Figure 11
Density distributions of monomer, viewed along x-axis, at (Left) E=0.2, (Middle) E=2.0, and (Right) E=16.0. The chain length is N=128. The value of t˜ is indicated in the figure.

References

    1. Kasianowicz J.J., Robertson J.W., Chan E.R., Reiner J.E., Stanford V.M. Nanoscopic porous sensors. Annu. Rev. Anal. Chem. 2008;1:737–766. doi: 10.1146/annurev.anchem.1.031207.112818. - DOI - PubMed
    1. Zwolak M., Di Ventra M. Colloquium: Physical approaches to DNA sequencing and detection. Rev. Mod. Phys. 2008;80:141. doi: 10.1103/RevModPhys.80.141. - DOI
    1. Milchev A. Single-polymer dynamics under constraints: Scaling theory and computer experiment. J. Phys. Condens. Matter. 2011;23:103101. doi: 10.1088/0953-8984/23/10/103101. - DOI - PubMed
    1. Venkatesan B.M., Bashir R. Nanopore sensors for nucleic acid analysis. Nat. Nanotechnol. 2011;6:615–624. doi: 10.1038/nnano.2011.129. - DOI - PubMed
    1. Reiner J.E., Balijepalli A., Robertson J.W., Campbell J., Suehle J., Kasianowicz J.J. Disease detection and management via single nanopore-based sensors. Chem. Rev. 2012;112:6431–6451. doi: 10.1021/cr300381m. - DOI - PubMed

LinkOut - more resources