. 2019 Apr 23;116(8):1516-1526.
doi: 10.1016/j.bpj.2019.03.012. Epub 2019 Mar 23.

Nanobody-CD16 Catch Bond Reveals NK Cell Mechanosensitivity

Affiliations

Nanobody-CD16 Catch Bond Reveals NK Cell Mechanosensitivity

Cristina González et al. Biophys J. .

Abstract

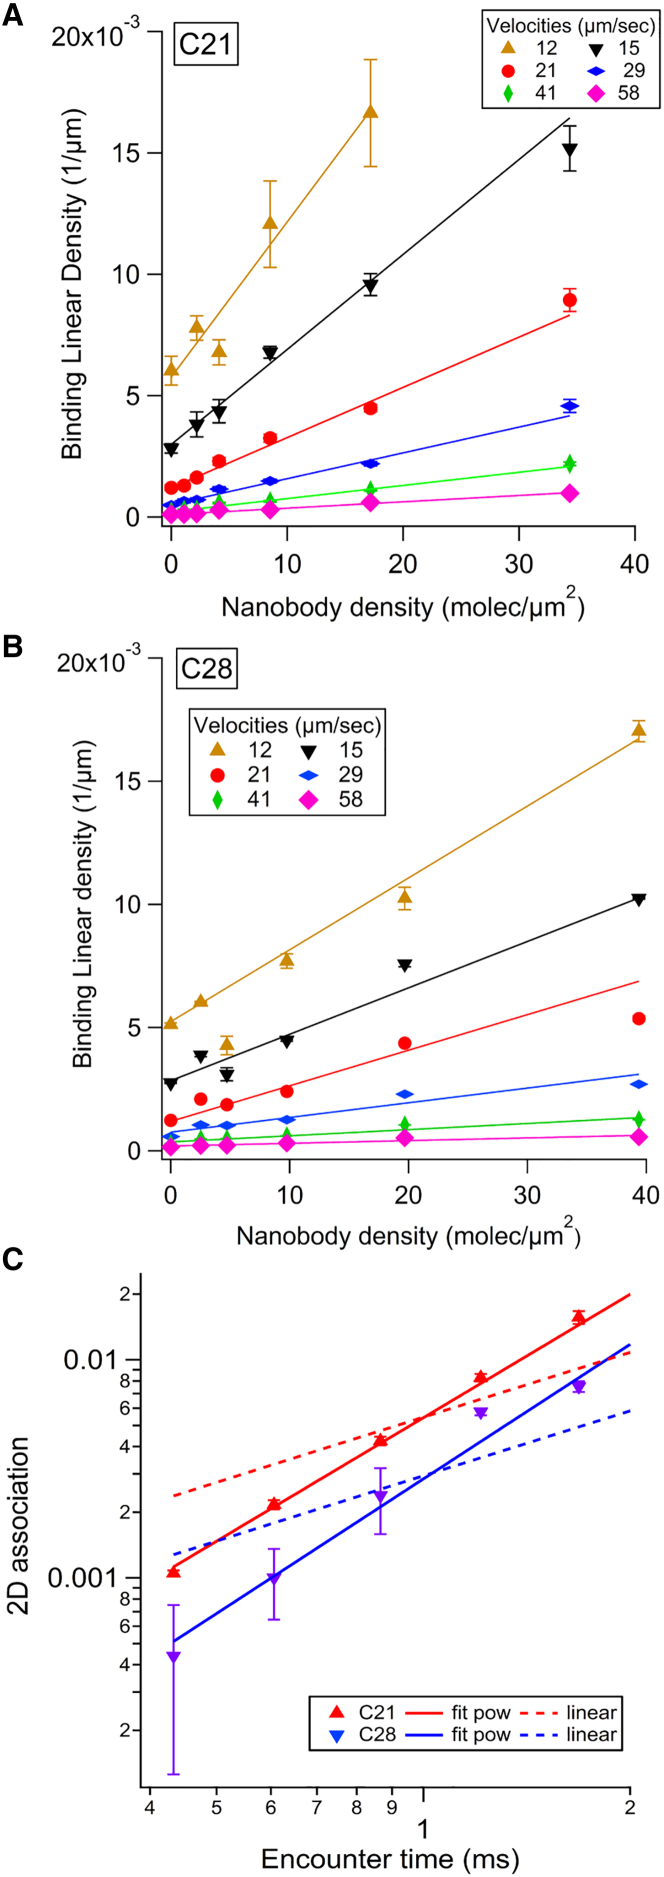
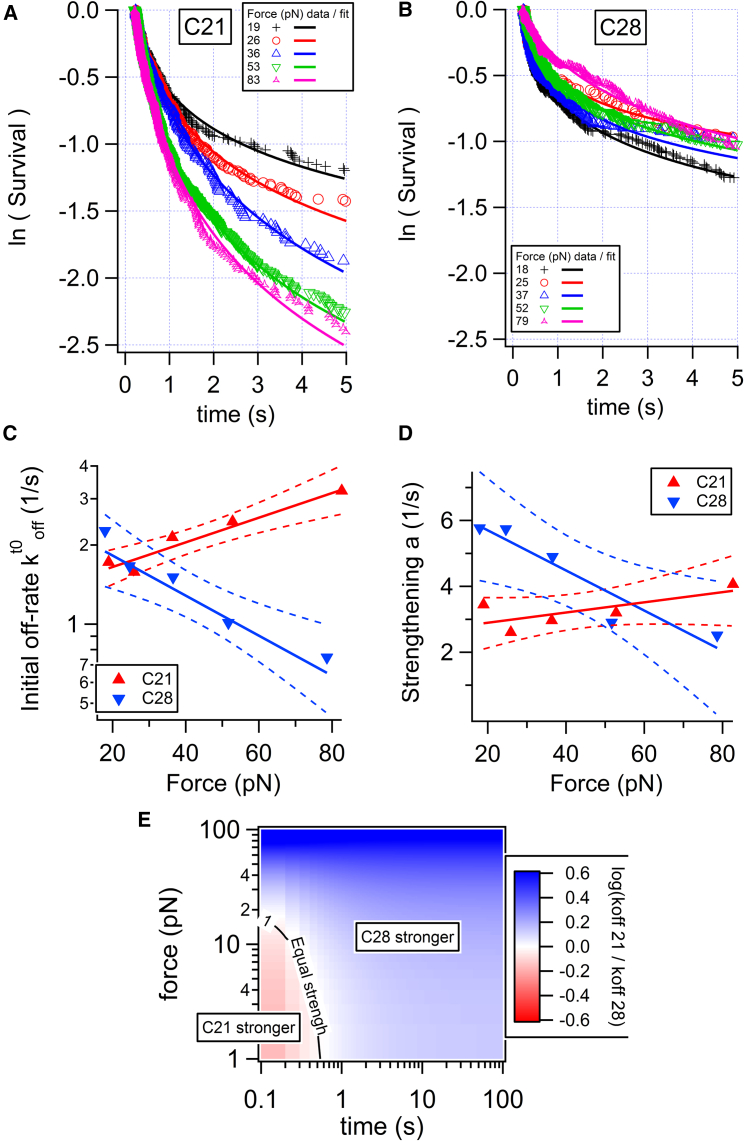
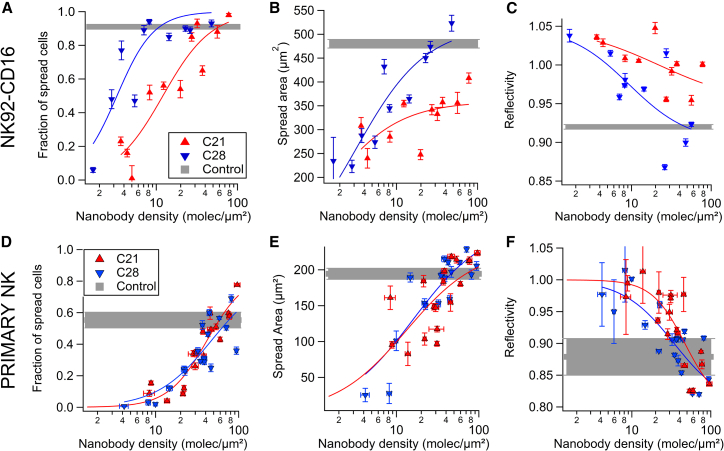
Antibodies are key tools in biomedical research and medicine. Their binding properties are classically measured in solution and characterized by an affinity. However, in physiological conditions, antibodies can bridge an immune effector cell and an antigen-presenting cell, implying that mechanical forces may apply to the bonds. For example, in antibody-dependent cell cytotoxicity-a major mode of action of therapeutic monoclonal antibodies-the Fab domains bind the antigens on the target cell, whereas the Fc domain binds to the activating receptor CD16 (also known as FcgRIII) of an immune effector cell, in a quasi-bidimensional environment (2D). Therefore, there is a strong need to investigate antigen/antibody binding under force (2D) to better understand and predict antibody activity in vivo. We used two anti-CD16 nanobodies targeting two different epitopes and laminar flow chamber assay to measure the association and dissociation of single bonds formed between microsphere-bound CD16 antigens and surface-bound anti-CD16 nanobodies (or single-domain antibodies), simulating 2D encounters. The two nanobodies exhibit similar 2D association kinetics, characterized by a strong dependence on the molecular encounter duration. However, their 2D dissociation kinetics strongly differ as a function of applied force: one exhibits a slip bond behavior in which off rate increases with force, and the other exhibits a catch-bond behavior in which off rate decreases with force. This is the first time, to our knowledge, that catch-bond behavior was reported for antigen-antibody bond. Quantification of natural killer cells spreading on surfaces coated with the nanobodies provides a comparison between 2D and three-dimensional adhesion in a cellular context, supporting the hypothesis of natural killer cell mechanosensitivity. Our results may also have strong implications for the design of efficient bispecific antibodies for therapeutic applications.


Figures

Figure 1
Figure 1
Analysis of 2D association of nanobodies C21 and C28 on recombinant CD16 measured with the LFC. (A and B) BLD plots versus nanobody C21 (A) and nanobody C28 (B) surface density obtained at six velocity peaks up of the sedimented microspheres are shown. A linear fit of the data is presented for each up. The error bars were defined as BLD divided by the square root of the number of arrests counted for the considered condition. (C) Plot of the 2D association (corresponding to the slope of the BLD versus density linear fit, normalized by the molecular length L = 25 nm (see Fig. S2)) as a function of the encounter time (defined as L/up) for C21 and C28 is shown. The error bars were calculated by the variation of the slope when considering the linear fit of BLD versus density line, obtained on a narrower density range (by removing the highest density). Data were fitted to a power law (plain line) or a linear law (dashed line). To see this figure in color, go online.
Figure 2
Figure 2
Analysis of 2D dissociation of nanobodies C21 and C28 from recombinant CD16 measured with the LFC. (A and B) Survival curves for surfaces coated with 125 ng/mL nanobody incubation concentration at various applied forces (in pN) are shown. Each curve was fitted with Eq. 1, where kofft0 is the initial dissociation rate and a is the rate of bond strengthening. (C and D) These rates are represented as a function of the force and fitted with Bell’s law kofft0=ko×exp(F/Fk) or an affine law a = ao × (1 + F/Fa). The solid triangles correspond to the average of kofft0 (C) or a (D) obtained for three different incubation concentrations (31, 62, 125 ng/mL) of nanobody. For each nanobody, linear regression was applied for ln(kofft0) or a vs. force for the set of data corresponding to the entire data set. Regression lines are thick, and 0.95 confidence lines are dashed. (E) The ratio of calculated off rates as a function of applied force and bond lifetime is shown. To see this figure in color, go online.
Figure 3
Figure 3
Binding of nanobodies to cell surface measured by flow cytometry. NK92-CD16 cells or primary NK cells were incubated with various concentrations of nanobody C21 or C28, and binding was detected using a fluorescent secondary antibody against the His tag. Results are average of six experiments on NK92-CD16 cells (A) and eight experiments (corresponding to eight different donors) on primary NK cells (B). Error bars are mean ± standard error. Before pooling, data were normalized by the values of the positive control obtained with the anti-CD16 monoclonal antibody 3G8. Data were fitted using Eq. 2. To see this figure in color, go online.
Figure 4
Figure 4
Spreading of NK cells on nanobody-coated surface measured by RICM (AC: NK92-CD16; DF: primary NK). (A and D) Plots of the fraction of spread cells in function of nanobody density are shown. (B and E) Plots of the spread area as a function of nanobody density are shown. (C and F) Plots of the reflectivity signal of adhered cells, which provides an estimate of the tightness of cell-surface contact, are shown as a function of nanobody density. In all experiments, controls correspond to cells spread on surfaces coated with the conventional anti-CD16 antibody 3G8 (see Fig. S5). (AC) Each point represents the pool of four separate experiments with at least 100 cells. (DF) Each point represents the average of at least 100 cells for one donor at one nanobody density (seven donors in total). All plain lines correspond to fits with a Hill function (see fit function and parameters in Table 3). Error bars are mean ± standard error. To see this figure in color, go online.
Figure 5
Figure 5
2D cell binding strength calculated from cytometry and spreading data for each nanobody and effector cell type (see text for details). To see this figure in color, go online.

References

    1. Murphy K., Travers P., Walport M. Seventh Edition. Garland Science; New York, NY: 2008. Janeway’s Immunobiology.
    1. Victora G.D., Nussenzweig M.C. Germinal centers. Annu. Rev. Immunol. 2012;30:429–457. - PubMed
    1. Natkanski E., Lee W.Y., Tolar P. B cells use mechanical energy to discriminate antigen affinities. Science. 2013;340:1587–1590. - PMC - PubMed
    1. Orange J.S. Formation and function of the lytic NK-cell immunological synapse. Nat. Rev. Immunol. 2008;8:713–725. - PMC - PubMed
    1. Tolar P., Spillane K.M. Force generation in B-cell synapses: mechanisms coupling B-cell receptor binding to antigen internalization and affinity discrimination. Adv. Immunol. 2014;123:69–100. - PubMed

Publication types

Substances

LinkOut - more resources