. 2019 May 21;50(5):1317-1334.e10.
doi: 10.1016/j.immuni.2019.03.009. Epub 2019 Apr 9.

Single-Cell Transcriptomics of Human and Mouse Lung Cancers Reveals Conserved Myeloid Populations across Individuals and Species

Affiliations

Single-Cell Transcriptomics of Human and Mouse Lung Cancers Reveals Conserved Myeloid Populations across Individuals and Species

Rapolas Zilionis et al. Immunity. .

Abstract

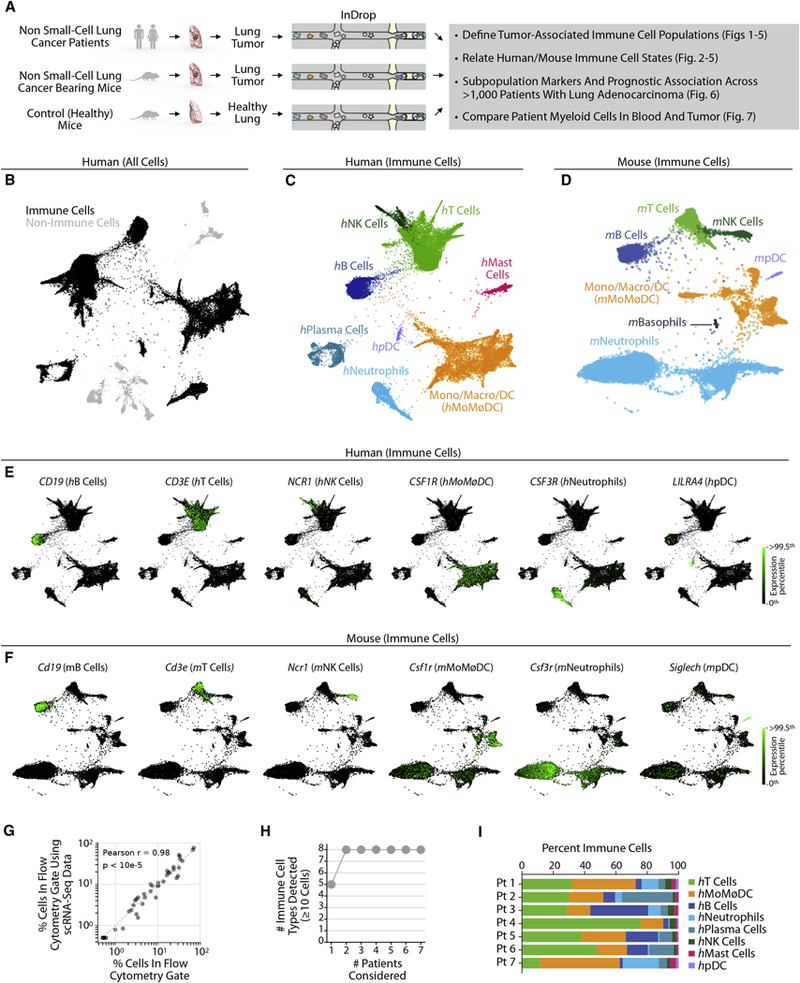
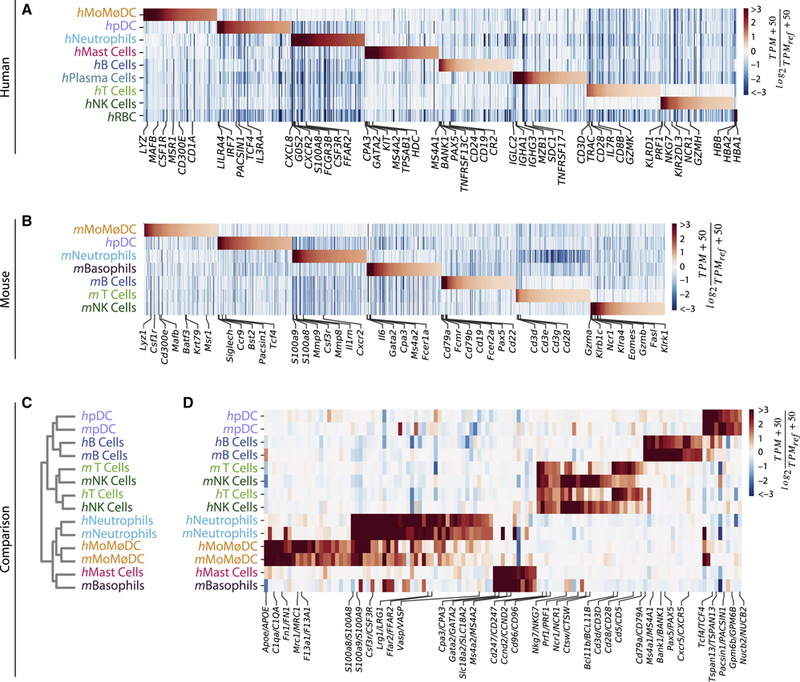
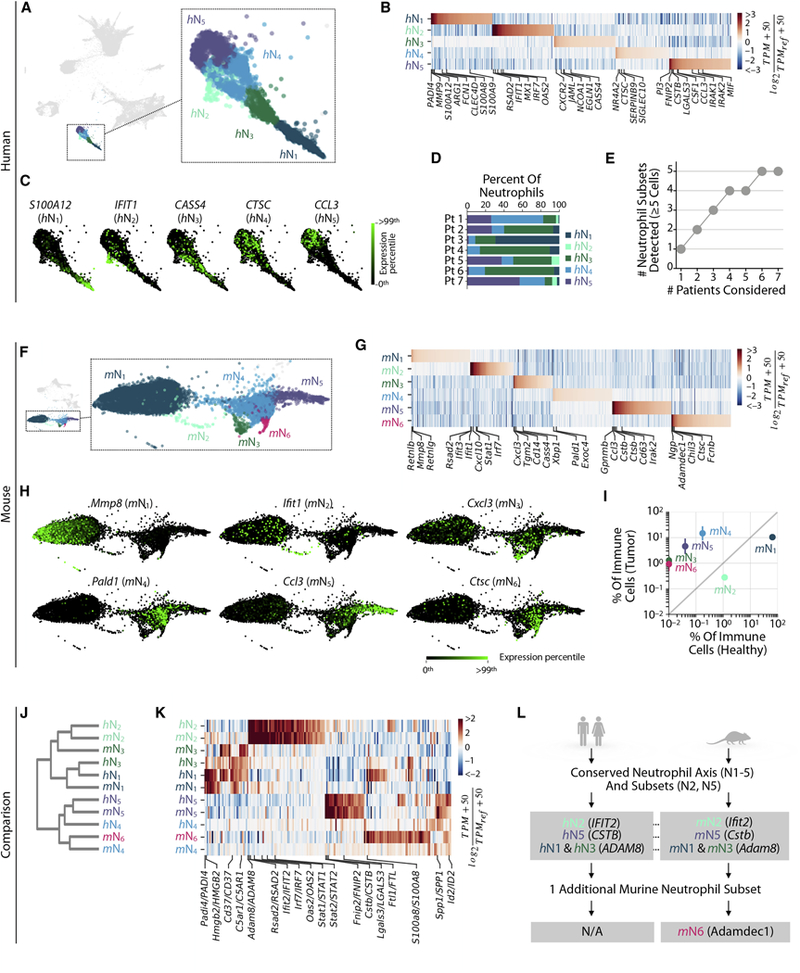
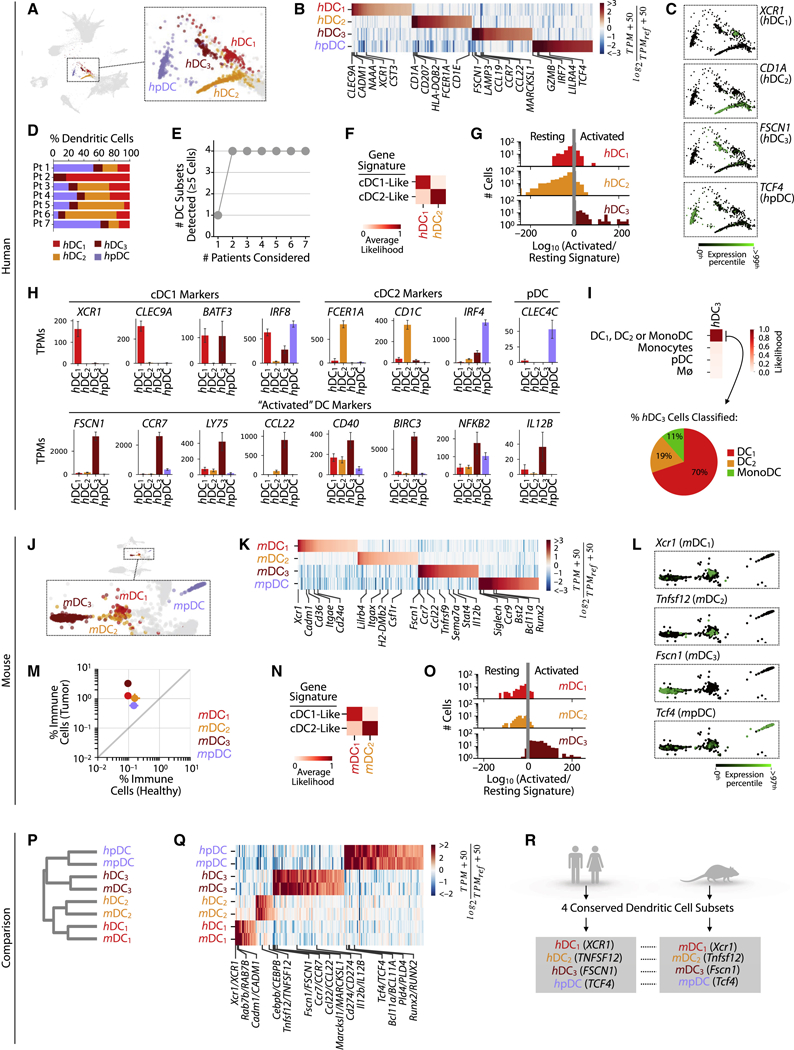
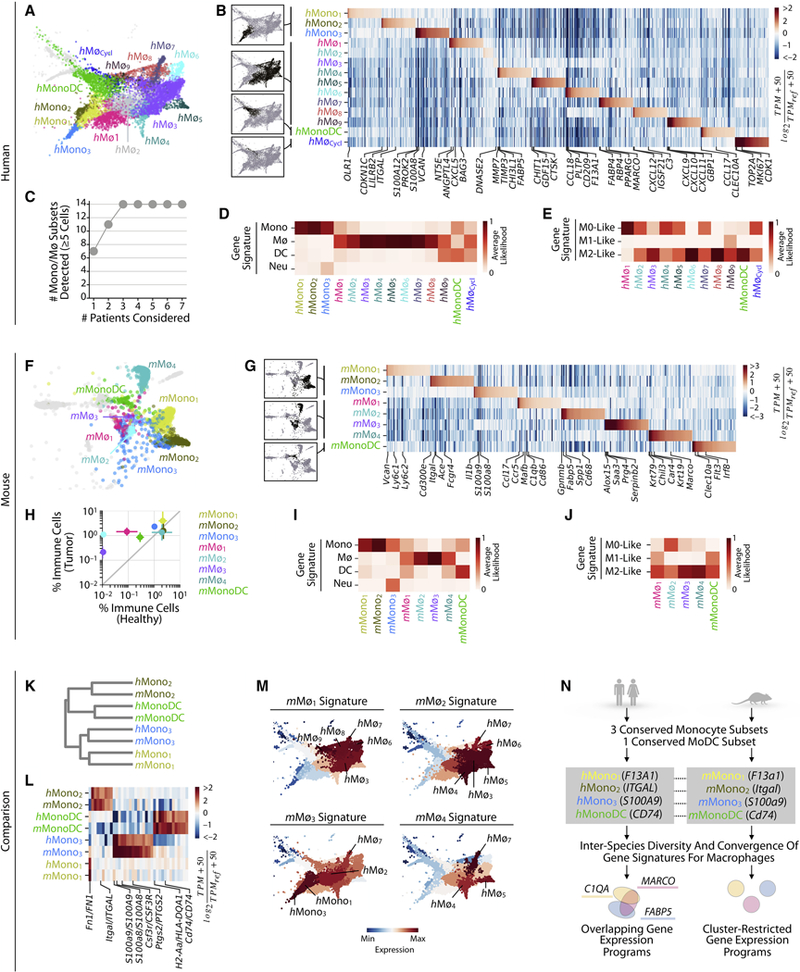
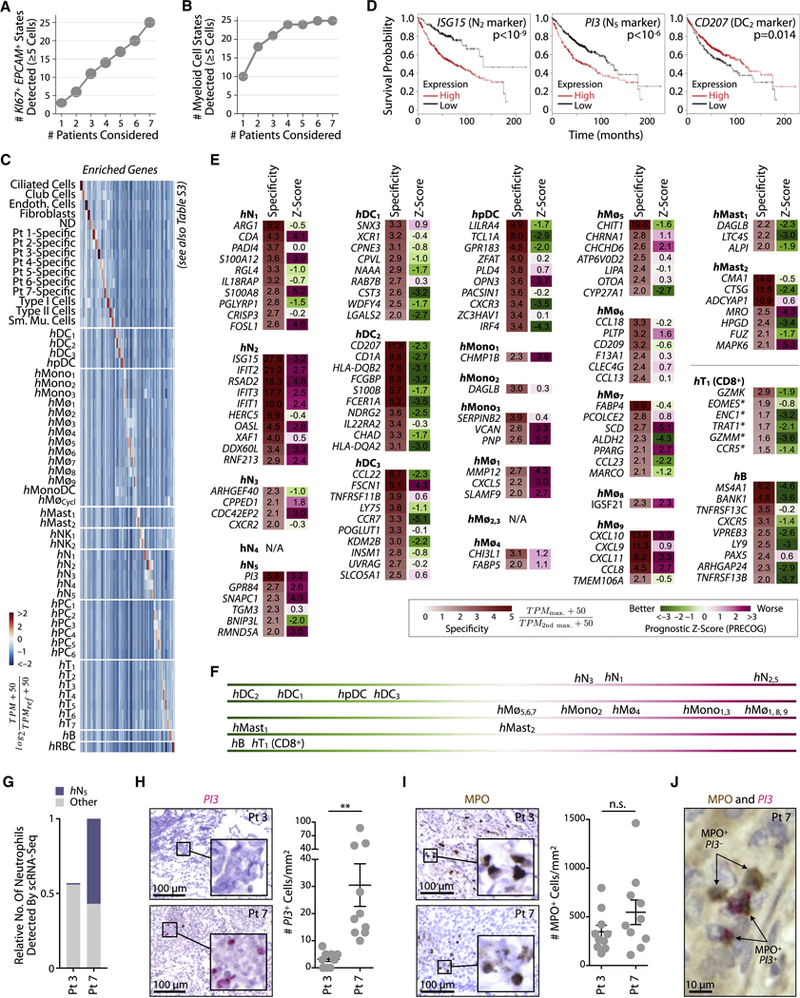
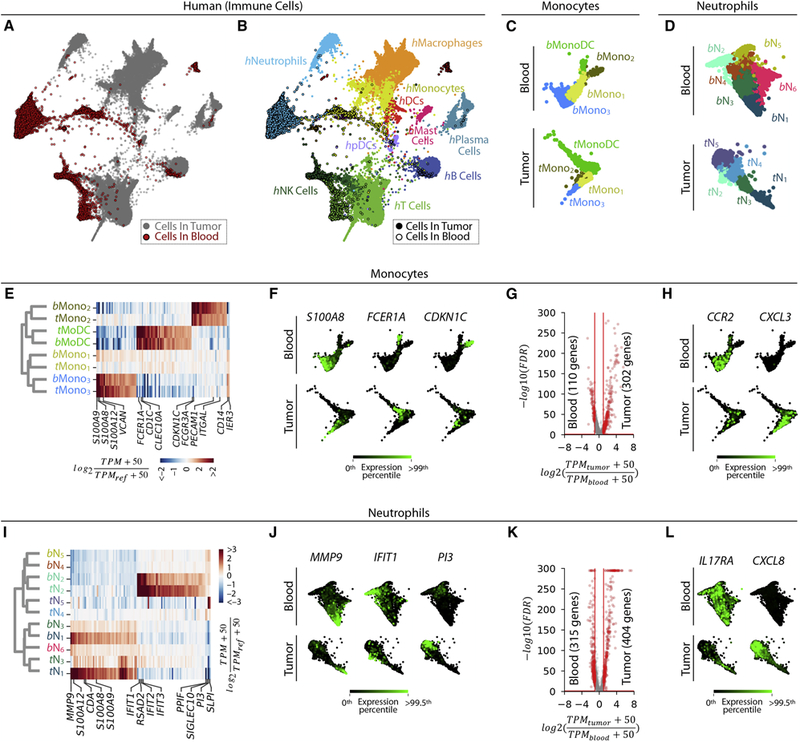
Tumor-infiltrating myeloid cells (TIMs) comprise monocytes, macrophages, dendritic cells, and neutrophils, and have emerged as key regulators of cancer growth. These cells can diversify into a spectrum of states, which might promote or limit tumor outgrowth but remain poorly understood. Here, we used single-cell RNA sequencing (scRNA-seq) to map TIMs in non-small-cell lung cancer patients. We uncovered 25 TIM states, most of which were reproducibly found across patients. To facilitate translational research of these populations, we also profiled TIMs in mice. In comparing TIMs across species, we identified a near-complete congruence of population structures among dendritic cells and monocytes; conserved neutrophil subsets; and species differences among macrophages. By contrast, myeloid cell population structures in patients' blood showed limited overlap with those of TIMs. This study determines the lung TIM landscape and sets the stage for future investigations into the potential of TIMs as immunotherapy targets.

Keywords: dendritic cell heterogeneity; macrophage heterogeneity; mouse-human comparison; myeloid cells; neutrophil heterogeneity; single-cell analysis; tumor immunology; tumor microenvironment.


Conflict of interest statement

Declaration of Interests

M.J.P. has served as a consultant for Aileron Therapeutics, Cygnal Therapeutics, Elstar Therapeutics, KSQ Therapeutics and Siamab Therapeutics; these commercial relationships are unrelated to the current study. AMK is a founder and shareholder in 1CellBio, Inc.

Figures

Figure 1
Figure 1. Single cell transcriptional profiling of mouse and human immune cells in non-small cell lung cancer
A Schematic of experimental workflow for defining and comparing immune transcriptional states in both species. Single cell suspensions for scRNAseq were prepared from patient lung tumor biopsies (n=7), murine lung tumors (n=2), and murine healthy lung tissue (n=2). B. Two-dimensional visualization (SPRING plots) of immune and non-immune single cell transcriptomes (n= 40,362) in patient lung tumor biopsies (n=7). C, D. SPRING plots of lung immune cells from (C) human patients (34,450 cells) and (D) mice (15,939 cells). Major cell types were defined by a Bayesian cell classifier using bulk whole-transcriptome profiles of FACS-sorted cell populations. E, F. Single cell gene expression for representative immune cell type-enriched genes in human and mouse immune cells. G. Comparison of mouse immune cell frequencies measured by flow cytometry to scRNA-Seq clusters satisfying the same gating scheme. H. Cumulative plot of number of immune cell types detected with patient number. Patients were ordered by increasing number of populations detected. I. Inter-patient heterogeneity revealed by plotting per-patient immune cell type distribution. See also Figure S1.
Figure 2
Figure 2. Immune cell types show orthologous gene expression between mouse and human at the level of major lineages.
A, B. Enriched genes within major immune cell types in human and mouse samples. TPMREF = second-highest expression value per gene, transcripts per million. C. Hierarchical clustering of major cell lineages by correlation of gene expression groups cells by cell type, not organism. Cell type labels as in Fig. 1C–D. D. Heat map showing gene orthologs similarly enriched within mouse and human immune cell types. TPMREF = median expression value per gene, transcripts per million. See also Figure S2.
Figure 3
Figure 3. Human and mouse lung tumors contain a conserved axis of neutrophil phenotypes and a distinct neutrophil subset showing type I interferon response
Lung neutrophil subsets defined in A-E human patient tumors and F-I mouse tumor and healthy tissues. A. SPRING plot from Fig. 1C showing neutrophil subsets. B. Genes enriched between neutrophil subsets. TPMREF defined as in Fig. 2A. C. Single cell expression of representative subset-enriched genes. D. The frequency of lung tumor neutrophils subsets varies between patients. E. Cumulative plot of the number of neutrophil subsets detected with patient number. F-H show mouse equivalents of A-C. I. The tumor specificity of mouse neutrophil subsets assessed by plotting their frequency in tumor versus healthy tissue samples. Bars show the two replicate value of each condition. J-L. Comparison of mouse and human neutrophil subsets. J. Orthologous murine and human neutrophil subsets established by hierarchal clustering. K. Heat map showing genes similarly enriched within mouse and human neutrophil subsets. TPMREF defined as in Fig. 2D. L. Summary of mouse/human comparison showing a conserved axis of neutrophil phenotypes ranging from N1 to N5, the latter being tumor-specific and tumor-promoting in mice. A rare, but distinct neutrophil subset with a type I interferon response expression signature is also present in both mouse and human. See also Figure S3.
Figure 4
Figure 4. Single cell transcriptional analysis of dendritic cells reveals four distinct subsets that are conserved between mouse and humans.
Dendritic cell (DC) subsets defined in A-G humans patients, and H-M mice. A.SPRING plot showing DC subsets. B. Genes enriched between DC subsets. TPMREF defined as in Fig. 2A. C. Single cell expression of representative subset-enriched genes. D. Distribution of lung tumor DC subsets in each patient. E. Cumulative plot of the number DC subsets detected with patient number. F. Classification by cDC1 or cDC2 gene signatures reveals the identity of hDC½ subsets. G. Single cell histogram of activated vs resting likelihood ratio reveals the identity of h/mDC3. H. Expression of canonical DC markers across DC subsets. I. Likelihood of hDC3 cells classified as hDC1, hDC2, or MonoDC. J-L, N-O show mouse equivalents of A-C, F-G. M. Tumor-enrichment of all DC subsets seen from the fraction of each DC subsets in tumor and healthy tissues. Bars show the two replicate value of each condition. P-R. Comparison of mouse and human DC subsets. P. Orthologous murine and human DC subsets established by hierarchal clustering. Q. Heat map showing genes similarly enriched within mouse and human DC subsets. TPMREF defined as in Fig. 2D. R. Summary of mouse and human DC subset comparison showing a one-to-one correspondence of four distinct DC subsets (DC1–3, and pDC). See also Figure S4.
Figure 5
Figure 5. Monocyte subsets are well conserved between mouse and human, whereas macrophage subsets show inter-species heterogeneity.
Monocyte (Mono) and macrophage (Mø) subsets defined in A-E human patients, and F-J mice. A. SPRING plot showing Mono/Mø subsets. B. Genes enriched between Mono/Mø subsets. TPMREF defined as in Fig. 2A. C. Cumulative plot of the number of Mono/Mø/MonoDC subsets detected with patient number. D. Classification of Mono/Mø/MonoDC subclusters by Mono, DC, Mø and neutrophil gene signatures. E. Classification of macrophage subsets by M0/M1/M2-like gene signatures. F-G, I-J show mouse equivalents of A-B and D-E. H. Tumor-enrichment of Mø, MonoDC but not Mono subsets, seen from the fraction of each each Mono/Mø/MonoDC subset in the tumor vs healthy tissues. Bars show the two replicate value of each condition. K-N. Comparison of mouse and human Mono/Mø/MonoDC subsets. K. Orthologous murine and human monocyte subsets established by hierarchal clustering. L. Heat map showing genes similarly enriched within mouse and human Mono/MonoDC subsets. TPMREF defined as in Fig. 2D. M. Expression of mouse Mø gene signatures within human Mono/Mø/MonoDC subsets shows partially conserved patterns in macrophage transcriptional programs between species. N. Summary of mouse and human Mono/Mø/MonoDC subset comparisons showing the correspondence between Mono and MonoDC subsets. Some gene expression patterns of murine and human Mø subsets were conserved, but Mø subsets exhibited the greatest inter-species variation overall. See also Figure S5.
Figure 6
Figure 6. Unique marker genes for TIM subsets and their association with patient survival
A, B. Plots of state diversity as a function of sampled patient count shows that patient tumor epithelial cell states are far from saturation while myeloid subsets approach saturation. C. Identification of genes enriched in expression in each cell subset as compared to all others in the human tumor microenvironment. Color bar as in Fig. 2A. D. Kaplan-Meier plots of showing differences in survival amongst lung adenocarcinoma patients (n=720) stratified by expression of selected markers (Gyorffy et al., 2013) for hN2 (LSG15), hN5 (PI3), and hDC2 (CD207). P-values from univariate cox regression. E. Prognostic z-scores derived from lung adenocarcinoma patient data (n=1,127) (Gentles et al., 2015) for genes most specific to unique cell-states as determined by scRNAseq and shown in panel C. Negative and positive prognostic z-scores respectively associate with favorable and adverse prognosis. F.Summary of trends in immune cell subset association with patient survival shown in E. G-J. Detection of hN5 PI3+ and all neutrophils (MPO+) in lung adenocarcinoma in situ. G, scRNAseq prediction for the relative number of total and hN5 neutrophils detected in patients 3 and 7 (1=total neutrophil count in patient 7). H.In situ hybridization for PI3 transcripts on tumor sections supports a significant enrichment of hN5 neutrophils in patient 7 as predicted by scRNAseq. Quantification data points correspond to distinct fields of view (n=10), two-tailed t-test p-value < 0.01. I. Detection of the pan-neutrophil marker MPO by immunohistochemistry reveals a comparable fraction of neutrophils in patient 7 relative to patient 3 (quantification as in H). J. Co-staining of MPO and PI3 supports the prediction that PI3+ cells are MPO+. See also Figure S6.
Figure 7
Figure 7. Tumor infiltrates only partially overlap with states of the peripheral blood
A, B. Two-dimensional visualization (SPRING plots) of immune cell transcriptomes from patient blood (n=6) and tumor samples (n=7). Cells colored by (A) sample origin (tumor= grey; blood= red) and (B) inferred immune cell type. C, D. Spectral clustering of Mono/MonoDC and Neutrophil subsets in blood, shown alongside tumor clusters from Figs. 4, 5. E. Homologous tumor and blood monocyte subsets established by hierarchal clustering; heat map shows similarly enriched genes. TPMREF defined as in Fig. 2D. F. Selected examples of genes showing conserved patterns of expression between blood and tumor monocyte populations. G. Volcano plot identifying differentially expressed genes between tumor and blood monocytes. H. Examples of genes enriched in blood (CCR2) and tumor (CXCL3) monocytes. I-L. show Neutrophils equivalents for E-H. See also Figure S7.

References

    1. Ardouin L, Luche H, Chelbi R, Carpentier S, Shawket A, Montanana Sanchis F, Santa Maria C, Grenot P, Alexandre Y, Gregoire C, et al. (2016). Broad and Largely Concordant Molecular Changes Characterize Tolerogenic and Immunogenic Dendritic Cell Maturation in Thymus and Periphery. Immunity 45, 305–318. - PubMed
    1. Binnewies M, Roberts EW, Kersten K, Chan V, Fearon DF, Merad M, Coussens LM, Gabrilovich DI, Ostrand-Rosenberg S, Hedrick CC, et al. (2018). Understanding the tumor immune microenvironment (TIME) for effective therapy. Nat Med 24, 541–550. - PMC - PubMed
    1. Bogaert DJ, Dullaers M, Lambrecht BN, Vermaelen KY, De Baere E, and Haerynck F (2016). Genes associated with common variable immunodeficiency: one diagnosis to rule them all? J Med Genet 53, 575–590. - PubMed
    1. Briggs JA, Weinreb C, Wagner DE, Megason S, Peshkin L, Kirschner MW, and Klein AM (2018). The dynamics of gene expression in vertebrate embryogenesis at single-cell resolution. Science 360, eaar5780. - PMC - PubMed
    1. Broz ML, Binnewies M, Boldajipour B, Nelson AE, Pollack JL, Erle DJ, Barczak A, Rosenblum MD, Daud A, Barber DL, et al. (2014). Dissecting the tumor myeloid compartment reveals rare activating antigen-presenting cells critical for T cell immunity. Cancer Cell 26, 638–652. - PMC - PubMed

Publication types