. 2020 Feb;69(2):355-364.
doi: 10.1136/gutjnl-2018-318021. Epub 2019 Apr 12.

Polyploidy spectrum: a new marker in HCC classification

Affiliations

Polyploidy spectrum: a new marker in HCC classification

Myriam Bou-Nader et al. Gut. 2020 Feb.

Abstract

Objectives: Polyploidy is a fascinating characteristic of liver parenchyma. Hepatocyte polyploidy depends on the DNA content of each nucleus (nuclear ploidy) and the number of nuclei per cell (cellular ploidy). Which role can be assigned to polyploidy during human hepatocellular carcinoma (HCC) development is still an open question. Here, we investigated whether a specific ploidy spectrum is associated with clinical and molecular features of HCC.

Design: Ploidy spectra were determined on surgically resected tissues from patients with HCC as well as healthy control tissues. To define ploidy profiles, a quantitative and qualitative in situ imaging approach was used on paraffin tissue liver sections.

Results: We first demonstrated that polyploid hepatocytes are the major components of human liver parenchyma, polyploidy being mainly cellular (binuclear hepatocytes). Across liver lobules, polyploid hepatocytes do not exhibit a specific zonation pattern. During liver tumorigenesis, cellular ploidy is drastically reduced; binuclear polyploid hepatocytes are barely present in HCC tumours. Remarkably, nuclear ploidy is specifically amplified in HCC tumours. In fact, nuclear ploidy is amplified in HCCs harbouring a low degree of differentiation and TP53 mutations. Finally, our results demonstrated that highly polyploid tumours are associated with a poor prognosis.

Conclusions: Our results underline the importance of quantification of cellular and nuclear ploidy spectra during HCC tumorigenesis.

Keywords: cell cycle; hepatocellular carcinoma; histopathology; liver; molecular pathology.


Conflict of interest statement

Competing interests: None declared.

Figures

Figure 1
Figure 1
Cellular and nuclear ploidy: distribution and zonation in adult human liver lobule. (A) Images of human liver section immunostained with pan keratin/β-catenin (plasma membrane labelling, green), glutamine synthetase (centrilobular zone labelling, red) and Hoechst (nucleus labelling, blue). Liver lobules were divided into three regions (periportal (PP), mid-lobular (ML), centrilobular (CL)) as indicated (merge image). Cellular and nuclear ploidy profiles were quantified in each zone (scale bar: 200 µm). Magnification image highlights binuclear and mononuclear hepatocytes (* indicates binuclear hepatocytes) (scale bar: 40 µm). (B) Images of a nuclear ploidy map: nuclei are artificially coloured according to their ploidy content: 2n/purple, 4n/green, ≥8n/red. Centrilobular zones appear as white staining (scale bar: 40 µm). Higher magnification images: scale bar=150 µm. (C) Global ploidy (cellular and nuclear) distribution in adult livers (n=13): 2n hepatocytes, 4n hepatocytes (binuclear 2×2n and mononuclear 4n), ≥8n hepatocytes (binuclear 2×≥4n and mononuclear ≥8n). (D) Distribution of binuclear (purple: binuclear 2×2n and 2×≥4n) and mononuclear (blue: mononuclear 4n and ≥8n) fractions in normal human livers (n=13). (E) Binuclear polyploid fraction (light purple: 2×2n, dark blue: 2×≥4n) and nuclear ploidy content in mononuclear fraction (light blue: 4n, dark blue: ≥8n) in normal human livers (n=13). (F) Quantification of diploid hepatocytes according to human liver zonation (centrilobular [CL]/mid-lobular [ML]/periportal [PP] regions). (G) Quantification of mononuclear polyploid hepatocytes (4n, ≥8n) and binuclear polyploid hepatocytes (2×2n, 2×≥4n) according to human liver zonation (CL, ML, PP regions). Data were compared using Kruskal-Wallis test. GS, glutamine synthetase; ns, not significant.
Figure 2
Figure 2
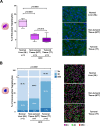
Cellular and nuclear ploidy spectra during human liver carcinogenesis. (A) Left panel: box plots for the percentage of binuclear hepatocytes (2×2n and 2×≥4n) relative to total hepatocytes population. The bottom, central and top lines of each box represent the first quartile, median and third quartile of the distribution, respectively (n=13 for normal liver [NL], n=14 for non-tumorous tissue [NTT] and HCC tumorous tissue [TT]). Values represent the mean±SEM. Data were compared using Kruskal-Wallis test. Right panel: representative magnification images (scale bar: 40 µm) highlight binuclear and mononuclear hepatocytes in NL, NTT and HCC TT. (B) Left panel: percentage of mononuclear 2n, 4n and ≥8n hepatocytes relative to total mononuclear hepatocytes in each group (NL, NLT and TT); n corresponds to the number of patients analysed. Data were compared using multivariate analysis of variance (MANOVA). Right panel: representative higher magnification images of nuclear ploidy spectrum (NL, NTT, TT). HCC, hepatocellular carcinoma.
Figure 3
Figure 3
Alteration of nuclear ploidy spectrum related to histological and molecular features of hepatocellular carcinoma (HCC). (A, B) Comparison of the percentage of mononuclear diploid (2n), tetraploid (4n) and highly polyploid (≥8n) hepatocytes in HCC tumours according to tumour differentiation (A) (good n=13, medium n=49 and weak n=12), to the presence of inflammatory infiltrates (B) (no infiltrates n=45, infiltrates n=30). (C) Comparison of the percentage of mononuclear diploid (2n), tetraploid (4n) and highly polyploid (≥8n) hepatocytes in HCC tumours mutated (M) or non-mutated (NM) for TERT promoter, CTNNB1 and TP53. n corresponds to the number of patients analysed. Data were compared using multivariate analysis of variance (MANOVA). ns, not significant.
Figure 4
Figure 4
Patients with poorly or highly polyploid hepatocellular carcinoma (HCC) show a significant difference in disease-free survival. (A) Representative nuclear ploidy mapping of a poorly and a highly polyploid HCC (scale bar: 500 µm). T indicates HCC tumours, NT non-tumorous surrounding tissue. Mononuclear hepatocytes are coloured according to their ploidy class: purple 2n, green 4n, red, ≥8n. (B) Density plot represents the distribution of per cent of mononuclear polyploid hepatocytes (≥4n) in tumour tissue samples with the distinction of poorly polyploid HCCs (<50% of polyploid contingent) and highly polyploid HCCs (>50% of polyploid contingent). (C) Disease-free survival (DFS) probability (at 2 and 5 years) in patients with HCC tumours. Data were compared using Kaplan-Meier curves with log-rank test.
Figure 5
Figure 5
Highly polyploid hepatocellular carcinomas (HCC) are more proliferative than poorly polyploid HCCs. (A) Corrplot showing Spearman’s rank correlations between the proportion of mononuclear diploid (2n) or polyploid (4n, ≥8n) hepatocytes and the expression of five proliferation markers in 68 HCC samples. Red circles indicate significant positive correlations. Green circles indicate negative correlations. Colour intensities reflect the rho correlation coefficient. (B) Poorly and highly polyploid tumours have different histological and molecular features. Figure summarising associations between the polyploid contingent of the tumour and the histological and molecular characteristics of 68 HCC samples analysed by qPCR. Samples are sorted into columns according to their proportion of polyploid cells (≥4n). Upper panel shows the associations with gene mutations and tumour differentiation grade. Statistical analysis was performed using Fisher’s exact tests and χ2 test for gene mutations and differentiation, respectively. Bottom panel represents the heat map showing colour-coded gene expression levels of five proliferation markers. Upregulated and downregulated genes are represented in shades of red and blue, respectively.

References

    1. Davoli T, de Lange T. The causes and consequences of polyploidy in normal development and cancer. Annu Rev Cell Dev Biol 2011;27:585–610. 10.1146/annurev-cellbio-092910-154234 - DOI - PubMed
    1. Gentric G, Desdouets C. Polyploidization in liver tissue. Am J Pathol 2014;184:322–31. 10.1016/j.ajpath.2013.06.035 - DOI - PubMed
    1. Fox DT, Duronio RJ. Endoreplication and polyploidy: insights into development and disease. Development 2013;140:3–12. 10.1242/dev.080531 - DOI - PMC - PubMed
    1. Ganem NJ, Storchova Z, Tetraploidy PD. aneuploidy and cancer. Curr Opin Genet Dev 2007;17:157–62. - PubMed
    1. Gentric G, Celton-Morizur S, Desdouets C. Polyploidy and liver proliferation. Clin Res Hepatol Gastroenterol 2012;36:29–34. 10.1016/j.clinre.2011.05.011 - DOI - PubMed

Publication types

MeSH terms

Substances