

YY1 regulates skeletal muscle regeneration through controlling metabolic reprogramming of satellite cells
- PMID: 30979776
- PMCID: PMC6518041
- DOI: 10.15252/embj.201899727
YY1 regulates skeletal muscle regeneration through controlling metabolic reprogramming of satellite cells
Abstract
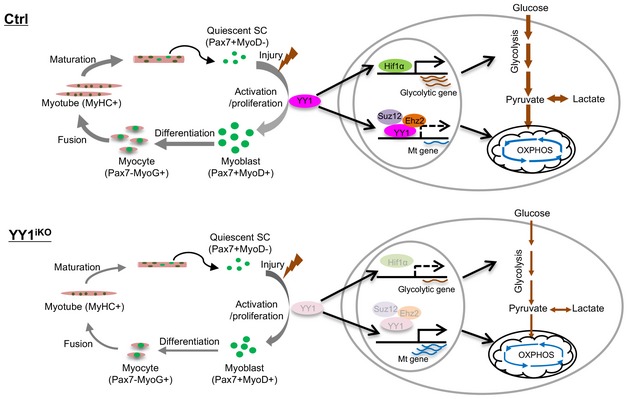
Skeletal muscle satellite cells (SCs) are adult muscle stem cells responsible for muscle regeneration after acute or chronic injuries. The lineage progression of quiescent SC toward activation, proliferation, and differentiation during the regeneration is orchestrated by cascades of transcription factors (TFs). Here, we elucidate the function of TF Yin Yang1 (YY1) in muscle regeneration. Muscle-specific deletion of YY1 in embryonic muscle progenitors leads to severe deformity of diaphragm muscle formation, thus neonatal death. Inducible deletion of YY1 in SC almost completely blocks the acute damage-induced muscle repair and exacerbates the chronic injury-induced dystrophic phenotype. Examination of SC revealed that YY1 loss results in cell-autonomous defect in activation and proliferation. Mechanistic search revealed that YY1 binds and represses mitochondrial gene expression. Simultaneously, it also stabilizes Hif1α protein and activates Hif1α-mediated glycolytic genes to facilitate a metabolic reprogramming toward glycolysis which is needed for SC proliferation. Altogether, our findings have identified YY1 as a key regulator of SC metabolic reprogramming through its dual roles in modulating both mitochondrial and glycolytic pathways.
Keywords: Hif1α; YY1; metabolic reprogramming; muscle satellite cell; skeletal muscle regeneration.
© 2019 The Authors.
Conflict of interest statement
The authors declare that they have no conflict of interest.
Figures
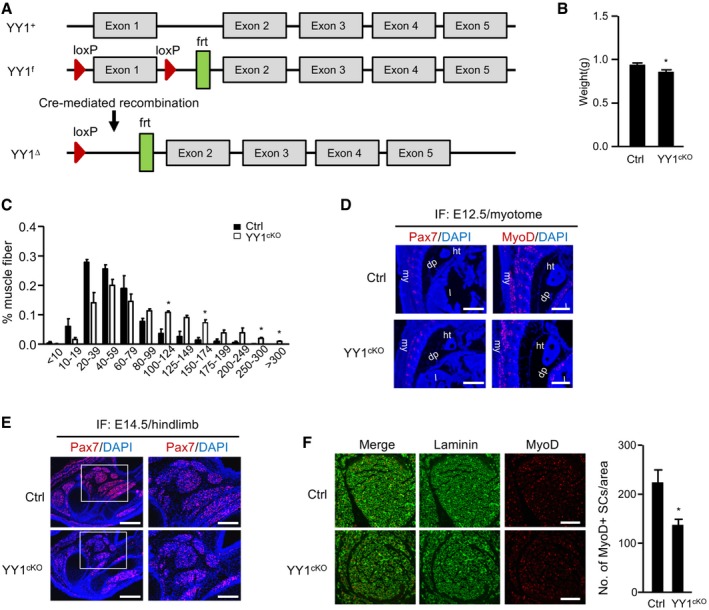
Schematic illustration of YY1 locus from wild‐type (YY1+), YY1 floxed (YY1f) with the exon 1 flanked by two loxP sites and YY1 Cre‐mediated (YY1∆) mice.
Quantification of body weight from Ctrl or YY1cKO littermate mice (n = 4, each).
Cross‐section area (CSA) of individual myofibers in the above harvested limb muscles was measured. The percentage of myofibers with a defined range of CSA over the total myofibers was calculated (n = 3 mice, each).
Pax7 (red) or Myod (red) staining was performed on cryosections of myotome from Ctrl or YY1cKO mice at E12.5. ht: heart; my: myotome; dp: diaphragm; l: liver; Scar bar = 400 μm.
Pax7 (red) staining was performed on cryosections of hindlimbs from Ctrl or YY1cKO mice at E14.5. Scale bar (left) = 400 μm. Scale bar (right) = 200 μm.
Limb muscles (E18.5) were subject to IF staining for MyoD and laminin. Scale bar = 100 μm. Quantification of the numbers of MyoD+ muscle progenitor cells per area is shown on the right (n = 3 mice, each).
- A
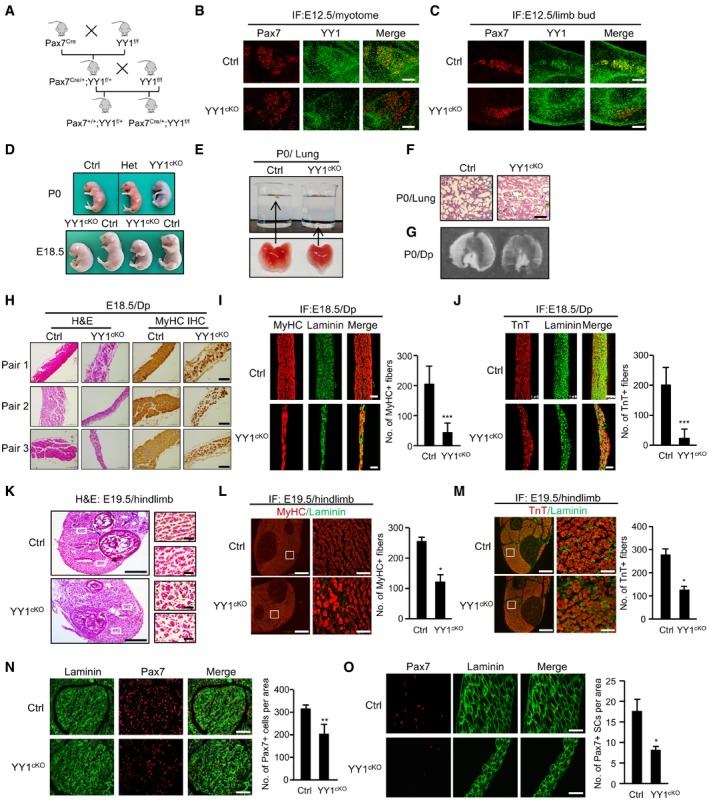
Breeding scheme for generating conditional knock out (YY1cKO), Pax7Cre/+; YY1f/f, and control (Ctrl), Pax7+/+; YY1f/+ littermates.
- B, C
Immunofluorescent (IF) staining of Pax7 and YY1 was performed on cryosections of myotome or limb bud from Ctrl or YY1cKO mice to confirm the ablation of YY1 in Pax7‐expressing progenitors. Scale bar = 100 μm.
- D
Representative images of Ctrl, heterozygous (Het), and YY1cKO newborn (P0) mice or embryos at E18.5 day.
- E
Excised lungs from P0 Ctrl or YY1cKO pups were placed in a beaker for sinking test. The lung from YY1cKO pup sank whereas Ctrl floated.
- F
P0 lungs were stained with hematoxylin and eosin (H&E), and representative images are shown. Scale bar = 100 μm.
- G
Representative images of diaphragms (Dps) isolated from P0 Ctrl or YY1cKO littermates.
- H
The above Dps were used for H&E or immunohistochemistry (IHC) staining for MyHC. Representative images from three pairs of littermates are shown. Scale bar = 100 μm.
- I, J
The above harvested Dps were subjected to IF staining for MyHC or troponin T (TnT) together with laminin. Scale bar = 50 μm. Quantifications of positively stained fibers per area are shown on the right (n = 3 mice, each).
- K
Representative images of H&E staining of hindlimb muscles isolated from Ctrl or YY1cKO embryos at E18.5 day. Scale bar = 400 μm (left) or 50 μm (right).
- L, M
The above harvested limb muscles were subjected to IF staining for MyHC or TnT together with laminin. Scale bar = 400 μm (left) or 50 μm (right). Quantifications of the numbers of MyHC+ or TnT+ fibers per area are shown on the right (n = 3 mice, each).
- N, O
The above harvested limb (N) or diaphragm (O) muscles were subjected to IF staining for Pax7 and laminin. Scale bar = 100 μm (N) or 50 μm (O). Quantification of the numbers of Pax7+ muscle progenitor cells per area is shown on the right (n = 3 mice, each).
- A
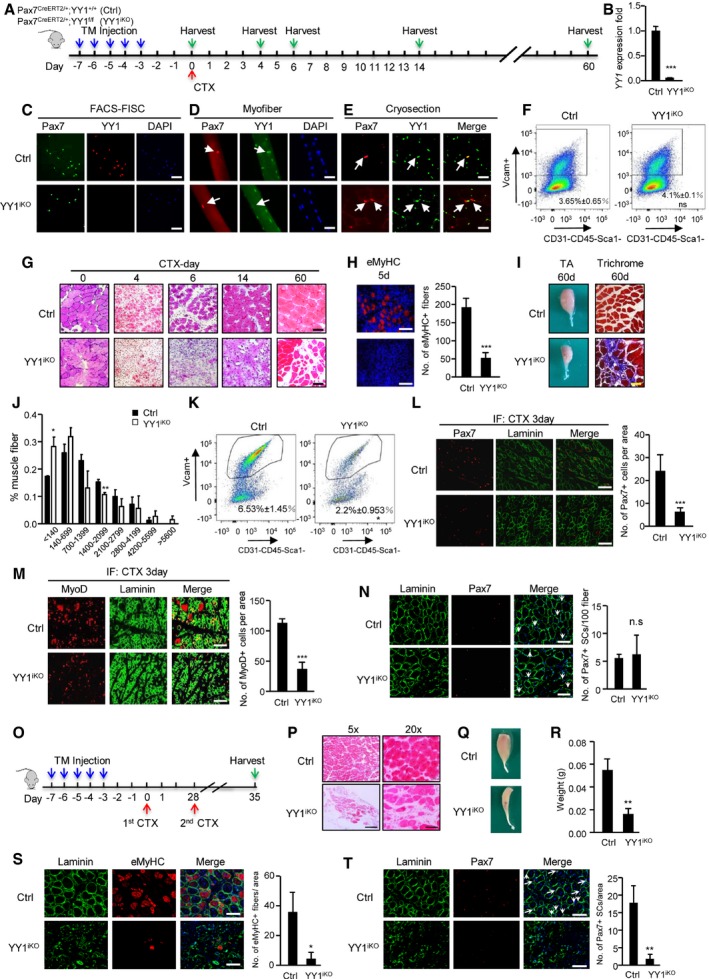
Schematic outline of the tamoxifen (TM) administration used in the study and experimental design for testing the effect of YY1 deletion on cardiotoxin (CTX)‐induced muscle regeneration process for control (Ctrl), Pax7CreERT2/+; YY1+/+ and inducible knock out (YY1iKO), Pax7CreERT2/+; YY1f/f mice.
- B
SCs were FACS‐sorted 3 days after the last TM injection and cultured for 1.5 days; RT–qPCR detection of YY1 mRNA shows the ablation in YY1iKO cells.
- C–E
IF staining for Pax7 and YY1 on (C) freshly isolated FISCs or (D) single myofibers from EDL muscles or (E) cryosections from TA muscles showing the deletion of YY1 protein from YY1iKO cells. Scale bar = 100 μm in (C) or 50 μm in (D, E).
- F
Representative FACS plots. About 100,000 cells from 2‐month‐old Ctrl and YY1iKO mice were sorted by FACS 3 weeks post‐TM injection. The percentage of SCs was shown. (n = 3 mice, each).
- G
H&E staining was performed on the injured TA muscles collected from the designated times post‐CTX injection to visualize the degree of regeneration. Scale bar = 100 μm.
- H
IF staining for eMyHC on the TA muscles 5 days post‐CTX injury. Quantifications of the number of eMyHC+ fibers are shown on the right (n = 3, each). Scale bar = 50 μm.
- I
Left: representative images of TA muscles isolated from Ctrl or YY1iKO mice 60 days post‐CTX injury. Right: Masson's trichrome staining of the above muscles to visualize the degree of fibrosis. Scale bar = 100 μm.
- J
Cross‐section area (CSA) of individual myofibers in TA muscles 4 weeks after injury was measured. The distribution for CSA was calculated (n = 3 mice).
- K
Representative FACS plots showing the percentage of SCs sorted from TA muscles 3 days after CTX injury of Ctrl and YY1iKO mice.
- L, M
Immunostaining for Pax7 or MyoD together with laminin was performed on the TA muscles 3 days post‐CTX injury. Scale bar = 100 μm. Quantifications of the numbers of Pax7+ or MyoD+ SCs per area are shown on the right (n = 3 mice, each).
- N
IF staining for Pax7 and laminin on TA muscles 4 weeks after CTX injury of Ctrl or YY1iKO mice. Quantifications of the numbers of Pax7+ SCs per 100 fibers are shown on the right (n = 3 mice, each). Scale bar = 100 μm.
- O
Schematic outline of the second CTX injury 28 days after the first injury.
- P
H&E staining was performed on TA muscles of Ctrl or YY1iKO mice 7 days after second CTX injury. Scale bar = 400 μm (left) or 100 μm (right).
- Q
Representative images of above TA muscles 7 days after second injury.
- R
Quantifications of the weight of above TA muscles from three pairs of littermate mice.
- S
IF staining for eMyHC and laminin on TA muscles 7 days after the second CTX injury of Ctrl or YY1iKO mice. Quantifications of the number of eMyHC+ fibers per area are shown on the right (n = 3 mice, each). Scale bar = 100 μm.
- T
IF staining for Pax7 and laminin on the above muscles and the quantifications of the number of Pax7+ SCs per area are shown on the right (n = 3 mice, each). Scale bar = 100 μm.
- A
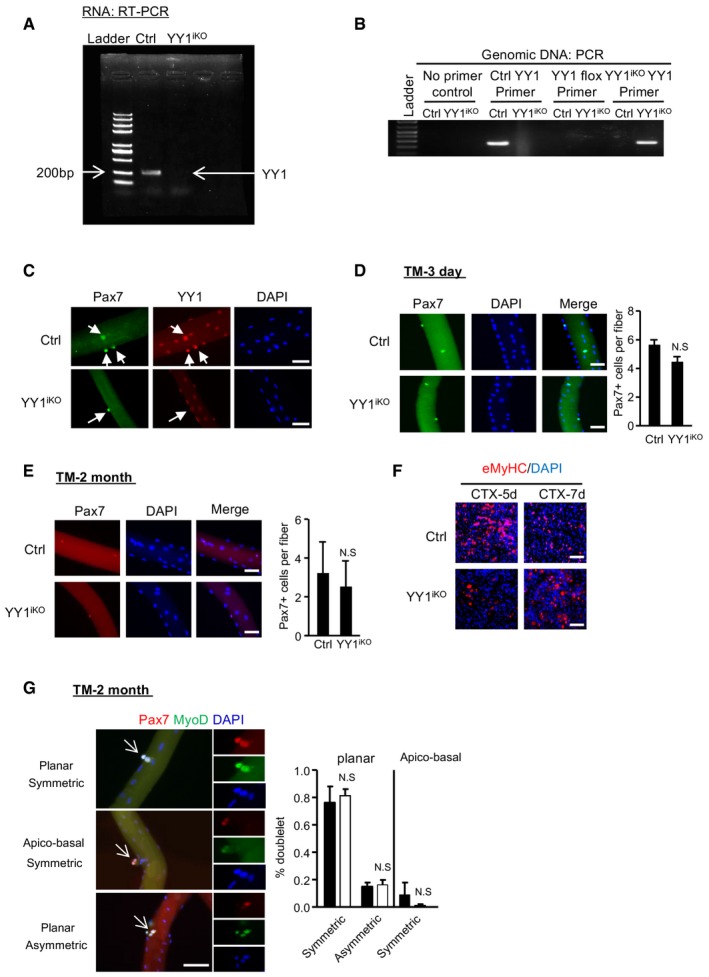
Semi‐quantitative RT–PCR detection of YY1 mRNA expression in SCs harvested 3 days after the last dose of tamoxifen (TM) injection to confirm the ablation of YY1 in YY1iKO mice.
- B
PCR validation of YY1 ablation from the genomic DNA of FACS‐sorted SCs.
- C
Single myofibers were isolated from EDL muscles from Ctrl or YY1iKO mice and cultured for 2 days before immunofluorescence (IF) staining for Pax7 and YY1; YY1 was not detected from the YY1iKO cells (arrows). Scale bar = 50 μm.
- D, E
IF staining for Pax7 on freshly isolated single myofibers from Ctrl or YY1iKO mice 3 days (D) or 2 months (E) post‐TM injection. Quantifications of Pax7+ SCs per fiber are shown on the right (n = 3, each). Scale bar = 50 μm.
- F
IF staining for eMyHC on the TA muscles 5 or 7 days post‐CTX injury. Scale bar = 100 μm.
- G
Ctrl and YY1iKO cells were cultured for 48 h and IF‐stained for Pax7 (red) and MyoD (green). White arrows indicate dividing cell doublets. Scale bar = 50 μm. Right: quantification of symmetrical or asymmetrical doublets based on the symmetry of Pax7 expression in the two dividing cells at either planar or apico‐basal orientation (n = 3, each).
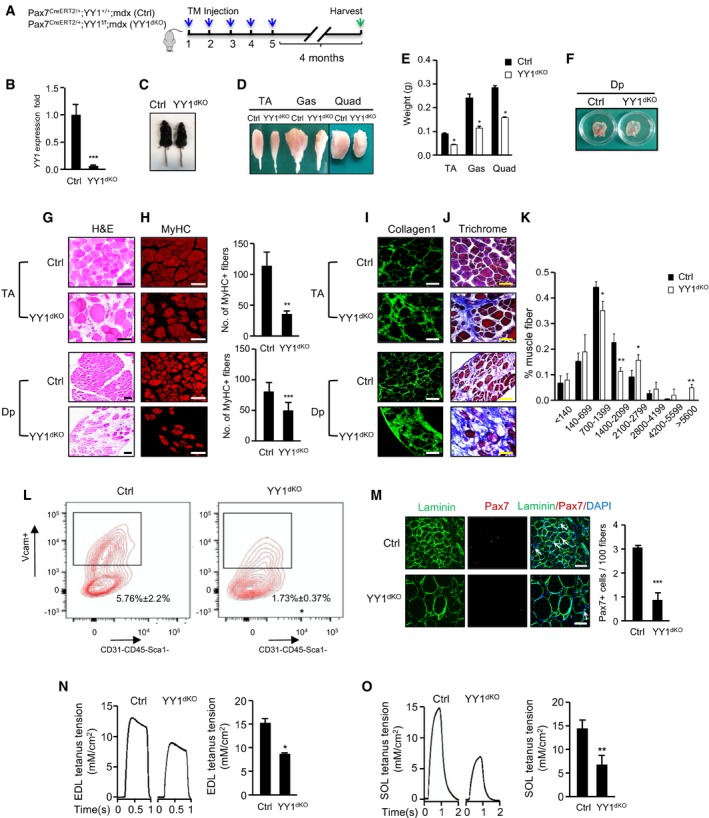
- A
Outline of the TM administration scheme to obtain Ctrl or YY1dKO mice.
- B
SCs were FACS‐sorted 4 months after the last TM injection; RT–qPCR detection of YY1 mRNA shows the ablation in YY1dKO cells.
- C
Representative images of Ctrl or YY1dKO mice 4 months after the TM administration.
- D
Representative images of limb muscles (tibialis anterior, TA; gastrocnemius, Gas; quadruple, Quad) from Ctrl or YY1dKO mice.
- E
Quantifications of muscle weight from three pairs of littermate mice.
- F
Representative images of Dp muscles isolated from Ctrl or YY1dKO mice 4 months after the TM injection.
- G, H
(G) H&E or (H) MyHC staining was performed on TA or Dp muscles from Ctrl or YY1dKO mice. Quantifications of the numbers of MyHC+ fibers per area of TA or Dp muscles are shown on the right (n = 3 mice, each). Scale bar = 100 μm.
- I, J
(I) Collagen 1 or (J) Masson's trichrome staining was performed on TA or Dp muscles from Ctrl or YY1dKO mice. Scale bar = 100 μm.
- K
The distribution of fiber size measured by CSA in TA muscles from three pairs of 6‐month‐old Ctrl and YY1dKO mice was calculated (n = 3 mice, each).
- L
Representative FACS plots showing the percentage of SCs sorted from 6‐month‐old Ctrl and YY1dKO mice (n = 3 mice, each).
- M
IF staining for Pax7 and laminin on TA muscles of Ctrl or YY1dKO mice. Quantifications of the numbers of Pax7+ SCs per 100 fibers are shown on the right (n = 3 mice, each).
- N, O
EDL or SOL muscles from Ctrl or YY1dKO mice were subjected to measurement of maximal isometric tetanic force. Left: representative trace images of normalized tetanic force. (Right): quantification of the force by normalizing with cross‐sectional area (CSA; n = 3 mice, each).
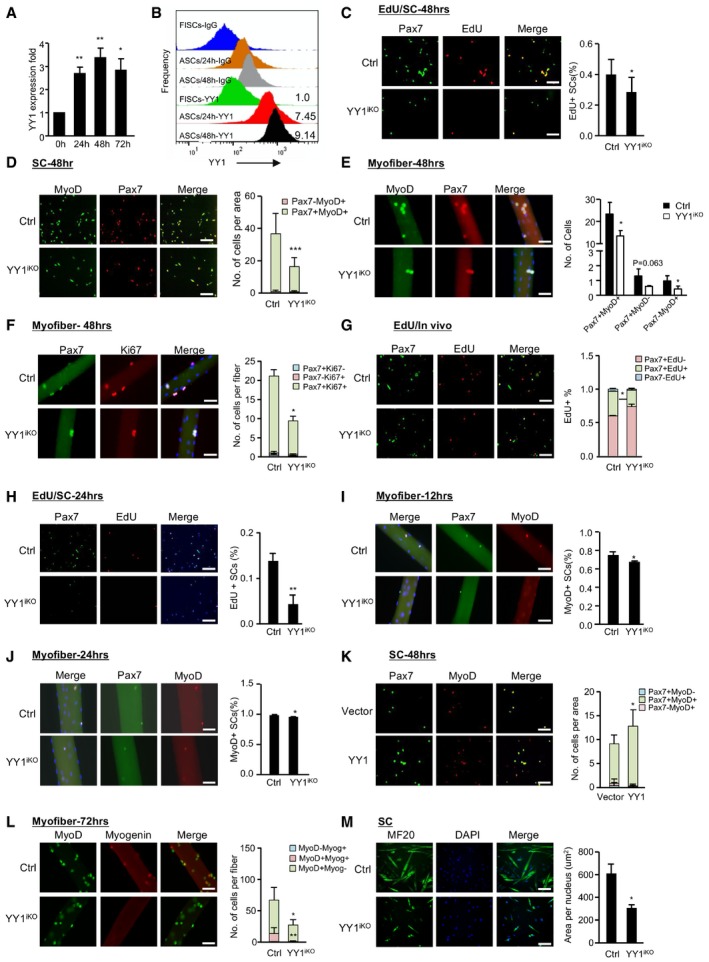
- A
FACS‐isolated SCs from Pax7‐nGFP mice were cultured for the designated time (0, 24, 48, or 72 h). YY1 expression was quantified by RT–qPCR. 18S was used as the normalization control.
- B
Flow cytometric analysis of YY1 protein or IgG control in FACS‐isolated SCs cultured for the designated time (0, 24, or 48 h). YY1 protein level is normalized to IgG levels. The numbers indicate the normalized level of YY1 protein relative to that of FISCs.
- C
An equal number of FACS‐isolated SCs from Ctrl or YY1iKO mice were cultured for 48 h and EdU‐labeled for 8 h, followed by immunostaining for Pax7 (green) and EdU (red). Quantifications of the percentage of EdU+ cells are shown on the right (n = 3 mice, each). Scale bar = 100 μm.
- D
The above cells were also IF‐stained for Pax7 (red) and MyoD (green). Quantifications of each population, Pax7+MyoD+ or Pax7−MyoD+, are shown on the right (n = 3, each). Scale bar = 100 μm.
- E
Single EDL myofibers were cultured for 48 h before staining for Pax7 (red) and MyoD (green). Quantifications of the numbers of each population, Pax7+MyoD−, Pax7−MyoD+, or Pax7+MyoD+, are shown on the right (n = 3 mice, each). Scale bar = 50 μm.
- F
Pax7 (green) and Ki67 (red) staining was performed on the above single EDL myofibers. Scale bar = 50 μm. Quantifications of the numbers of each population, Pax7+Ki67−, Pax7−Ki67+, or Pax7+Ki67+, are shown on the right (n = 3 mice, each).
- G
SCs expansion in vivo was determined by EdU labeling for 12 h 2.5 days after CTX injury. Quantifications of the numbers of EdU+ cells are shown on the right (n = 3 mice, each). Scale bar = 100 μm.
- H
An equal number of FACS‐isolated SCs from Ctrl or YY1iKO mice were cultured for 24 h and EdU‐labeled for 12 h, followed by immunostaining for Pax7 (green) and EdU (red) was performed. Quantifications of the percentage of EdU+ cells are shown on the right (n = 3 mice, each). Scale bar = 100 μm.
- I, J
Single EDL myofibers were cultured for 12 (I) or 24 (J) h in growth media before staining for Pax7 (green) and MyoD (red). Scale bar = 50 μm. Quantifications of the proportion of MyoD+ cells are shown on the right (n = 3 mice, each).
- K
FACS‐isolated SCs from YY1iKO mice were infected with YY1‐expressing or control viruses, followed by immunostaining for Pax7 (green) and MyoD (red) 36 h post‐transfection. Scale bar = 100 μm. Quantifications of the numbers of each population, Pax7+MyoD−, Pax7−MyoD+, or Pax7+MyoD+, are shown on the right (n = 3 mice, each).
- L
Single EDL myofibers were cultured for 3 days, followed by immunostaining for myogenin (red) and MyoD (green). Scale bar = 50 μm. Quantifications of the numbers of each population, MyoD+Myog+, MyoD−Myog+, or MyoD+Myog−, are shown on the right (n = 3 mice, each).
- M
FACS‐isolated SCs were cultured for 2 days in proliferation medium followed by 2 days in differentiation medium; the degree of differentiation was assessed by IF staining of MF20+. Scale bar = 100 μm. Quantifications of the numbers of MF20+ area per nucleus are shown on the right (n = 3 mice, each).
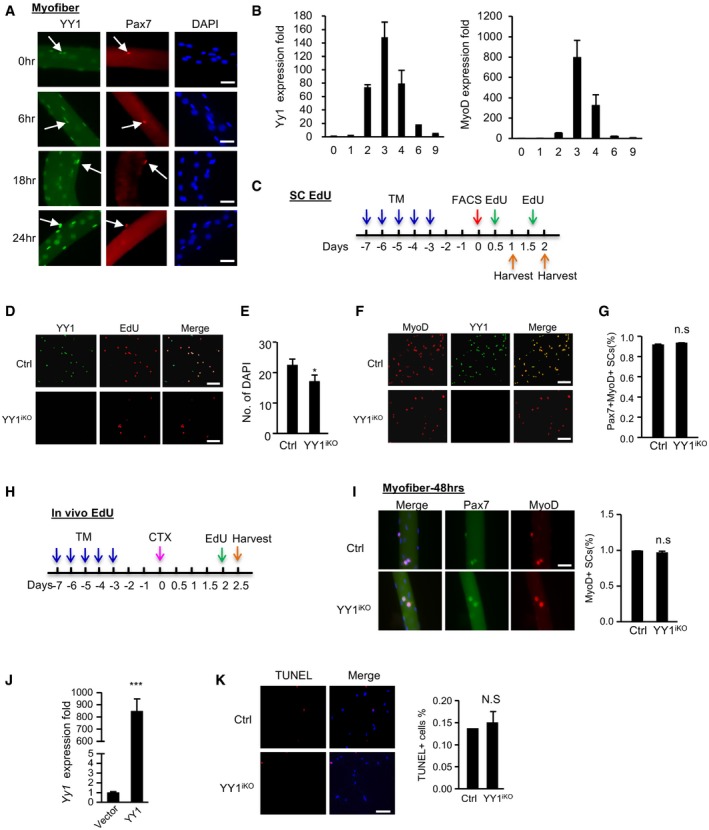
Single myofibers were isolated from EDL muscles and cultured for the designated time (0, 6, 18, or 24 h), followed by immunostaining for Pax7 (red) and YY1 (green). Scale bar = 50 μm. White arrows indicate Pax7+YY1+ cells.
qRT–PCR detection of Yy1 and MyoD mRNA expression level during CTX‐induced muscle regeneration.
Schematic illustration of the in vitro EdU labeling assays. To assess SCs activation, cells were cultured for 12 h and EdU‐labeled for 12 h. To assess the proliferation, cells were cultured for 40 h and labeled for 8 h before harvesting for EdU staining.
As shown in Fig 4C, FACS‐isolated SCs from Ctrl or YY1iKO mice were cultured for 48 h and EdU‐labeled for 8 h, followed by immunostaining for YY1 (green) and EdU (red) to show. Scale bar = 100 μm.
Quantification of the number of DAPI+ cells for Fig 4C is shown (n = 3 mice, each).
FISCs were cultured for 1.5 days and IF‐stained MyoD with YY1. Scale bar = 100 μm.
Quantification of the percentage of Pax7+MyoD+ cells in Fig 4E is shown (n = 3 mice, each).
Schematic illustration of the in vivo EdU labeling assay. Two days after CTX injection, EdU injection via i.p was performed followed by FACS isolation of SCs 12 h later.
Single EDL myofibers were cultured for 48 h in growth media before staining for Pax7 (green) and MyoD (red). Scale bar = 50 μm. The percentage of MyoD+ cells was shown (n = 3 mice, each).
SCs isolated from YY1iKO mice were transfected with a lentiviral YY1‐expressing or empty viruses. The overexpression of YY1 mRNA was detected by RT–qPCR (n = 3, each).
SCs were sorted and cultured for 36 h, followed by TUNEL assay. Quantifications of TUNEL+ cells% are shown on the right (n = 3, each). Scale bar = 100 μm.
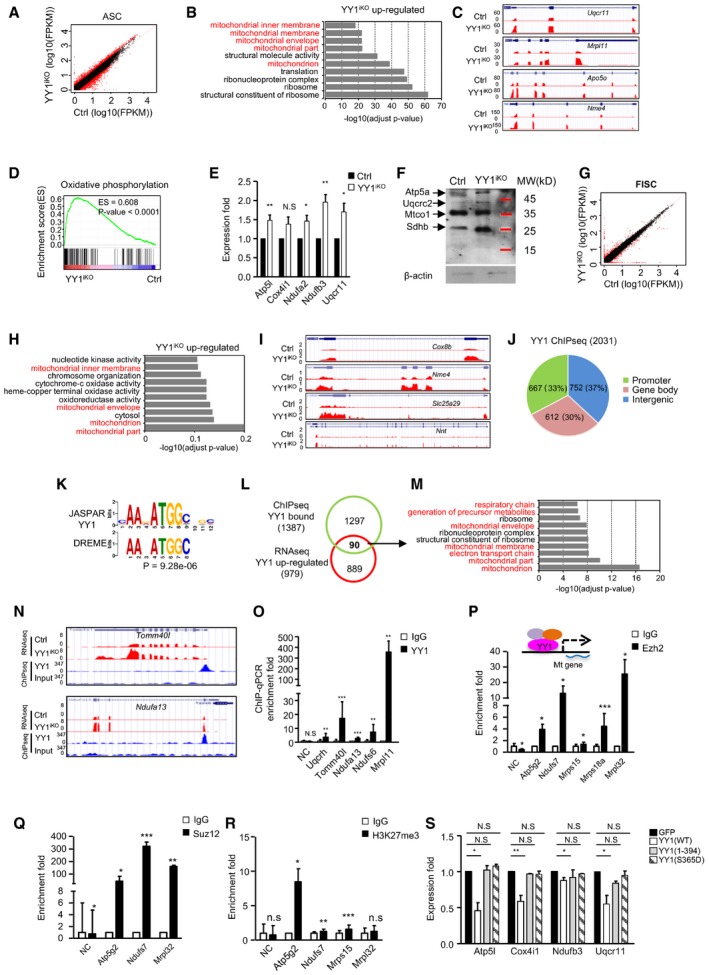
- A
RNAseq was performed with RNAs extracted from ASCs (FACS purified and cultured for 36 h) of YY1iKO or Ctrl mice; scatter plot shows differentially expressed genes with a fold change ≥ 2 (red dots) in YY1iKO vs. Ctrl.
- B
Gene ontology (GO) analyses of the above up‐regulated genes. The top 10 enriched GO terms are displayed on the Y axis and adjusted P values on the X axis.
- C
Genomic snapshots showing the examples of mitochondrial genes (Uqcr11, Mrpl11, Apo5o, and Nme4) up‐regulated in YY1iKO vs. Ctrl cells.
- D
GSEA analysis shows oxidative phosphorylation gene set is enriched in YY1iKO vs. Ctrl cells (P‐value < 0.0001).
- E
RT–qPCR validation of the expression of the selected up‐regulated mitochondrial genes in YY1iKO vs. Ctrl.
- F
Protein levels of the respiratory chain complexes I–V components in YY1iKO vs. Ctrl ASCs were detected using a mitoprofile antibody cocktail. β‐actin was used as the loading control.
- G
RNAseq was performed using RNAs from freshly isolated SCs (FISCs); scatter plot shows differentially expressed genes with a fold change ≥ 2 (red dots) in YY1iKO vs. Ctrl.
- H
GO analysis for the up‐regulated genes in YY1iKO vs. Ctrl.
- I
Genomic snapshots show the selected mitochondrial genes (Cox8b, Nme4, Slc25a29, Nnt) up‐regulated in YY1iKO vs. Ctrl FISCs.
- J
ChIPseq was performed using chromatins from WT ASCs, and the genomic distribution of 2,031 YY1 binding peaks is shown.
- K
De novo motif prediction by DREME revealed the enrichment of canonical YY1 motifs in the above binding regions.
- L
Venn diagrams show the overlapping (90 genes) between the above identified binding target genes (1,387) and the up‐regulated genes from ASC RNAseq (979).
- M
GO analysis of the above 90 genes revealed an extreme enrichment of mitochondrial‐related terms.
- N
Genomic snapshots of two of the above identified mitochondrial genes (Tomm40I and Ndufa13) that are bound by YY1 in their TSSs (ChIPseq tracks) and up‐regulated by YY1 deletion (RNAseq tracks).
- O
ChIP–qPCR validation of YY1 binding on some mitochondrial genes. Negative control (NC) represents a genomic region on Chromosome 11 with no YY1 binding peak identified. Enrichment fold was calculated as the amount of amplified DNA from YY1 binding sites normalized to values obtained from IgG control.
- P–R
ChIP–qPCR was performed to show the enrichment of Ezh2 (P), Suz12 (Q), and H3K27 me3 (R) binding on selected mitochondrial genes.
- S
A construct to express wild‐type YY1(WT) or two mutants lacking DNA‐binding activity, YY1(1–394) and YY1(S365D), were transfected into YY1iKO cells; the expression of mitochondrial gene was measured.
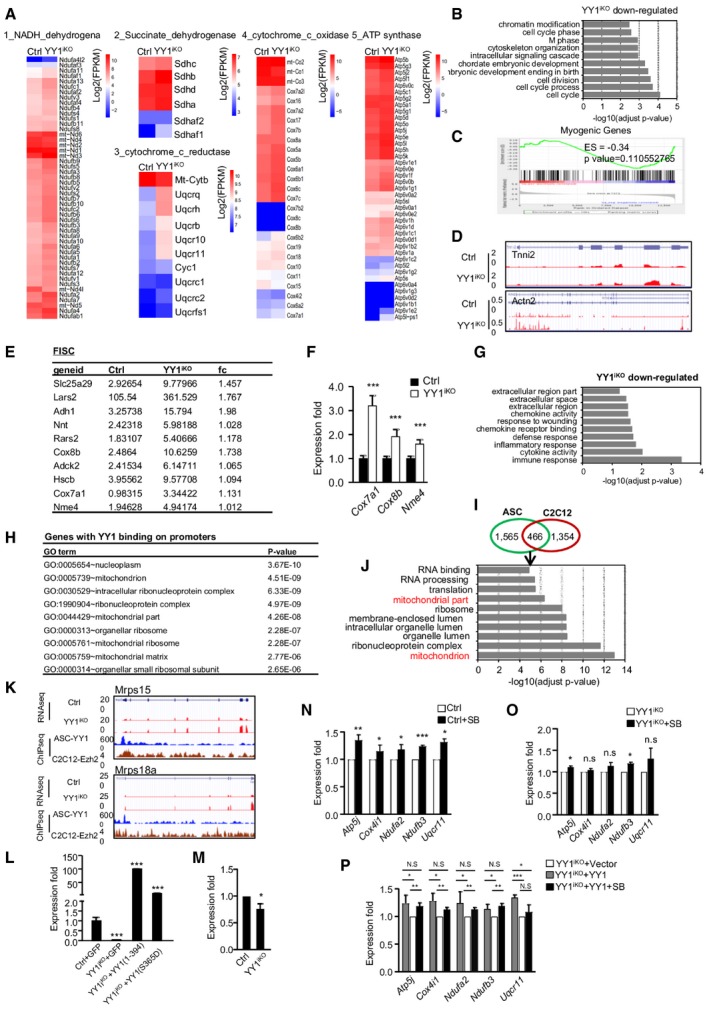
- A
Heat maps indicating gene expression (Log2[FPKM]) of complex I–V in Ctrl vs. YY1iKO ASCs.
- B
Gene ontology (GO) analysis of the down‐regulated genes in YY1iKO vs. Ctrl ASCs. The top 10 enriched GO terms are displayed on the Y axis and adjusted P values on the X axis.
- C
GSEA analysis shows myogenic genes were not enriched in YY1iKO vs. Ctrl ASCs (P‐value = 0.11).
- D
Genomic snapshots showing the selected myogenic genes, Tnni2 and Actn2, in YY1iKO vs. Ctrl ASCs.
- E
List of up‐regulated mitochondrial genes in YY1iKO FISCs measured by RNAseq (in FPKM).
- F
RT–qPCR validation of the expression of selected mitochondrial genes up‐regulated in YY1iKO FISCs (n = 3 mice, each).
- G
GO analysis for the down‐regulated genes in YY1iKO vs. Ctrl FISCs.
- H
GO analysis of all genes with YY1 binding in their promoters. The top 10 enriched GO terms are displayed with relevant adjusted P values.
- I
Venn diagrams showing the overlapping of the YY1 ChIPseq from ASCs and C2C12 myoblasts. A total of 466 peaks were found in both datasets.
- J
GO analysis of genes associated with the above 466 peaks. The top 10 enriched GO terms are displayed on Y axis and adjusted P values on the X axis.
- K
Ezh2 ChIPseq data from C2C12 myoblasts and YY1 ChIPseq data from ASCs were compared. Genomic snapshots showing the co‐binding of YY1 and Ezh2 on selected mitochondrial genes, Mrps15 and Mrps18a.
- L
Ctrl or YY1iKO ASCs were infected with a pRlenti‐GFP control, pRlenti‐YY1(1–394), or pRlenti‐YY1(S365D) virus to overexpress the mutants of YY1. RT–qPCR detection showing the overexpressed YY1 mutant mRNAs (n = 3, each).
- M
RT–qPCR analysis of Pax7 expression in YY1iKO vs. Ctrl ASCs (n = 3 mice, each).
- N, O
ASCs from Ctrl or YY1iKO were treated with SB202190 (SB) and analyzed for the expression of selected mitochondrial genes (n = 3 mice, each).
- P
YY1iKO ASCs were transfected with YY1 and treated with SB to further examine YY1‐dependent p38 repression on mitochondrial gene expression (n = 3 mice, each).
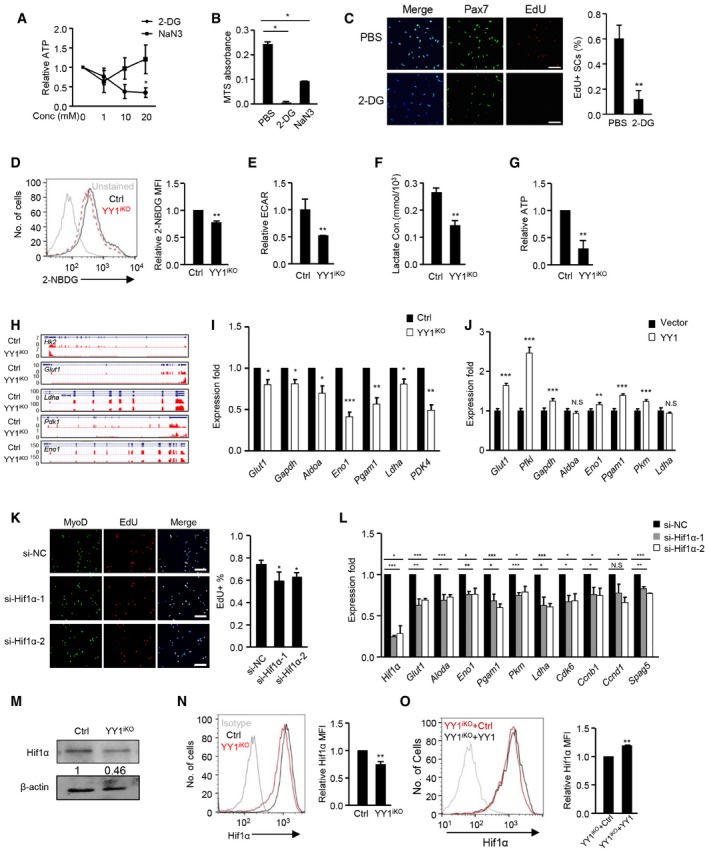
- A
An equal number of FACS‐isolated SCs from C57 mice were cultured for 24 h and treated with 0, 1, 10, or 20 mM 2‐DG (glycolytic inhibitor) or NaN3 (respiration inhibitor) for 3 h before measurement of ATP production. The relative ATP levels normalized to the 0 mM values are plotted. N = 3 mice.
- B
SCs from C57 mice were treated with 10 mM 2‐DG or 10 mM NaN3 for 36 h before measurement of proliferation rate by MTS assay (n = 3 mice, each).
- C
SCs from C57 mice were treated with 10 mM 2‐DG for 24 h and subject to EdU labeling for 6 h. The percentage of Pax7+/EdU+ cells over the total number of Pax7+ cells was quantified (n = 3 mice, each).
- D
Ctrl and YY1iKO ASCs were stained with 60 μg/ml 2‐NBDG for 45 min, and the fluorescence intensity (MFI) of 2‐NBDG was measured by flow cytometry (n = 3 mice, each).
- E–G
An equal number of Ctrl and YY1iKO cells were cultured for 36 h; basal extracellular acidification rate (ECAR) level (E), lactate concentration (F), and ATP production (G) were measured and normalized with cell numbers. N = 3 mice.
- H
Genomic snapshots depict RNAseq profiles of the selected glycolytic genes (Hk2, Glut1, Ldha, Pdk1, and Eno1) down‐regulated in YY1iKO vs. Ctrl ASCs.
- I
Expression of the selected glycolytic genes was quantified by RT–qPCR. Hsp90ab1 was used as the normalization control.
- J
Re‐expression of YY1 by transfecting YY1iKO ASCs with a YY1 WT expressing plasmid led to up‐regulation of glycolytic genes including Glut1, Pfkl, Gapdh, Eno1, Pgam1, and Pkm. Hsp90ab1 was used as the normalization control.
- K
FACS‐isolated SCs from Pax7‐nGFP mice were transfected with Hif1α or control siRNAs and EdU‐labeled for 5 h. The percentage of MyoD+EdU+ cells over the total number of MyoD+ cells was quantified. Scale bar = 100 μm. N = 3 mice.
- L
The expression of glycolytic genes and cell cycle‐related genes was detected by RT–qPCR in the above transfected cells. β‐actin was used as the normalization control.
- M
Hif1α protein level was detected by Western blotting in YY1iKO vs. Ctrl ASCs. β‐actin was used as the loading control.
- N
Left: image of flow cytometric analysis of Hif1α protein or IgG control in YY1iKO vs. Ctrl ASCs. Right: relative mean fluorescence intensity (MFI) of Hif1α protein is shown. N = 3 mice.
- O
YY1iKO ASCs were transfected with empty YY1 WT viruses; the relative expression level of Hif1α protein was detected by the above described flow cytometric analysis N = 3 mice.
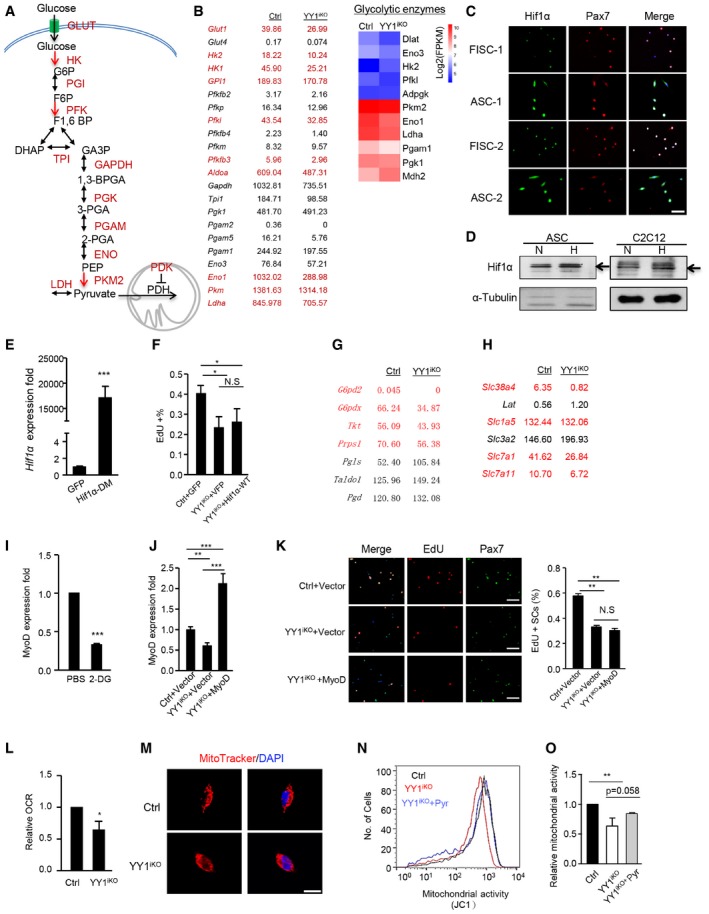
- A
Illustration of the key enzymes on glycolytic pathway.
- B
Left: expression of the enzymes or glucose transporters in Ctrl and YY1iKO ASCs measured by RNAseq (in FPKM). Highlighted are known Hif1α target genes. Right: heat maps indicating gene expression (Log2[FPKM]) of glycolytic enzymes in Ctrl and YY1iKO ASCs.
- C
IF staining for Pax7 (red) and Hif1α (green) on freshly isolated SCs or ASCs cultured for 48 h. An evident up‐regulation of Hif1α protein can be observed. Scale bar = 50 μm.
- D
Western blot of Hif1α in ASCs or C2C12 myoblasts cultured under normoxic (N; 21% O2) or hypoxic (H; 1% O2) conditions. α‐Tubulin was used as a loading control. Black arrows indicate the location of Hif1α protein.
- E
YY1iKO ASCs were infected with pRlenti‐Hif1α (P402A/P564A; Hif1α‐DM) or a control pRlenti‐GFP virus to overexpress a constitutively active form of Hif1α. RT–qPCR detection of the overexpressed Hif1α DM mRNAs (n = 3, each).
- F
FACS‐sorted cells were infected with Ctrl or wt Hif1α and subjected to EdU labeling for 5.5 h. The percentage of MyoD+/EdU+ cells over the total number of MyoD+ cells was quantified (n = 3 mice, each).
- G, H
Expression levels of pentose cycle enzymes (G) and amino‐acid transporters (H) in Ctrl and YY1iKO ASCs measured by RNAseq (in FPKM). Highlighted are genes down‐regulated in YY1iKO ASCs.
- I
SCs from C57 mice were treated with 10 mM 2‐DG for 24 h. RT–qPCR detection of MyoD mRNAs was shown (n = 3 mice, each).
- J
SCs isolated from Ctrl and YY1iKO mice were transfected with a MyoD expressing or empty vector. RT–qPCR detection of the overexpressed MyoD mRNAs was shown (n = 3, each).
- K
The above transfected SCs were labeled with EdU for 6 h. The percentage of Pax7+EdU+ cells over the total number of Pax7+ cells was quantified. Scale bar = 100 μm. N = 3 mice.
- L
An equal number of Ctrl and YY1iKO cells were cultured for 36 h, and basal oxygen consumption rate (OCR) was measured and normalized with cell numbers (n = 3, each).
- M
MitoTracker staining of cultured SCs (48 h) isolated from Ctrl or YY1iKO mice to visualize the mitochondrial structures. Scale bar = 20 μm.
- N
Ctrl, YY1iKO, or YY1iKO ASCs treated with 100 μM sodium pyruvate were stained with 2 μM 5,5′,6,6′‐tetrachloro‐1,1′,3,3′‐tetraethyl‐benzimidazolylcarbocyanine chloride (JC‐1) for 15 min to measure the mitochondrial membrane potential in living cells. The representative image of flow cytometry analyses is shown.
- O
Quantifications of the membrane potential levels are shown (n = 3, each).
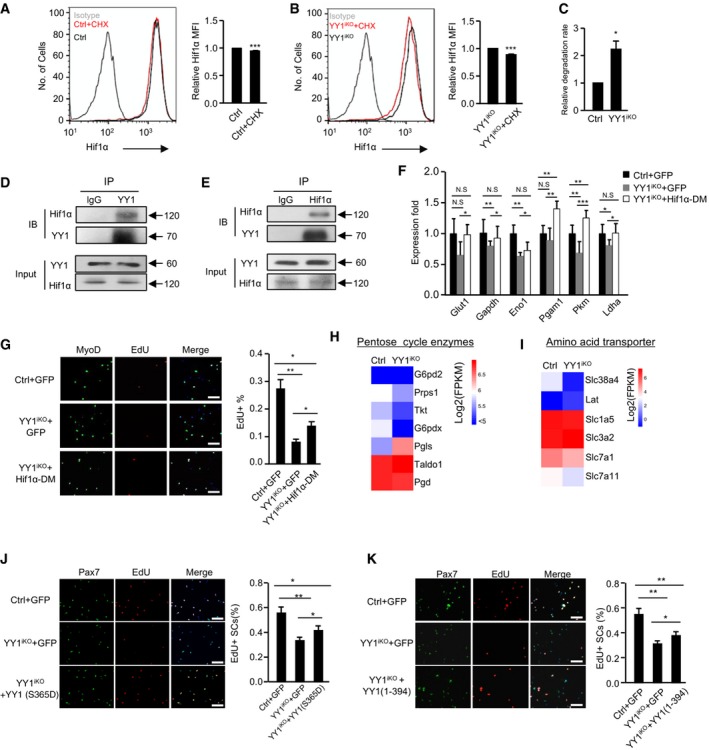
- A, B
Ctrl or YY1iKO ASCs were treated with CHX (cycloheximide) for 90 min, and Hif1α protein was measured by flow cytometry. The numbers indicate the degradation rate after CHX treatment. N = 3 mice.
- C
The relative degradation rate was calculated by the ratio of degradation rate in YY1iKO (11.14% ± 1.71%) vs. Ctrl (5.08% ± 0.796%). N = 3 mice.
- D
Lysates from C2C12 myoblasts (GM) were subject to co‐immunoprecipitation (Co‐IP) assays with anti‐YY1 or anti‐IgG antibodies and blotted with anti‐Hif1α or anti‐YY1 antibodies.
- E
The above lysates were also immunoprecipitated with anti‐Hif1α or anti‐IgG antibodies and blotted with anti‐YY1 or anti‐Hif1α antibodies.
- F
ASCs from YY1iKO mice were infected with pRlenti‐Hif1α (P402A/P564A; Hif1α‐DM) viruses to overexpress a non‐degradable Hif1α protein or GFP‐expressing viruses. ASCs from Ctrl mice were also infected with the GFP viruses. Thirty‐six hours after infection, the expression of target glycolytic genes was detected by RT–qPCR. Hsp90ab1 was used as the normalization control.
- G
SCs were isolated from Ctrl or YY1iKO mice and infected with the above viruses. EdU labeling was then performed for 5.5 h. The percentage of MyoD+EdU+ cells over the total number of MyoD+ cells was quantified. Scale bar = 100 μm. N = 3 mice.
- H, I
Heat maps indicating gene expression levels (Log2[FPKM]) of pentose cycle enzymes (H) and amino acid transporter (I) in YY1iKO vs. Ctrl.
- J, K
YY1 (S365D) (J) or YY1 (1‐394) (K) mutant was expressed in YY1iKO ASCs and cells were then EdU‐labeled for 6 h. A GFP‐expressing plasmid was used as the negative control. The percentage of Pax7+/EdU+ cells over the total number of Pax7+ cells was quantified.
References
Publication types
MeSH terms
Substances
LinkOut - more resources
Full Text Sources
Molecular Biology Databases
Miscellaneous
