A non-death function of the mitochondrial apoptosis apparatus in immunity
- PMID: 30979778
- PMCID: PMC6545560
- DOI: 10.15252/embj.2018100907
A non-death function of the mitochondrial apoptosis apparatus in immunity
Abstract
Apoptosis is a frequent form of programmed cell death, but the apoptotic signaling pathway can also be engaged at a low level, in the absence of cell death. We here report that such sub-lethal engagement of mitochondrial apoptosis signaling causes the secretion of cytokines from human epithelial cells in a process controlled by the Bcl-2 family of proteins. We further show that sub-lethal signaling of the mitochondrial apoptosis pathway is initiated by infections with all tested viral, bacterial, and protozoan pathogens and causes damage to the genomic DNA. Epithelial cells infected with these pathogens secreted cytokines, and this cytokine secretion upon microbial infection was substantially reduced if mitochondrial sub-lethal apoptosis signaling was blocked. In the absence of mitochondrial pro-apoptotic signaling, the ability of epithelial cells to restrict intracellular bacterial growth was impaired. Triggering of the mitochondrial apoptosis apparatus thus not only causes apoptosis but also has an independent role in immune defense.
Keywords: apoptosis; cell‐autonomous immunity; immune recognition; infection; minority MOMP.
© 2019 The Authors.
Conflict of interest statement
The authors declare that they have no conflict of interest.
Figures

- A, B
Various HeLa cell lines were treated with the small‐molecule Bcl‐2/Bcl‐XL inhibitor ABT‐737 or DMSO for 48 h (A and B left panel) or 72 h (B, right panel). IL‐6 concentrations in supernatants were measured by ELISA. CTRL, a control cell line carrying the Cas9 vector with a non‐targeting control gRNA; Bax/Bak, cells where both Bax and Bak had been deleted by CRISPR/Cas9; STING, cells with a deletion of STING. (A) Concentrations of IL‐6 were determined by ELISA (CTRL, n = 7; Bax/Bak, n = 4; STING, n = 6). (B) Cells expressing active caspase‐3 as a measure of apoptosis were detected using staining with an antibody specific for the cleaved form of caspase‐3, followed by flow cytometry. Data are means/SEM of at least three independent experiments [CTRL (48 h), n = 4; CTRL (72 h), n = 5; Bax/Bak, n = 5].
- C
WM1158 human melanoma cells were treated with ABT‐737 or solvent for 72 h. IL‐6 concentrations in supernatants were measured by ELISA. Data are means/SEM (DMSO, n = 4; ABT‐737, n = 3 independent experiments).
- D
Flow cytometry measurement of CTRL cells stained with Live/Dead Fixable Far Red Dead Kit and an antibody specific for the cleaved form of caspase‐3. Cells were analyzed by flow cytometry. Results are expressed as percent live (negative for both stains), active caspase‐3 single positive or dead (cells with loss of plasma membrane integrity, both caspase‐3‐positive and caspase‐3‐negative). Data are means/SEM of at least three independent experiments (n = 3).
- E
HeLa cells were killed by three cycles of freeze‐thawing (3 × 10⁶ cells in 1 ml PBS, liquid nitrogen/room temperature). Equivalents of 10 or 20% of cells were added to cultures of HeLa CTRL cells (n = 3). Concentrations of IL‐6 were determined by ELISA 48 h later.
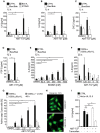
- A–E
HeLa cell lines were treated with the small‐molecule Bcl‐2/Bcl‐XL inhibitor ABT‐737 (A–D) or the Mcl‐1 inhibitor S63845 (E) for 72 h. Cytokines were measured by ELISA. CTRL, non‐targeting control gRNA; Bax/Bak, both Bax and Bak had been deleted by CRISPR/Cas9; Bcl‐XL, over‐expressing Bcl‐XL; STING, deletion of STING. (A) Concentrations of IL‐6 were determined (CTRL, n = 9; Bax/Bak, n = 6; Bcl‐XL, n = 3; STING, n = 3). (B) Concentrations of IL‐8 were determined (CTRL, n = 7; Bax/Bak, n = 4). (C) Concentrations of CXCL1 were determined (CTRL, n = 8; Bax/Bak, n = 5). (D) Concentrations of FGF‐2 were determined (CTRL, n = 7; Bax/Bak, n = 4). (E) HeLa CTRL cells and Bax/Bak‐deficient cells were treated with the Mcl‐1 inhibitor S63845. Concentrations of IL‐6 in supernatants are shown (CTRL, n = 8; Bax/Bak, n = 7).
- F
1205Lu human melanoma cells or 1205Lu melanoma cells over‐expressing Bcl‐XL were treated with ABT‐737. Concentrations of IL‐6 in the supernatants were measured after 48 h (n = 5).
- G
1205Lu human melanoma cells or 1205Lu melanoma cells over‐expressing mouse Bcl‐XL were treated with various concentrations of ABT‐737. To some aliquots, the caspase inhibitor zVAD‐fmk (50 μM) was added. Relative numbers of apoptotic cells were determined as in Fig EV1B after 48 h. Data are means/SEM of at least three independent experiments (1205Lu, n = 4; 1205Lu 5 μM ABT‐737, n = 3; 1205Lu/Bcl‐XL and 1205Lu + zVAD, n = 3).
- H
HeLa‐UL12.5 cells untreated or treated with tamoxifen (100 nM, 24 h) were stained with PicoGreen (3 μl/ml) to detect mitochondrial DNA. Scale bare, 10 μm.
- I
HeLa CTRL cells and HeLa‐UL12.5 cells were treated with ABT‐737 (10 μM). Concentration of IL‐6 in the supernatant was measured after 72 h (n = 3).

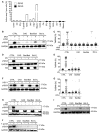
HeLa CTRL cells or HeLa cells deficient in CAD, in Bax/Bak or in over‐expressing Bcl‐XL were treated with staurosporine (250 nM, 5 h). To one sample, the caspase inhibitor zVAD‐fmk was added (50 μM). Cells were lysed and analyzed for γH2AX expression by Western blot.
HeLa CTRL cells were treated with increasing concentrations of staurosporine for 5 h. γH2AX expression was assessed by Western blotting. The Western blot is representative of three independent experiments.
HeLa cells expressing a caspase‐3 reporter construct to record cleavage of the caspase‐3 recognition sequence (DEVD) or a non‐cleavable control construct (DEVG) were treated with increasing concentrations of staurosporine for 5 h. Active caspase‐3 was measured as cells with FRET loss. Data are means/SEM from three separate experiments. *P < 0.05 compared to untreated (paired two‐tailed t‐test) (n = 3).
- A
The caspase‐3 reporter cell line (labeled DEVD) and the control cell line (DEVG; see Materials and Methods) were infected and analyzed at various time points post‐infection by flow cytometry (Chlamydia trachomatis (Ctr; MOI = 1, 30 h); Salmonella Typhimurium (STy; MOI = 50, 24 h); Toxoplasma gondii (MOI = 5, 16 h); MVA (MOI = 10, 16 h); influenza A virus (IAV; MOI = 1, 16 h); herpes simplex virus 1 (HSV‐1; MOI = 1, 16 h)). Staurosporine‐treated cells (1 μM, 3 h) were used as a positive control. Percentages of cells positive for caspase‐3 activation (FRET loss) were determined. Data are means/SEM of three independent experiments (n = 3).
- B, C
Cells were infected with modified vaccinia virus Ankara (MVA) (MOI = 10). The caspase inhibitor zVAD‐fmk was used at 100 μM; cells were analyzed 16 h post‐infection.
- D, E
Cells were infected with influenza A virus (IAV) (MOI = 1; analysis was 16 h post‐infection). D, detection of viral M2 protein was used as infection control.
- F, G
Cells were infected with herpes simplex virus 1 (HSV‐1) (MOI = 1; analysis was 16 h post‐infection).
- H
Cells were infected with Chlamydia trachomatis (Ctr) (MOI = 1; analysis was 30 h post‐infection).
- I
Cells were infected with Salmonella Typhimurium (Sty) (MOI = 50; analysis was 24 h post‐infection).
- J
Cells were infected with the protozoan parasite Toxoplasma gondii (MOI = 5; analysis was 16 h post‐infection).

- A, B
Modified vaccinia virus Ankara (MVA) at an MOI of 10, 16 h.
- C
Influenza A virus (IAV), MOI = 1, 16 h.
- D
Herpes simplex virus 1 (HSV‐1), MOI = 1, 16 h; infection was done in duplicate.
- E
Chlamydia trachomatis (Ctr) MOI = 2, 30 h.
- F
Salmonella Typhimurium (STy), MOI = 100 or 200, 16 h.
- G
HCT116 wt or Bax/Bak‐deficient cells infected with Salmonella Typhimurium (STy), MOI = 50, 24 h.
- H
Modified vaccinia virus Ankara (MVA), MOI = 10, 16 h.
- I
Salmonella Typhimurium (STy), MOI = 50, 24 h.

- A, B
MVA‐GFP (MOI = 10, 16 h, GFP); (B) n = 3.
- C
Influenza A virus (IAV) (MOI = 1, 16 h, IAV M2 protein).
- D
Herpes simplex virus 1 (HSV‐1) (MOI = 1, 16 h, viral protein gD).
- E, F
C. trachomatis (Ctr) (MOI = 1, 30 h, bacterial Hsp60); (F) n = 3.
- G
Salmonella Typhimurium (STy) (MOI = 50, 24 h, bacterial LPS).
- H
Toxoplasma gondii (MOI = 5, 16 h, parasite protein GRA7).
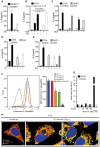
IL‐6 concentrations in the supernatants of MEFs heterozygous for both Bax and Bak or homozygous for deficiency for Bax and Bak infected with Salmonella Typhimurium (MOI = 50; 24 h).
IL‐6 concentrations in the supernatants of HeLa CTRL or HeLa‐UL12.5 cells treated with tamoxifen for 24 h. Tamoxifen was washed out, and cells were infected with MVA (MOI = 1; 16 h) or Salmonella Typhimurium (MOI = 50).
IL‐6 concentrations in the supernatants of HeLa CTRL, STING‐deficient, APAF‐1‐deficient, CAD‐deficient HeLa cells infected with MVA (MOI = 1; 16 h).
IL‐6‐concentrations in the supernatants of HeLa CTRL, STING‐deficient, or CAD‐deficient HeLa cells infected with Chlamydia trachomatis (MOI = 1; 30 h).
IL‐6 concentrations in the supernatants of HeLa CTRL, STING‐deficient, APAF‐1‐deficient, or CAD‐deficient HeLa cells infected with Salmonella Typhimurium (MOI = 50; 24 h).
HeLa CTRL cells were infected with Chlamydia trachomatis (MOI = 1) for the indicated times. As a positive control of cytochrome c release, cells were treated for 3 h with ABT‐737 and the Mcl‐1 inhibitor S63845 in the presence of the qVDOPh. Cells were harvested and permeabilized, and mitochondrial cytochrome c was determined by immunostaining and flow cytometry. Left, exemplary plot; right, mean fluorescence intensity (mean/SEM, n = 3).
Caspase‐3 reporter cells (DEVD and DEVG cells as in Fig 1) were infected with Chlamydia trachomatis in parallel to the infections shown in (F).
HeLa CTRL cells were infected with Chlamydia trachomatis for 22 h. Cells were fixed (4% PFA) and immunostained for Tom20 (green) and cytochrome c (red). Arrows indicate mitochondria without detectable cytochrome c. Asterisks indicate chlamydial inclusions. Scale bar, 5 μm.
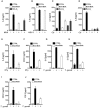
- A
Infection with MVA (MOI = 10 for 16 h; IL‐6).
- B
infection with HSV‐1 (MOI = 1 for 16 h; IL‐6).
- C, D
Infection with Chlamydia trachomatis (Ctr; MOI = 1 for 30 h; IL‐6, IL‐8).
- E, F
Infection with Salmonella Typhimurium (STy; MOI = 50 for 24 h; IL‐6, CXCL‐1).
- G–J
Infection with Toxoplasma gondii (MOI = 5 for 16 h; IL‐6, IL‐8, CXCL‐1, FGF‐2).
- A, B
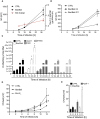
(A) HeLa cell lines or (B) AGS cell lines with an intact (CTRL, carrying a non‐coding gRNA) or inactive (Bax/Bak‐double‐deficient) mitochondrial apoptosis apparatus were infected with Chlamydia trachomatis expressing GFP (MOI = 0.2). Cells were analyzed by flow cytometry at the indicated time points. Cells were gated on the GFP‐positive (infected) host cell population, and mean fluorescence intensity was recorded. Data are means/SEM of six (A) or 4–5 (B) experiments. (A) Growth of C. trachomatis was measured in HeLa cells as increase in GFP fluorescence between 18 and 38 h. The data show means/SEM of six independent experiments (genotype effect (significance of the difference in GFP expression between the cell lines overall, P = 0.08)). Red line indicates the fold change calculation of the individual different time points and cell lines (significance tested (one sample t‐test) for each time point for a difference between Bax/Bak versus CTRL). (B) Growth of C. trachomatis was measured in AGS cells as increase in GFP fluorescence. The data show means/SEM of 4–5 independent experiments (genotype effect: P < 0.0001; time–genotype interaction: P < 0.0001) (12 and 38 h, n = 4; 18 h, n = 5).
- C
Chlamydial genomes per cell culture (expressed as chlamydial DNA in 50 ng of total DNA, determined by quantitative PCR). *P < 0.05 between control and mutant cells (n = 3).
- D
CTRL, Bax/Bak‐deficient or Bcl‐XL‐over‐expressing HeLa cells were infected with Salmonella Typhimurium (MOI = 50). Extracellular bacteria were killed using non‐cell‐permeable antibiotic. At the indicated time points, cells were lysed, and aliquots were plated on agar plates. Recovered colony‐forming units were calculated. Data are means/SEM of four independent experiments. Significant genotype effects were found between mutant and control cells (Bax/Bak P < 0.0001; Bcl‐XL P 0.0001).
- E
CTRL, Bax/Bak‐deficient or Apaf‐1‐deficient HeLa cells were infected with Salmonella Typhimurium (MOI = 50). CFU/well was calculated as in (D). n = 3.
Comment in
-
Mitochondria and pathogen immunity: from killer to firestarter.EMBO J. 2019 Jun 3;38(11):e102325. doi: 10.15252/embj.2019102325. Epub 2019 May 17. EMBO J. 2019. PMID: 31101675 Free PMC article.
References
-
- Brown H, Prescott R (1999) Applied mixed models in medicine. New York, NY: John Wiley and Sons;
-
- Chumduri C, Gurumurthy RK, Zadora PK, Mi Y, Meyer TF (2013) Chlamydia infection promotes host DNA damage and proliferation but impairs the DNA damage response. Cell Host Microbe 13: 746–758 - PubMed
Publication types
MeSH terms
Substances
LinkOut - more resources
Full Text Sources

