. 2019 Jun 19;39(25):4931-4944.
doi: 10.1523/JNEUROSCI.2275-18.2019. Epub 2019 Apr 12.

Inhibitory Units: An Organizing Nidus for Feature-Selective SubNetworks in Area V1

Affiliations

Inhibitory Units: An Organizing Nidus for Feature-Selective SubNetworks in Area V1

Ganna Palagina et al. J Neurosci. .

Abstract

Neuronal circuits often display small-world network architecture characterized by neuronal cliques of dense local connectivity communicating with each other through a limited number of cells that participate in multiple cliques. The principles by which such cliques organize to encode information remain poorly understood. Similarly tuned pyramidal cells that preferentially target each other may form multicellular encoding units performing distinct computational tasks. The existence of such units can reflect upon both spontaneous and stimulus-driven population events.We applied two-photon calcium imaging to study spontaneous population bursts in layer 2/3 of area V1 in male C57BL/6 mice. To identify potential small-world cliques, we searched for pyramidal cells whose calcium events had a consistent temporal relationship with the events of local inhibitory interneurons. This was guided by the intuition that groups of neurons whose synchronous firing represents a temporally coherent computational unit should be inhibited together. Pyramidal members of these interneuron-centered clusters on average displayed stronger functional connectivity between each other than with nonmember pyramidal neurons. The structure of the clusters evolved during postnatal development: cluster size and overlap between clusters decreased with developmental maturation. Pyramidal neurons in a cluster showed higher than chance tuning function similarity between each other and with the linked interneuron. Thus, spontaneous population events in V1 are shaped by small-world subnetworks of pyramidal neurons that share functional properties and work as a coherent unit with a local interneuron. These interneuron-pyramidal cell partnerships may represent a fundamental neocortical unit of computation at the population level.SIGNIFICANCE STATEMENT Neuronal circuit in layer 2/3 of mouse area V1 possesses small-world network architecture, where cliques of densely interconnected neurons ("small worlds") communicate via restricted number of hub cells. We show that: (1) in mouse V1 individual small-world cliques preferably incorporate pyramidal neurons with similar visual feature tuning, and (2) ongoing population activity of such pyramidal neuron clique is temporally linked to the activity of the local interneuron sharing its feature tuning with the clique members. Functional grouping of similarly tuned interneurons and pyramidal cells into cliques may ensure that ensembles of functionally alike pyramidal cells recruited during perceptual tasks and spontaneous activity are also turned off together as a unit, with interneurons serving as organizers of linked pyramidal ensemble activity.

Keywords: interneuron-pyramidal cell clusters; modularity; multineuronal bursts; neuronal ensembles; small world; spontaneous activity.


Figures

Figure 1.
Figure 1.
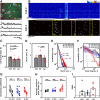
Spontaneous activity organizes as multineuronal population bursts. A, Top, FOV in the primary visual cortex stained with OGB-1 (green cell bodies). Red cells, Td-Tomato labeled Dlx5/6+ interneurons. Light blue, astrocytes (labeled by SR-101). Bottom, Example calcium dF/F signal time courses from cells circled in A. B, Top, Calcium dF/F responses from a population of 89 cells; this excerpt represents 370 s of recording out of a 30 min long spontaneous activity movie. White outline, Subregion of the time course expanded in the bottom. Bottom, Restricted portion of the population eventogram (outlined by a white rectangle in top) showing the onset of calcium responses (3 SD above baseline activity) in each individual cell. The ongoing activity contains both solitary cellular bursts (example in Box c) and multineuronal population bursts, involving many cells and extended in time. Multineuronal population bursts (examples are shown in Boxes a and b) are composed of at least two participating cells, whereas solitary cellular bursts (Box c) occur in one cell. The start of a burst is a frame that contains at least one active cell preceded by an empty frame; the end is the frame that contains at least one active cell followed by an empty frame. Yellow Boxes a and b outline two example multineuronal population bursts. Box a, 46 cells, 1.4 s long population burst. Box b, 7 cells, 0.46 s long burst. Box c, Outline of a solitary single-cell calcium event (solitary burst; size = 1 cell). Solitary burst events occupy one frame and are preceded and followed by an empty frame. From each FOV we collected between 10 and 40 min of ongoing activity, containing hundreds of population bursts. Please note that Boxes a–c are just examples and they do not represent all the multineuronal bursts that were identified from this segment of the movie. C, The rates of events in individual cells slightly decrease after eye opening (<EO, mean ± SEM, 0.05 ± 0.005 Hz, n = 7; EO: 0.036 ± 0.003 Hz, n = 7; Adult: 0.038 ± 0.002, n = 7; Wilcoxon rank sum test across FOVs, <EO vs Adult: p = 0.026, z = 2.1, W = 69.5, r = 0.56; <EO vs EO: p = 0.038, z = 2, W = 69, r = 0.54). Red triangles, Individual FOV values. D, The rate of population bursts (including both multineuronal and solitary bursts) also somewhat decreases after eye opening (EO vs Adult: p = 0.026, z = 2.17, W = 70, r = 0.58, Wilcoxon rank sum test across FOVs; <EO, mean ± SEM, 0.78 ± 0.08, n = 7; EO: 1.0 ± 0.11, n = 7; Adult: 0.62 ± 0.1, n = 7). Red triangles, Individual FOV values. E, F, Properties of population bursts follow scale-free distributions (<EO, n = 7; EO, n = 7; Adult, n = 7). E, The distribution of the burst sizes obeys a power law (α = −1.4 to −1.97) at every developmental stage tested (<EO: P8–P10; EO: P12–P16; Adult: P35+). Solid lines, Mean across individual FOV distributions; shading, SEM. Dotted lines, Control, distribution of burst sizes after random shuffling of cell event onsets. F, The distributions of node degrees, i.e., the number of significant functional links formed by each neuron (see Materials and Methods), are also scale-free at every developmental stage. However, now the power law changes slope (from −0.42 before eye opening to −1.28 in adulthood) reflecting a reduction in the number of functional links with postnatal maturation. Solid lines, Mean across individual FOV distributions; shading, SEM. Dotted lines, Control, distribution of significant links after random shuffling of cell event onsets. GI, V1 layer 2/3 V1 networks display small-world properties at every developmental stage. G, Clustering coefficients in L2/3 networks are larger than corresponding clustering coefficients in random networks with similar average number of links per node. <EO, Before eye opening; EO, around eye opening; Ad, adult. <EO(r), EO(r), and Ad(r) represent corresponding clustering coefficient values obtained from random networks with similar average number of connections per cell. These values were conservatively taken to be 3 SD (99.7% cutoff) above the mean of a null distribution of clustering coefficient values obtained by randomly reassigning existing connected pairs across the network nodes 5000 times (see Materials and Methods, Small-world network parameters and analysis). H, Average minimal path length stays similar across ages and is slightly reduced compared with random networks with similar total number of nodes and average number of links per individual node. Conventions are similar to G. I, SMW obtained by normalizing the real clustering coefficient and average minimum path length by those of corresponding randomly connected networks (see Materials and Methods) exceeds 1 (gray dotted line) at every age examined.
Figure 2.
Figure 2.
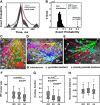
IPP clusters. Identifying PCs with increased probability to generate calcium events before the interneuron's events. A, Normalized histogram of PC events occurring −1000 to 1000 ms around the calcium response onsets of the interneuron. Dotted black line, Example of a single PC (mean over 65 trials). Solid black line, Aggregate responses of all PCs in an FOV whose probability of firing was increased before the interneuron's events. Filled patches, SEM across all trials. B, To assess significance, we first selected out PCs which had larger probability of events in the 600 ms period before the events of the interneuron compared with 600 ms period after the events of the interneuron. Next, the event trains of these PCs were randomly shuffled cell-by-cell, in circular fashion, to generate the 10000 point null distribution of PC event probability in 600 ms window after the events of the interneuron. The significance of the difference for each prospective pyramidal partner could then be determined by comparing the PC's event probability before interneuron's event relative to the null distribution (black histogram). The threshold p value was set at 0.05 after correction for multiple comparisons (in the example above this corresponds to initial uncorrected p value of 0.0011). Cells with p values below the threshold were accepted as partners, denoting a link between the interneuron and the corresponding PC (red bar; uncorrected p value is 0.0001, corresponding to 0.0045 after correction). CE, Examples of IPP clusters at different developmental points. C, P9; D, P15; E, P35. IPP-cluster members are color coded. i, Interneurons; filled disks, pyramidal members; circled disks, shared pyramidal members. Scale bars, 25 μm. F, IPP cluster size decreases significantly after eye opening and into adulthood: (<EO: P8–P10, n = 45; EO: P12–P16, n = 41; Ad: P35–P52, n = 38). Significance was assessed by Wilcoxon rank sum test across clusters, <EO vs adult: p = 0.0033, z = 2.4, W = 2047.5, r = 0.26; EO vs adult: p = 0.0249, z = 2.2, W = 1869, r = 0.25; <EO vs EO (nonsignificant difference): p = 0.4389, z = 0.7741, W = 2047.5, r = 0.08). G, IPP-cluster overlap drops at EO and further decreases in adult animals. Before EO mean fraction of overlapping cluster members was 0.28 ± 0.02 (n = 129 cluster pairs). This reduced to 0.18 ± 0.015 (n = 106 cluster pairs) at EO and further to 0.13 ± 0.016 (n = 92 cluster pairs) in adult animals. Significance was determined by Wilcoxon rank sum test across cluster pairs, <EO vs EO: p = 0.00022, z = 3.7, W = 17136, r = 0.24; <EO vs adult: p = 4 × 10⁻¹⁰, z = 6.3, W = 17242, r = 0.42; EO vs adult: p = 0.0016, z = 3.2, W = 11808, r = 0.23. H, The average distance of pyramidal IPP-cluster members from their partner interneuron, normalized for the expected increase in interneuronal distance over postnatal development, remains stable with age (see Materials and Methods). Box plots show the median, with notches encircling the 95% confidence interval and a box encompassing the interquartile range of the data. Whiskers cover the full range of the data, excluding the outliers. Outliers are marked with crosses.
Figure 3.
Figure 3.
IPP-cluster members show higher pairwise cross-correlation strength. A, Dark blue, IPP cluster members. Cyan, Size- and distance-matched control sample of randomly selected PCs from the same FOV. This control cluster has to satisfy the following requirements: (1) its size corresponds to the original cluster's size, and (2) its members have to be on average at the same distance from the original IPP cluster's partner interneuron as the IPP cluster's pyramidal members (see Materials and Methods). B, Null distribution (black histogram) of mean pairwise Pearson cross-correlation values (600 ms window) computed between PCs, one of which belongs to the IPP cluster, the other to a control cluster (see Materials and Methods). Ten thousand control clusters were randomly selected per IPP cluster within the FOV. Significance required that the mean pairwise correlation coefficient of the IPP cluster (red) be >99.7% of the null distribution values. C, Pairwise cross-correlation strength between IPP-cluster pyramidal partner members that belong to the same cluster (gray bars) versus pyramidal nonmembers, after controlling for pairwise distance (see Materials and Methods). Pairwise correlation strength decreases over time in agreement with the decorrelation that occurs in early postnatal development (Golshani et al., 2009; Rochefort et al., 2009): before eye opening mean in-cluster correlation was 0.087 ± 0.006 (median, 0.086); significantly dropping to 0.053 ± 0.005 (median, 0.052) after eye-opening and stabilizing at 0.05 ± 0.005 (median, 0.037) in adult animals [<EO, n = 44; EO, n = 40; adult, n = 36 clusters from 7 FOVs; Wilcoxon rank sum test results (over clusters), <EO vs EO: p = 0.00014, z = 3.8, W = 2296, r = 0.41; <EO vs adult: p = 2.5 × 10⁻⁵, z = 4.2, W = 2218, r = 0.47; EO vs adult (nonsignificant difference): p = 0.3682, z = 0.9, W = 1627, r = 0.103]. At all ages, average pairwise cross-correlation strength was significantly higher within versus across different IPP clusters (significance determined by Wilcoxon rank sum test, <EO: within clusters, 0.087 ± 0.006, across clusters 0.057 ± 0.006, n = 44 clusters, p = 0.00009, z = 4, W = 2424, r = 0.6; EO: within clusters, 0.053 ± 0.005, across clusters, 0.03 ± 0.0025, n = 40 clusters, p = 0.00028, z = 3.6, W = 1998, r = 0.57; adult: within clusters, 0.05 ± 0.005, across clusters, 0.03 ± 0.004, n = 36 clusters, p = 0.00019, z = 3.73, W = 1646, r = 0.62). D, Percentage of IPP clusters whose members have significantly higher mean cross-correlation strength than control, using the criterion described in B. Chance level is 1% (red dotted line). The percentage of IPP clusters with significantly higher mean pairwise cross-correlation strength than control is already substantial before eye opening (∼74% for <EO: n = 44 clusters from 7 FOVs, mean ± SEM: 0.71 ± 0.01) and remains high (65–85%) after eye opening (EO: n = 40 clusters from 7 FOVs, mean ± SEM: 0.85 ± 0.12; Adult: n = 36 clusters from 7 FOVs, mean ± SEM: 0.65 ± 0.08). Clusters consisting of the interneuron and single connected PC were excluded from analysis. Red triangles, Individual FOV values. Box plots show the median, with notches encircling the 95% confidence interval and a box encompassing the interquartile range of the data. Whiskers cover the full range of the data, excluding the outliers. Outliers are marked with crosses.
Figure 4.
Figure 4.
Refinement of IPP-cluster functional connections during development. A, The degree of functional connectivity (number of functional links per PC, expressed as a fraction of total number of PCs in the FOV) decreases over the course of early development. On average the mean degree of connectivity for PCs participating in more than one IPP cluster (shared cells; gray bars) drops from 0.61 ± 0.04 (median, 0.62) before eye opening (<EO, n = 42 clusters from 7 FOVs) to 0.41 ± 0.04 (median, 0.38) around eye opening (EO, n = 35 clusters from 7 FOVs) to 0.27 ± 0.04 (median, 0.17) in adulthood (P35+, n = 33 clusters from 7 FOVs). Corresponding numbers for cells participating exclusively in one IPP cluster (exclusive; white bars) are 0.49 ± 0.05 (median, 0.44) to 0.3 ± 0.035 (median, 0.27) to 0.205 ± 0.03 (median, 0.12), respectively. Significance is assessed by Wilcoxon rank sum test. Shared cells, <EO vs EO: p = 0.0019, z = 3.1, W = 1813, r = 0.35; <EO vs adult: p = 1.2 × 10⁻⁷, z = 5.3, W = 1958, r = 0.61; EO vs adult: p = 0.0185, z = 2.35, W = 1400, r = 0.29. Exclusive cells, <EO vs EO: p = 0.0088, z = 2.62, W = 1767, r = 0.3; <EO vs adult: p = 1.23 × 10⁻⁵, z = 4.4, W = 1875, r = 0.51; EO vs adult: p = 0.03, z = 2.2, W = 1384.5, r = 0.27. B, Even though both exclusive and shared cells lose significant number of connections after eye opening and with further development (Fig. 4A), the degree ratio between exclusive and shared cells belonging to a given IPP cluster is significantly shifted in favor of shared cells for every age group [one-sample signed rank test (against ratio = 1), <EO: mean shared/exclusive connectivity ratio 0.76 ± 0.04 (median, 0.81), p = 6.1 × 10⁻⁷; z = 5, W = 781, r = 0.77; EO: mean 0.74 ± 0.04 (median, 0.76), p = 1.4 × 10⁻⁶, z = 4.8, W = 609, r = 0.81; adult: mean 0.72 ± 0.05 (median, 0.7), p = 4.1 × 10⁻⁵, z = 4.1, W = 510, r = 0.71]. Dotted line (1) corresponds to the case when there is no difference in degree of connectivity between shared and exclusive cells (<EO: n = 42 clusters from 7 FOVs; EO: n = 35 clusters from 7 FOVs; adult: n = 33 clusters from 7 FOVs). Note that only clusters containing both exclusive and shared members were used in the analysis for A and B. C, The mean fraction of PCs that participate exclusively in one IPP cluster dramatically increases after eye opening and with further development, from 0.13 ± 0.02 (median, 0.07; <EO: n = 45 clusters, 7 FOVs) to 0.22 ± 0.03 (median, 0.18; EO: n = 41 clusters, 7 FOVs) to 0.41 ± 0.045 (median, 0.39; adult: n = 38 clusters, 7 FOVs). Significance was assessed with Wilcoxon rank sum test (across clusters, EO vs <EO: p = 0.028, z = 2.2, r = 0.24, W = 2038; adult vs <EO: p = 2.4 × 10⁻⁶, z = 4.7, W = 2112.5, r = 0.52; adult vs EO: p = 0.013, z = 3.2, W = 1848.5, r = 0.36). D, The number of interneuron partners per PC decreases on average during developmental refinement from pre-eye opening 3.6 ± 0.2 (median, 3.8; <EO: n = 45 clusters, 7 FOVs), to 2.7 ± 0.1 (median, 2.9) at eye opening (EO: n = 41 clusters, 7 FOVs) to 2.1 ± 0.1 (median, 2.16) interneurons/PC in adult animals (adult: n = 38 clusters, 7 FOVs). Significance of this decrease was confirmed by Wilcoxon rank sum test across clusters; <EO vs EO: p = 0.0029, z = 3, W = 2302, r = 0.32; <EO vs adult: p = 2.6 × 10⁻⁷, z = 5.2, W = 2454, r = 0.57; EO vs adult: p = 0.0005, z = 3.5, W = 1955.5, r = 0.4. Box plots show the median, with notches encircling the 95% confidence interval and a box encompassing the interquartile range of the data. Whiskers cover the full range of the data, excluding the outliers. Outliers are marked with crosses.
Figure 5.
Figure 5.
IPP-cluster members have similar functional properties. A, Example adult V1 L2/3 IPP-cluster with 45 PC members. The partner interneuron is denoted by “i”. B, Example tuning functions to drifting gratings for Cells 1–3 shown in A. C, Tuning function derived from the pyramidal members of the IPP cluster shown in A (black; see Materials and Methods) compared with the tuning function of the partner interneuron (red). Note that they share high similarity (median Pearson correlation coefficient ∼0.58 over n = 12 IPP clusters; mean ± SEM: 0.48 ± 0.11). D, Distribution of differences in the preferred direction of motion between tuned IPP cluster PC members and their partner interneuron, whose preferred direction is by convention set to zero (see Materials and Methods). The majority of tuned IPP cluster members have the same preferred direction as their partner interneuron. Red dotted line, Fraction expected by chance. E, Gray Bar, Fraction of IPP cluster PCs whose preferred direction is within ±45° of the preferred directions of their partner interneuron. White Bar, Control (tuned pyramidal nonmember cells from the same FOV). Black dotted line, Fraction expected by chance. The difference is significant (Wilcoxon signed rank test, p = 0.0049, z = 2.8, W = 73, r = 0.57, n = 12 IPP clusters). Data are expressed as mean ± SEM; cluster members: 0.754 ± 0.052, oriented non-members: 0.59 ± 0.042. Red triangles denote individual interneuron values; data points for the same interneuron are connected with solid red lines. F, IPP clusters with similar (within ±45°) tuning (“aligned”) show significantly larger PC overlap compared with IPP clusters with “orthogonal” (>±45°) preferences, which have very small overlap. Gray Bar, Aligned clusters: 0.133 ± 0.03 (n = 10 IPP cluster pairs). White Bar, Orthogonal clusters, 0.057 ± 0.015 (n = 16 IPP-cluster pairs). Statistical significance was determined by the Wilcoxon rank sum test across cluster pairs (p = 0.0346, z = 2.11, W = 175, r = 0.41). Note that more than half of the orthogonal cluster pairs had no common members, whereas all aligned cluster pairs had at least one shared member.

References

    1. Abramoff MD, Magalhaes PJ, Ram SJ (2004) Image processing with ImageJ. Biophotonics Int 11:36–42.
    1. Bassett DS, Bullmore ET (2006) Small-world brain networks. Neuroscientist 12:512–523. 10.1177/1073858406293182 - DOI - PubMed
    1. Beggs JM, Plenz D (2003) Neuronal avalanches in neocortical circuits. J Neurosci 23:11167–11177. 10.1523/JNEUROSCI.23-35-11167.2003 - DOI - PMC - PubMed
    1. Bonifazi P, Goldin M, Picardo MA, Jorquera I, Cattani A, Bianconi G, Represa A, Ben-Ari Y, Cossart R (2009) GABAergic hub neurons orchestrate synchrony in developing hippocampal networks. Science 326:1419–1424. 10.1126/science.1175509 - DOI - PubMed
    1. Buzsáki G. (2010) Neural syntax: cell assemblies, synapsembles and readers. Neuron 68:362–385. 10.1016/j.neuron.2010.09.023 - DOI - PMC - PubMed

Publication types

LinkOut - more resources