. 2019 Apr 13:25:2702-2717.
doi: 10.12659/MSM.915018.

A Novel Rat Model of Patellofemoral Osteoarthritis Due to Patella Baja, or Low-Lying Patella

Affiliations

A Novel Rat Model of Patellofemoral Osteoarthritis Due to Patella Baja, or Low-Lying Patella

Mingjian Bei et al. Med Sci Monit. .

Abstract

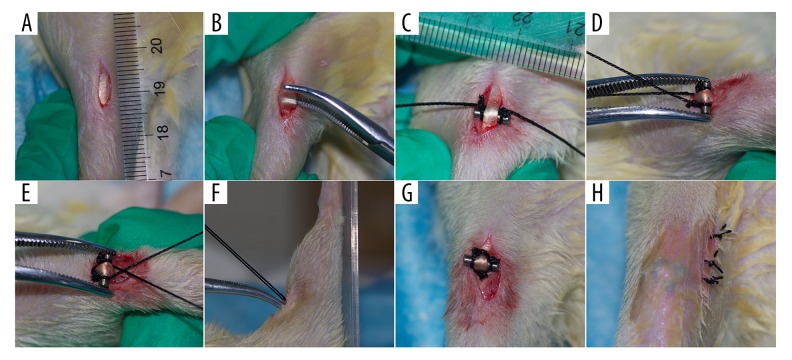
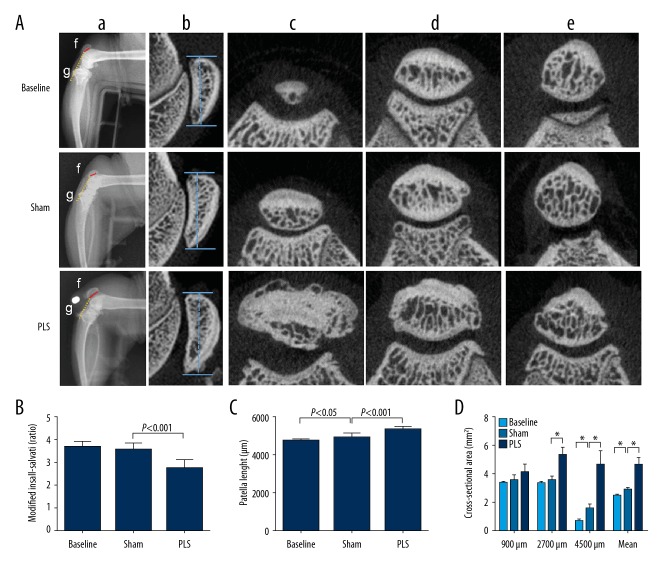
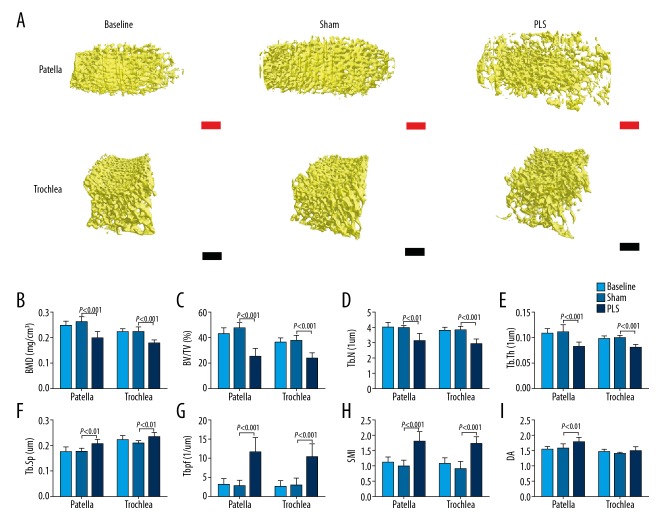
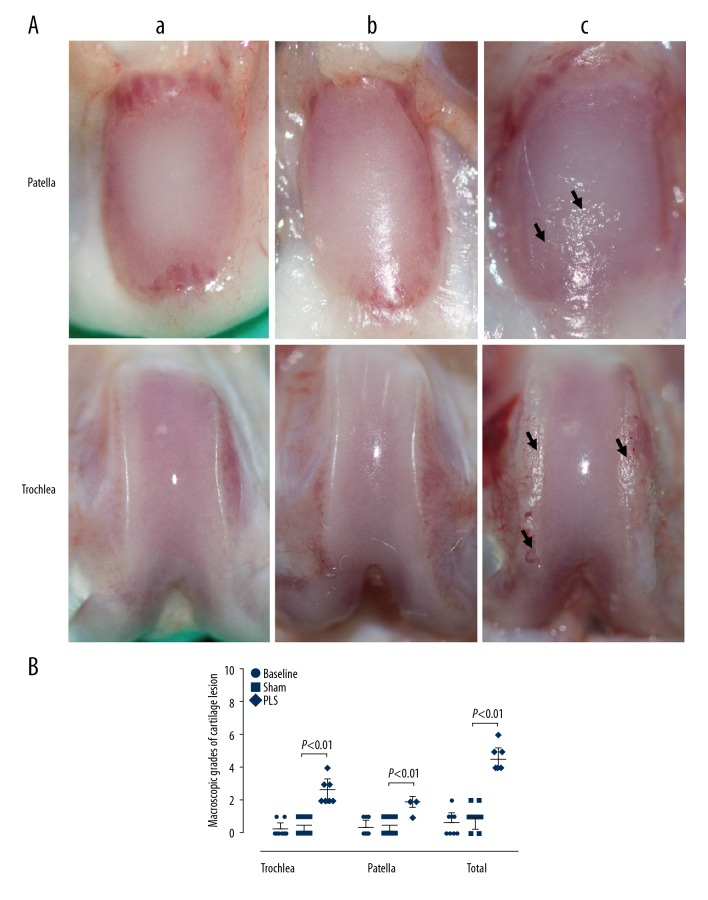
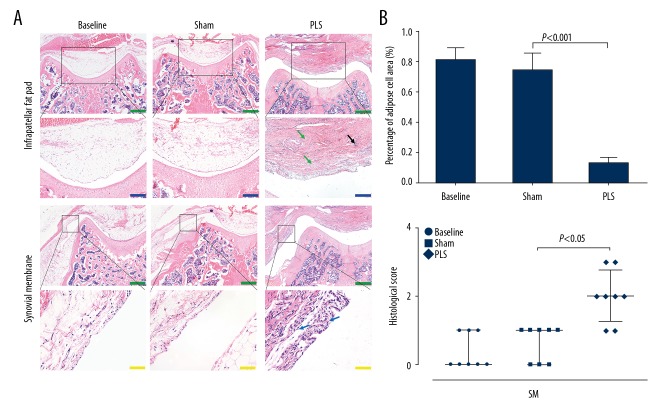
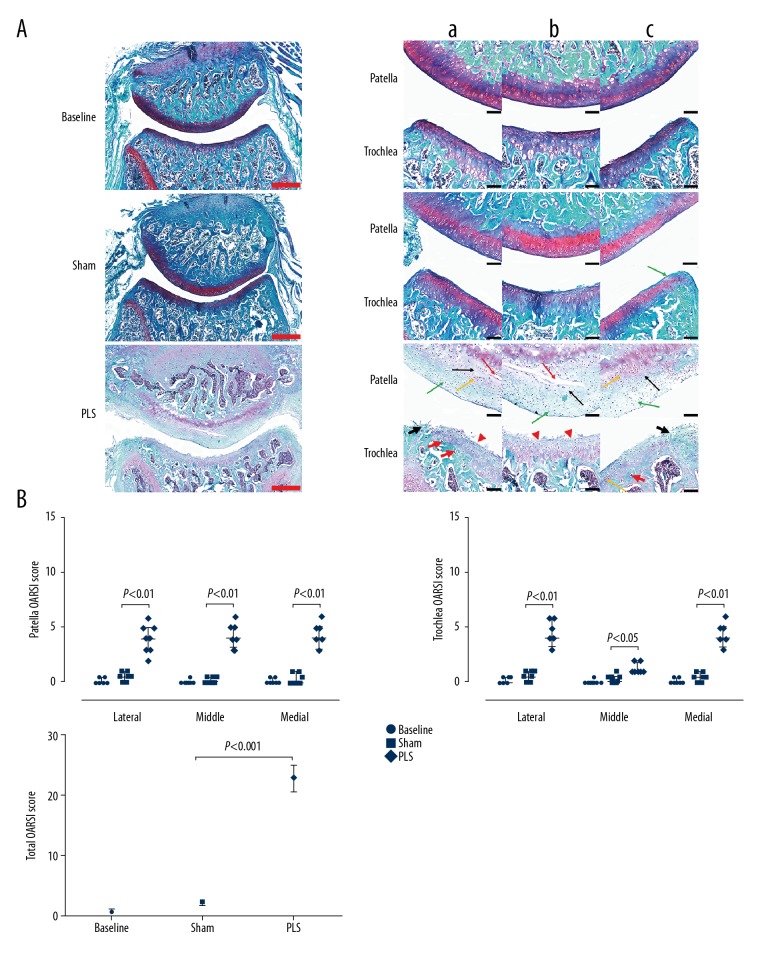
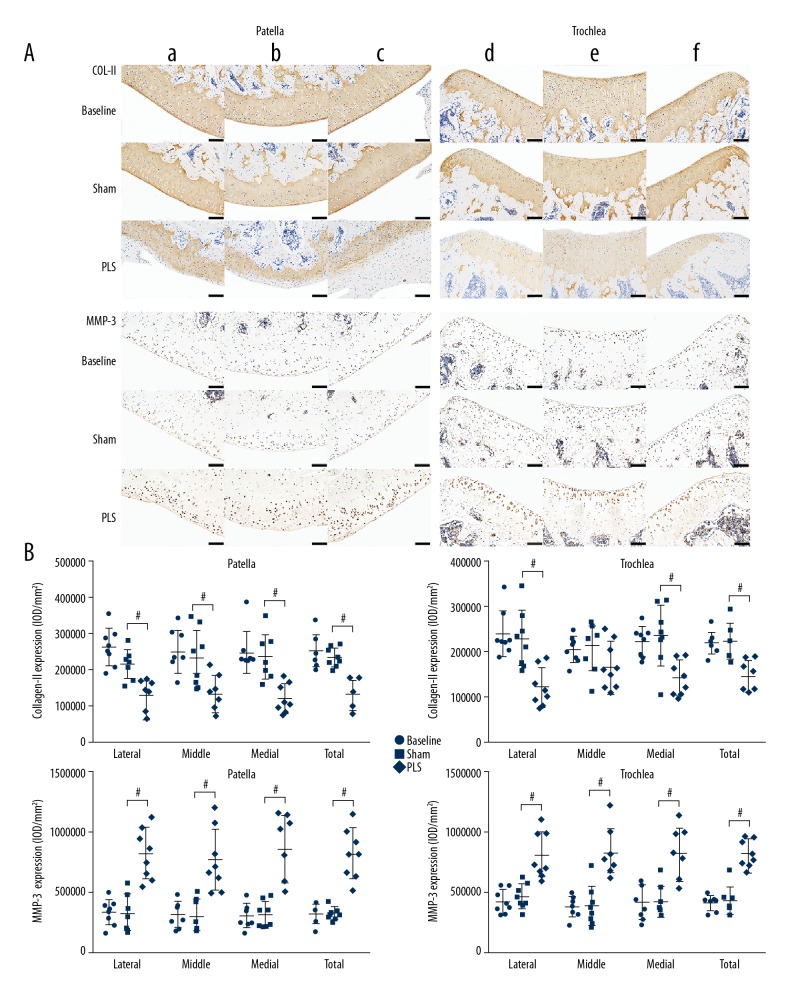
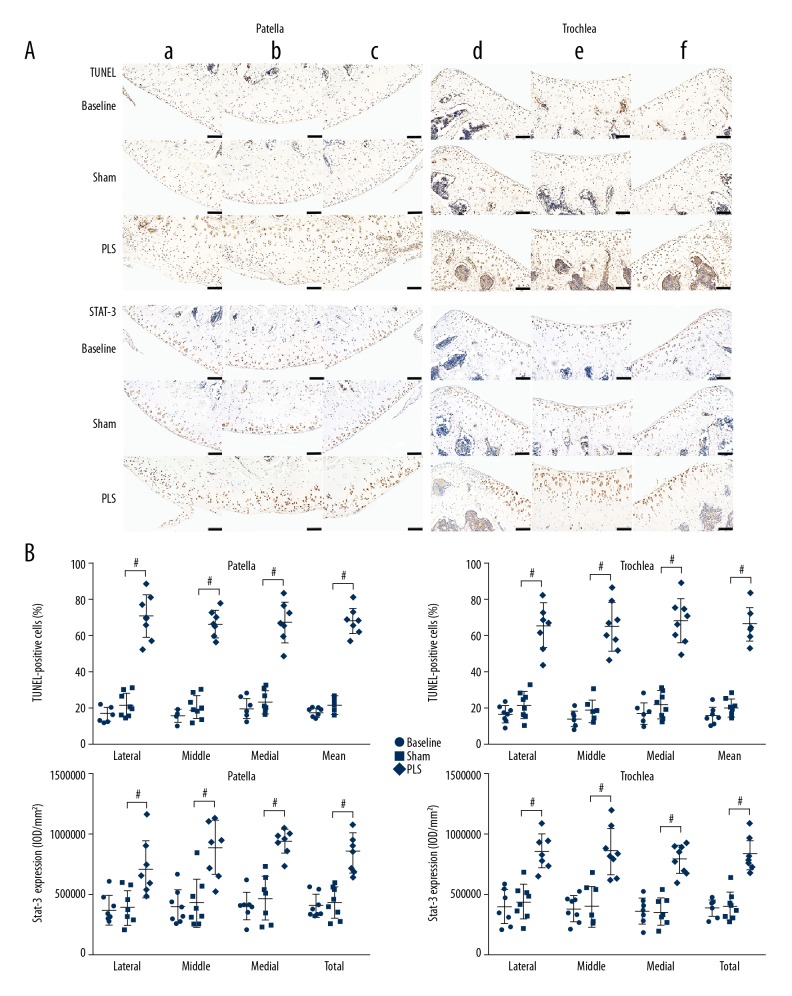
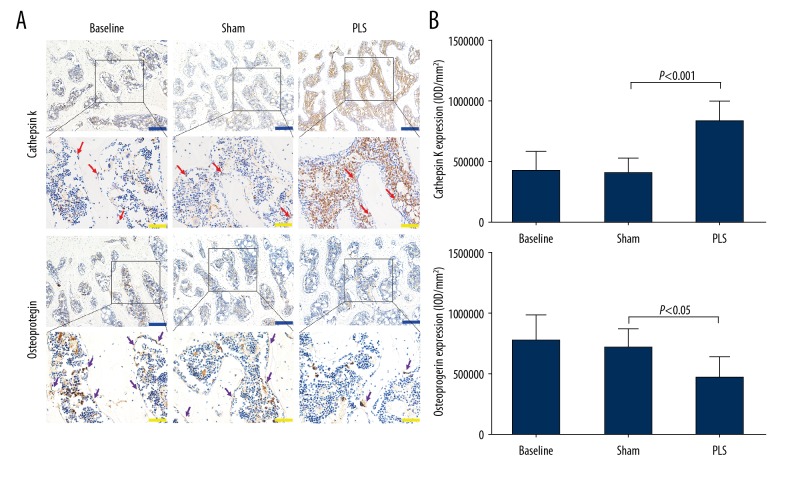
BACKGROUND Patella baja, or patella infera, consists of a low-lying patella that results in a limited range of motion, joint pain, and crepitations. Patellofemoral joint osteoarthritis (PFJOA) is a subtype OA of the knee. This study aimed to develop a reproducible and reliable rat model of PFJOA. MATERIAL AND METHODS Three-month-old female Sprague-Dawley rats (n=24) included a baseline group (n=8) that were euthanized at the beginning of the study. The sham group (n=8), and the patella ligament shortening (PLS) group (n=8) were euthanized and evaluated at ten weeks. The PLS model group (n=8) underwent insertion of a Kirschner wire under the patella tendon to induce patella baja. At ten weeks, the sham group and the PLS group were compared using X-ray imaging, macroscopic appearance, histology, immunohistochemistry, TUNEL staining for apoptosis, and micro-computed tomography (micro-CT). The patella height was determined using the modified Insall-Salvati (MIS) ratio. RESULTS The establishment of the rat model of patella baja in the PLS group at ten weeks was confirmed by X-ray. In the PLS group, patella volume, sagittal length, and cross-sectional area were significantly increased compared with the sham group. The PFJ showed typical lesions of OA, confirmed macroscopically and histologically. Compared with the sham group, in the rat model of PFJOA, there was increased cell apoptosis, and immunohistochemistry showed increased expression of biomarkers of osteoarthritis, compared with the sham group. CONCLUSIONS A rat model of PFJOA was developed that was confirmed by changes in cartilage and subchondral bone.


Conflict of interest statement

Conflict of interest

None.

Figures

Figure 1
Figure 1
The surgical procedure of patellar ligament shortening (PLS) in the rat model of patellofemoral joint osteoarthritis (PFJOA). (A) The 1 cm longitudinal medial para-articular incision, performed after sterilizing the skin. (B) Blunt separation of the patella tendon. (C) Kirschner wire, 7 mm in length and 2 mm in diameter, with a groove with a 1-0 nylon suture at both ends at a distance of 1 mm, was inserted under the patella tendon from medial to lateral. (D) The sutures crossed each other at the proximal end of the patella tendon. (E–G) The sutures were passed under both grooves, and the ligature in the patella ligament was tightened with the knee in a position of maximum extension. (H) The skin was closed with 3-0 nylon sutures.
Figure 2
Figure 2
Imaging findings of the patella baja created by patellar ligament shortening (PLS) surgery in the rat model of patellofemoral joint osteoarthritis (PFJOA). (A) X-radiograph images of the patella baja and changes of patella structure induced by PLS surgery. a) Radiographies of the lateral right knee in approximately 90° flexion with a specific right-angle device. b) X-radiographs of the sagittal length of the patella. c), d), e), representative cross-sectional micro-computed tomography (micro-CT) images at 4500 μm, 2700 μm, and 900 μm distal from the proximal region of the patella, respectively. f) The length of the patellar articular surface. g) The distance from the inferior edge of the patella articular surface to the end of the patella tendon. (B) The modified Insall-Salvati (MIS) ratio. (C) The patella length. (D) The analysis of cross-sectional area at different locations distant from the proximal region of the patella. Data are expressed as the mean ± standard deviation (SD). * P<0.05 versus the baseline group. # P<0.05 versus the sham group.
Figure 3
Figure 3
The pathological and structural changes in the subchondral bone of both the patella and trochlea induced by patellar ligament shortening (PLS) surgery in the rat model of patellofemoral joint osteoarthritis (PFJOA). (A) The pathological changes in the subchondral bone of both the patella and trochlea induced by patella ligament shortening (PLS) surgery. (B) Micro-computed tomography (micro-CT) analysis of the trabecular bone mineral density (BMD). (C) Bone volume fraction, or bone volume (BV)/total volume (TV). (D) Trabecular number (Tb.N). (E) Trabecular thickness (Tb.Th). (F) Trabecular separation distance (Tb.Sp). (G) Trabecular pattern factor (Tb.Pf). (H) Structure model index (SMI). (I) The degree of anisotropy (DA). Red bars=100 μm. Black bars=250 μm. Data are expressed as the mean ± standard deviation (SD).
Figure 4
Figure 4
The macroscopic images and scores in the patella and trochlea induced by patellar ligament shortening (PLS) surgery in the rat model of patellofemoral joint osteoarthritis (PFJOA). The macroscopic images (A) and scores (B) of injury in the patella and trochlea. a) The baseline group (n=8). b) The sham group (n=8). c) The patella ligament shortening (PLS) group (n=8). The macroscopic images of the cartilage surface of both the patella and trochlea in the rats that underwent PLS surgery-induced patella baja showed cartilage erosion when compared with normal cartilage in the sham group. Black arrows indicate large cartilage erosion. Data are expressed as the median and interquartile range (IQR).
Figure 5
Figure 5
Photomicrographs of the histology of the patella and trochlea induced by patellar ligament shortening (PLS) surgery in the rat model of patellofemoral joint osteoarthritis (PFJOA). (A) Representative histological images of the infrapatellar fat pad (IFP) and synovial membrane (SM). Hematoxylin and eosin (H&E). (B) Analysis of the histological results of the infrapatellar fat pad (IFP) and synovial membrane (SM), respectively. The black arrow indicates the loss of adipocytes with an inflammatory cell infiltration. The green arrow indicates fibroplasia. The blue arrow indicates synovial cell proliferation. Blue bars=200 μm. Green bars=500 μm. Yellow bars=50 μm. Data are expressed as the mean ± standard deviation (SD), with the exception of the scores of the synovial membrane (SM), which are presented as the median and interquartile range (IQR).
Figure 6
Figure 6
Photomicrographs of the histology of the patella and trochlea induced by patellar ligament shortening (PLS) surgery in the rat model of patellofemoral joint osteoarthritis (PFJOA). (A) Representative histological sections stained with Safranin O/fast green of the patellofemoral joint (PFJ) in the three rat study groups. Bilateral weight-bearing areas (a, lateral; c, medial) and non-weight-bearing areas b) of the patella and trochlea. (B) Analysis of the Osteoarthritis Research Society International (OARSI) score of the patella, trochlea, and both, respectively. The green arrow indicates reduced Safranin O staining. The red arrow indicates horizontal clefts and denudation. The black arrow indicates cartilage swelling. The yellow arrow indicates chondrocyte clones. The red arrowhead indicates irregularities in the cartilage surface. The short black arrow indicates a large erosion with fibrous tissue proliferation. Red bars=500 μm. Black bars=100 μm. Data are expressed as the median and interquartile range (IQR).
Figure 7
Figure 7
Photomicrographs of the immunohistochemistry of the patella and trochlea induced by patellar ligament shortening (PLS) surgery in the rat model of patellofemoral joint osteoarthritis (PFJOA). (A) Immunohistochemistry staining for collagen type II (COL2A1) and matrix metalloproteinase-3 (MMP-3) expression in the bilateral weight-bearing areas (a, d, lateral; c, f, medial) and non-weight-bearing areas b, e) of cartilage in the patella and trochlea among the groups. (B) Quantification of protein expression of COL2A1 and MMP-3 in the patella and trochlea, respectively. Bars=100 μm. Data are expressed as the mean ± standard deviation (SD). P<0.05 versus the sham group.
Figure 8
Figure 8
Photomicrographs of the TUNEL staining for cell apoptosis and immunohistochemistry for STAT3 of the patella and trochlea induced by patellar ligament shortening (PLS) surgery in the rat model of patellofemoral joint osteoarthritis (PFJOA). (A) Images of both the TUNEL staining and immunohistochemistry for STAT3 expression in the bilateral weight-bearing areas (a, d, lateral; c, f, medial) and non-weight-bearing areas (b, e) of cartilage in the patella and trochlea in the rat groups. (B) The quantified percentage of TUNEL-positive chondrocytes and protein levels of STAT3 in the patella and trochlea, respectively. Bars=100 μm. Data are expressed as the mean ± standard deviation (SD).# P<0.05 versus the sham group.
Figure 9
Figure 9
Photomicrographs of the immunohistochemistry for cathepsin K and osteoprotegerin (OPG) of the patella and trochlea induced by patellar ligament shortening (PLS) surgery in the rat model of patellofemoral joint osteoarthritis (PFJOA). (A) Representative immunohistochemical images of both cathepsin K and osteoprotegerin (OPG) in the subchondral bone. (B) The quantified protein levels of cathepsin K and OPG in the subchondral bone. The red arrow indicates the expression of cathepsin K-positive-stained cells. The purple arrow indicates the expression of OPG-positive cells. Blue bars=200 μm. Yellow bars=50 μm. Data are expressed as the mean ± standard deviation (SD).

References

    1. Murray CJ, Vos T, Lozano R, et al. Disability-adjusted life years (DALYs) for 291 diseases and injuries in 21 regions, 1990–2010: A systematic analysis for the Global Burden of Disease Study 2010. Lancet. 2012;380:2197–223. - PubMed
    1. Lawrence RC, Felson DT, Helmick CG, et al. Estimates of the prevalence of arthritis and other rheumatic conditions in the United States. Part II. Arthritis Rheum. 2008;58:26–35. - PMC - PubMed
    1. Kim YM, Joo YB. Patellofemoral osteoarthritis. Knee Surg Relat Res. 2012;24:193–200. - PMC - PubMed
    1. Davies AP, Vince AS, Shepstone L, et al. The radiologic prevalence of patellofemoral osteoarthritis. Clin Orthop Relat Res. 2002;(402):206–12. - PubMed
    1. Collins NJ, Hinman RS, Menz HB, Crossley KM. Immediate effects of foot orthoses on pain during functional tasks in people with patellofemoral osteoarthritis: A cross-over, proof-of-concept study. Knee. 2017;24:76–81. - PubMed

MeSH terms