. 2019 Apr 12;10(1):1718.
doi: 10.1038/s41467-019-08737-6.

Steroid receptor coactivator-1 modulates the function of Pomc neurons and energy homeostasis

Affiliations

Steroid receptor coactivator-1 modulates the function of Pomc neurons and energy homeostasis

Yongjie Yang et al. Nat Commun. .

Abstract

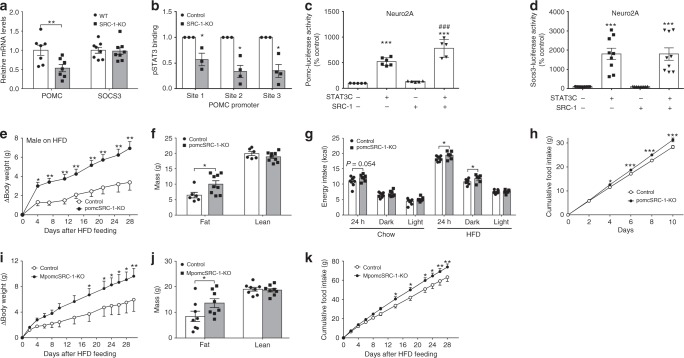
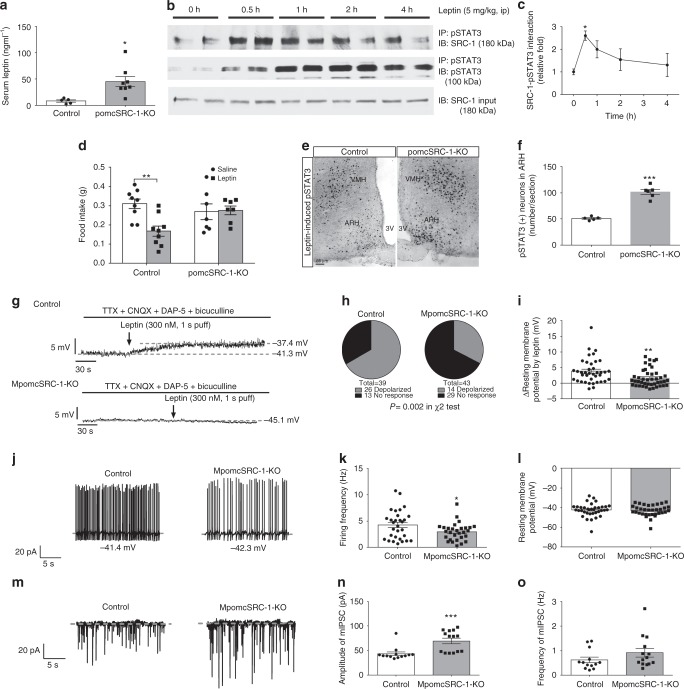
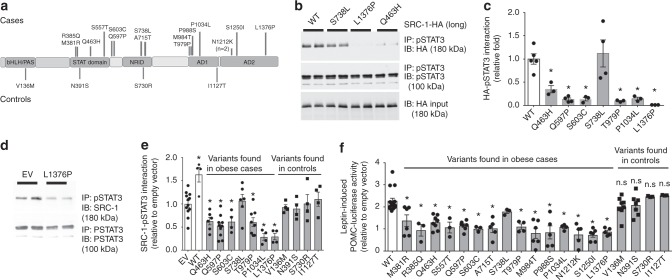
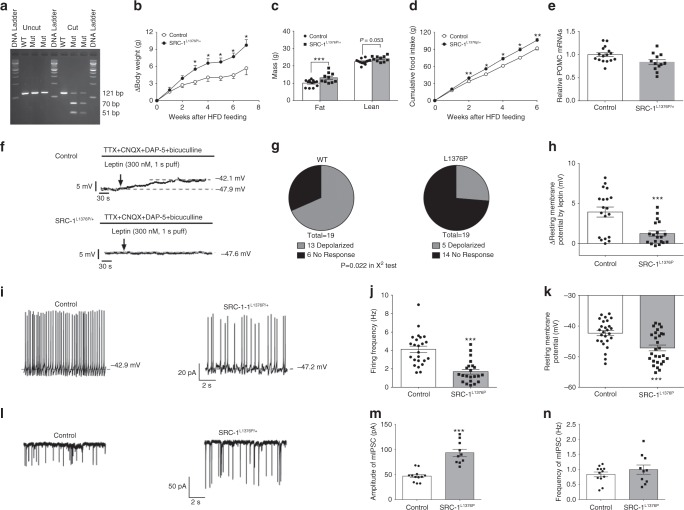
Hypothalamic neurons expressing the anorectic peptide Pro-opiomelanocortin (Pomc) regulate food intake and body weight. Here, we show that Steroid Receptor Coactivator-1 (SRC-1) interacts with a target of leptin receptor activation, phosphorylated STAT3, to potentiate Pomc transcription. Deletion of SRC-1 in Pomc neurons in mice attenuates their depolarization by leptin, decreases Pomc expression and increases food intake leading to high-fat diet-induced obesity. In humans, fifteen rare heterozygous variants in SRC-1 found in severely obese individuals impair leptin-mediated Pomc reporter activity in cells, whilst four variants found in non-obese controls do not. In a knock-in mouse model of a loss of function human variant (SRC-1L1376P), leptin-induced depolarization of Pomc neurons and Pomc expression are significantly reduced, and food intake and body weight are increased. In summary, we demonstrate that SRC-1 modulates the function of hypothalamic Pomc neurons, and suggest that targeting SRC-1 may represent a useful therapeutic strategy for weight loss.


Conflict of interest statement

The authors declare no competing interests.

Figures

Fig. 1
Fig. 1
SRC-1 potentiates STAT3-induced Pomc expression. Numbers of mice/repeats in each group are indicated; data are presented as mean ± SEM and compared using T-tests or two-way ANOVA followed by post hoc Sidak tests (#). a Pomc and Socs3 mRNA levels in hypothalami from 16-week old SRC-1-KO and WT control littermates (n = 7/8); **P < 0.01. b ChIP assays detecting pSTAT3 binding on Pomc promoters in hypothalami from male SRC-1-KO and control littermates 30 min after leptin injections (5 mg/kg, i.p.): site 1, −998 to −989; site 2, −361 to −353; site 3, −76 to −68 upstream of Pomc (n = 3/4); *P < 0.05. c, d Effects of overexpressed constitutively active STAT3 and SRC-1 on Pomc- (c) or Socs3-luciferase activity (d) in Neuro2A cells (n = 5–9 independent experiments). ***P < 0.001 vs. empty vectors; ###P < 0.001 vs. STAT3 alone (#). e Change (∆) in body weight after male control and pomcSRC-1-KO mice were switched onto a HFD at day 97 (n = 6/9); *P < 0.05 and **P < 0.01 (#). f Fat mass and lean mass measured 28 days after HFD feeding (n = 6/9); *P < 0.05. g Energy intake measured by CLAMS chambers in 12-week old male mice matched for body weight, lean mass, and fat mass. Mice were subjected to a 2-day-chow–2-day-HFD protocol, and chow was replaced by HFD before the onset of dark cycle on day 3. Energy intake was averaged for 2-day chow feeding period and for 2-day HFD feeding period (n = 7/8); *P < 0.05. h Cumulative HFD intake measured in 12-week old male mice singly housed in home cages (n = 10/14); *P < 0.05 (#). i Change in body weight after control and MpomcSRC-1-KO mice were switched on a HFD at the age of day 84 (n = 8); *P < 0.05 (#). j Fat mass and lean mass measured 30 days after HFD feeding (n = 8); *P < 0.05. k Cumulative HFD intake measured in 12-week old male mice (n = 6/7); *P < 0.05 (#), **P < 0.01. Source data are provided as Source Data Fig. 1
Fig. 2
Fig. 2
SRC-1 mediates leptin signaling. Numbers of mice/experiments/neurons are indicated; data are presented as mean ± SEM and compared using T-tests or one- or two-way ANOVA followed by post hoc Sidak tests (#). a Serum leptin levels 42 days after HFD feeding (n = 5/8); *P < 0.05. b Time course of hypothalamic SRC-1-pSTAT3 interaction in C57Bl6 wild type mice that received i.p. injections of leptin (5 mg/kg). c Quantification of the hypothalamic SRC-1-pSTAT3 interaction. *P < 0.05 (#). d Two-hour fasted mice (12 weeks of age) received i.p. injections of saline or leptin (5 mg/kg) 15 min prior to refeeding and food intake was recorded for 1 h afterwards (n = 7/9); **P < 0.01 (#). e Representative pSTAT3 immunohistochemical staining in the ARH and VMH of control and pomcSRC-1-KO mice receiving a single bolus i.p. injection of leptin (0.5 mg/kg, 90 min). Scale bar = 50 μm. 3V the 3rd ventricle, ARH arcuate nucleus, VMH ventromedial hypothalamic nucleus. f Quantification of pSTAT3 (+) neurons in the ARH (n = 5); ***P < 0.001. g Representative traces of leptin-induced depolarization, in the presence of TTX, CNQX, DAP-5, and bicuculline, in mature Pomc neurons from control mice vs. from MpomcSRC-1-KO mice after 1-week HFD feeding. h Responsive ratio (depolarization is defined as >2 mV elevations in resting membrane potential) (n = 39/43); P = 0.002 in χ2 tests. i Quantification of leptin-induced depolarization in two groups (n = 39/43); **P < 0.01. j Representative traces of action potentials in untreated mature Pomc neurons from control mice vs. from MpomcSRC-1-KO mice. k, l Quantification of firing frequency (k) and resting membrane potential (l) in two groups (n = 29–36); *P < 0.05. m Representative traces of mIPSC in untreated mature Pomc neurons from control mice vs. from MpomcSRC-1-KO mice. n, o Quantification of amplitude (n) and frequency (o) of mIPSC in two groups (n = 13/14); ***P < 0.001. Source data are provided as Source Data Fig. 2
Fig. 3
Fig. 3
Missense variants in SRC-1 disrupt leptin signaling. Numbers of experiments are indicated; data are presented as mean ± SEM and compared using one-way ANOVA followed by post hoc Sidak tests unless mentioned otherwise. a Rare variants identified in individuals with severe early onset obesity (above) and in controls (below). b, c HEK293 cells were co-transfected with leptin receptor vector and human STAT3 vector. Cells were treated with leptin (200 ng/ml, 15 min) to induce phosphorylation of STAT3. pSTAT3 was pulled down using anti-pSTAT3 sepharose beads; beads were then aliquoted equally and incubated with the same amount of the long isoform of human SRC-1-HA (WT/mutant) and interactions between the pSTAT3 and SRC-1 were determined by CoIP experiments using anti-pSTAT3 and anti-HA antibodies. b Representative blots showing interactions between pSTAT3 and SRC-1 (WT/mutant), and inputs of pSTAT3 and SRC-1-HA. c Quantification for WT and SRC-1 mutants. Comparative folds were calculated as the ratios of HA blots and HA inputs (n = 3–5); *P < 0.05. d, e SRC-1 mutants inhibit the interaction between STAT3 and WT SRC-1. HEK293 cells were co-transfected with leptin receptor vector, STAT3 vector, and mutant SRC-1 vector (or empty vector). Cells were treated with leptin (200 ng/ml, 15 min) to induce phosphorylation of STAT3 and interactions between pSTAT3 and total SRC-1 were determined by CoIP experiments using anti-pSTAT3 and anti-SRC-1 antibodies. d Representative blots showing interactions between pSTAT3 and SRC-1 variants found in obese cases and inputs of pSTAT3. e Quantification. Comparative folds were calculated as the ratios of SRC-1-pSTAT3 interaction blots and pSTAT3 inputs (n = 4–12); *P < 0.05. f SRC-1 variants impair POMC expression. Neuro2A cells were co-transfected with leptin receptor vector, SRC-1 (WT or mutant) and a POMC luciferase expression reporter construct. Cells were stimulated with 200 ng/ml leptin for 15 min and then incubated for 6 h, following which luminescence was measured. Results were normalized to empty vector-induced expression (n = 3–16); *P < 0.05. Source data are provided as Source Data Fig. 3
Fig. 4
Fig. 4
SRC-1L1376P/+ mice are obese. Numbers of mice in each group are indicated; data are presented as mean ± SEM and compared using T-tests or two-way ANOVA followed by post hoc Sidak tests (#). a The PCR products (121 bp) around the L1376 were amplified from genomic DNA extracts of a WT and two SRC-1L1376P/+ mutant mice and incubated with or without Sau3AI. Control reaction (WT) resulted in a single large fragment (121 bp) and DNAs from the two SRC-1L1376P/+ mutant mice were cut into two fragments (70 and 51 bp) as expected. b Change in body weight after male control and SRC-1L1376P/+ mice were fed on a HFD (n = 5/6); *P < 0.05 (#). c Fat mass and lean mass measured 7 weeks after HFD feeding (n = 5/6); ***P < 0.001. d Cumulative HFD intake measured (n = 5/6); *P < 0.05 or **P < 0.01 (#). e Pomc mRNA levels in hypothalami from 20-week old HFD-fed male control and SRC-1L1376P/+ mice (n = 12/16); *P < 0.05. f Representative traces of leptin-induced depolarization, in the presence of TTX, CNQX, DAP-5, and bicuculline, in Pomc neurons from control mice vs. from SRC-1L1376P/+ mice after 1-week HFD feeding. g Responsive ratio (depolarization is defined as >2 mV elevations in resting membrane potential) (n = 19); P = 0.022 in χ2 tests. h Quantification of leptin-induced depolarization in two groups (n = 19); ***P < 0.001. i Representative traces of action potentials in untreated Pomc neurons from control mice vs. from SRC-1L1376P/+ mice. j, k Quantification of firing frequency (j) and resting membrane potential (k) in two groups (n = 22–28); ***P < 0.001. l Representative traces of mIPSC in untreated Pomc neurons from control mice vs. from SRC-1L1376P/+ mice. m, n Quantification of amplitude (m) and frequency (n) of mIPSC in two groups (n = 10/12); ***P < 0.001. Source data are provided as Source Data Fig. 4

References

    1. Dasgupta S, Lonard DM, O’Malley BW. Nuclear receptor coactivators: master regulators of human health and disease. Annu. Rev. Med. 2014;65:279–292. doi: 10.1146/annurev-med-051812-145316. - DOI - PMC - PubMed
    1. York B, O’Malley BW. Steroid receptor coactivator (SRC) family: masters of systems biology. J. Biol. Chem. 2010;285:38743–38750. doi: 10.1074/jbc.R110.193367. - DOI - PMC - PubMed
    1. Picard F, et al. SRC-1 and TIF2 control energy balance between white and brown adipose tissues. Cell. 2002;111:931–941. doi: 10.1016/S0092-8674(02)01169-8. - DOI - PubMed
    1. Zhu L, et al. Steroid receptor coactivator-1 mediates estrogenic actions to prevent body weight gain in female mice. Endocrinology. 2013;154:150–158. doi: 10.1210/en.2012-2007. - DOI - PMC - PubMed
    1. Hill JW, Elmquist JK, Elias CF. Hypothalamic pathways linking energy balance and reproduction. Am. J. Physiol. Endocrinol. Metab. 2008;294:E827–E832. doi: 10.1152/ajpendo.00670.2007. - DOI - PMC - PubMed

Publication types

MeSH terms