. 2019 Apr 12;9(1):5977.
doi: 10.1038/s41598-019-42439-9.

Assembly of Human Stem Cell-Derived Cortical Spheroids and Vascular Spheroids to Model 3-D Brain-like Tissues

Affiliations

Assembly of Human Stem Cell-Derived Cortical Spheroids and Vascular Spheroids to Model 3-D Brain-like Tissues

Liqing Song et al. Sci Rep. .

Abstract

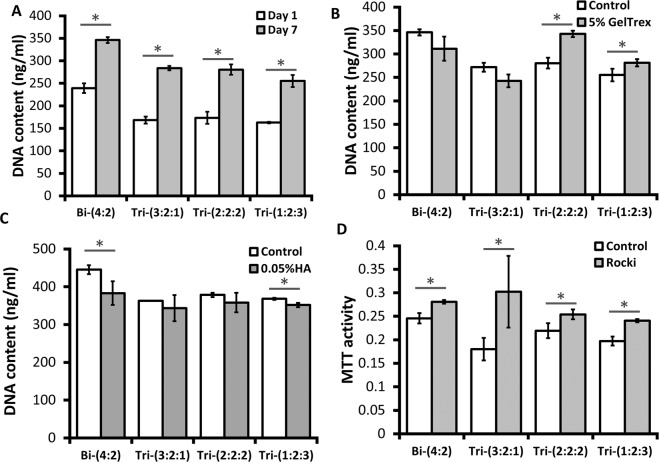
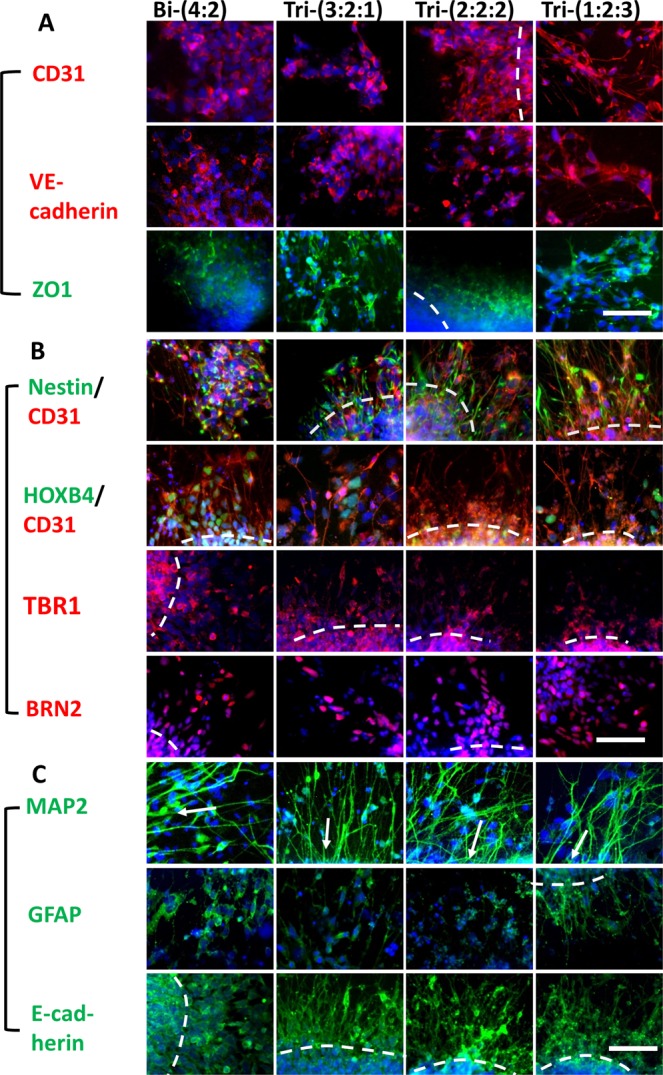
Human cerebral organoids derived from induced pluripotent stem cells (iPSCs) provide novel tools for recapitulating the cytoarchitecture of human brain and for studying biological mechanisms of neurological disorders. However, the heterotypic interactions of neurovascular units, composed of neurons, pericytes, astrocytes, and brain microvascular endothelial cells, in brain-like tissues are less investigated. The objective of this study is to investigate the impacts of neural spheroids and vascular spheroids interactions on the regional brain-like tissue patterning in cortical spheroids derived from human iPSCs. Hybrid neurovascular spheroids were constructed by fusion of human iPSC-derived cortical neural progenitor cell (iNPC) spheroids, endothelial cell (iEC) spheroids, and the supporting human mesenchymal stem cells (MSCs). Single hybrid spheroids were constructed at different iNPC: iEC: MSC ratios of 4:2:0, 3:2:1 2:2:2, and 1:2:3 in low-attachment 96-well plates. The incorporation of MSCs upregulated the secretion levels of cytokines VEGF-A, PGE2, and TGF-β1 in hybrid spheroid system. In addition, tri-cultured spheroids had high levels of TBR1 (deep cortical layer VI) and Nkx2.1 (ventral cells), and matrix remodeling genes, MMP2 and MMP3, as well as Notch-1, indicating the crucial role of matrix remodeling and cell-cell communications on cortical spheroid and organoid patterning. Moreover, tri-culture system elevated blood-brain barrier gene expression (e.g., GLUT-1), CD31, and tight junction protein ZO1 expression. Treatment with AMD3100, a CXCR4 antagonist, showed the immobilization of MSCs during spheroid fusion, indicating a CXCR4-dependent manner of hMSC migration and homing. This forebrain-like model has potential applications in understanding heterotypic cell-cell interactions and novel drug screening in diseased human brain.


Conflict of interest statement

The authors declare no competing interests.

Figures

Figure 1
Figure 1
Fusion kinetics of iNPC spheroids and hMSCs with iEC spheroids to construct hybrid spheroids. (A) (i) Schematic illustration of endothelial cell (iEC) spheroid derivation from hiPSCs. (ii) Schematic illustration of generating hybrid spheroids from iNPCs. hMSCs were added to iNPCs for iNPC-MSC-iEC spheroids (method A), before iEC transfer. Or hMSCs were added to the well containing iNPC and iEC spheroids for iNPC-iEC-MSC spheroids (method B). hMSCs were labeled with CellTracker Red. (B) Phase contrast images of iNPC-iEC-MSC spheroids morphology at day 1, 3, 5, and 7 (total day 15–21). iEC spheroids and MSCs were added to the preformed iNPC aggregates. Scale bar: 400 μm. (C) (i) Schematic illustration of calculation of squared aspect ratio of contact length between two aggregates over maximum diameter (LneckLmax)2. The aggregation kinetics were evaluated by (ii) the squared aspect ratio over 7 days and (iii) the inter-sphere angle formed by the two aggregates. (D) Overlay of phase contrast images (iNPCs and iECs) with fluorescent images (hMSCs) of hybrid spheroids (i) with or (ii) without ROCKi Y27632 (10 μM) when MSCs were added to the culture one week after fusion of iNPC spheroids and iEC spheroids. Scale bar: 400 μm. (E) The aggregation kinetics were analyzed in (Ei) and (Eii), respectively. *Indicates p < 0.05 for the different test conditions.
Figure 2
Figure 2
Metabolic activity and DNA content of hybrid spheroids in suspension. (A) DNA content of hybrid spheroids after 1 or 7 days of tri-culture (total day 15, 21). (B) DNA content of hybrid spheroids with the treatment of 5% Geltrex after 7 days (total day 21) of tri-culture; (C) DNA content of hybrid spheroids with the treatment of 0.05 wt% hyaluronic acid (HA) after 7 days (total day 21) of tri-culture. (D) MTT activity of hybrid spheroids with the treatment of 20 μM ROCKi Y27632 after 7 days (total day 21) of tri-culture. The control group indicates no treatment. *Indicates p < 0.05 for the different test conditions.
Figure 3
Figure 3
Cytokine secretion by hybrid spheroids during neural differentiation. Culture supernatants were collected and measured by enzyme-linked immunosorbent assay (ELISA) for different spheroids at day 21. Concentrations of (A) FGF2, (B) VEGF-A, (C) PGE2, and (D) TGF-β1. iNPC only indicates day 21 iNPC spheroids; MSC only indicates day 7 MSC spheroids. *Indicates p < 0.05 for the test conditions compared with the iNPC only control. # indicates p < 0.05 among the test conditions. $ indicates p < 0.005 for the test conditions compared with the MSC only control. One-way ANOVA for FGF2: P-value < 0.0001, F-value = 115.1; for VEGF-A: P-value < 0.0001, F-value = 126.2; for PGE2: P-value < 0.0001, F-value = 391.2; for TGF-β1: P-value = 0.0002, F-value = 12.3.
Figure 4
Figure 4
Neural and vascular marker expression of hybrid spheroids. Day 21 hybrid spheroids were replated for three days and immunocytochemistry was performed. (A) Representative fluorescent images of vascular markers, including CD31 (red)/Hoechst (blue) for endothelial cells, VE-cadherin (red)/Hoechst (blue) for later stage of endothelial cells, and ZO1 (green)/Hoechst (blue), the tight junction protein expressed by brain microvascular endothelial cells. (B) Representative fluorescent images of neural markers, including Nestin (green) for neural progenitors, HOXB4 (green) (a hindbrain marker), TBR1 (red) (forebrain deep cortical layer VI) and BRN2 (red) (forebrain cortical superficial layer II-IV). (C) Representative fluorescent images of MAP2 (green) (more mature neurons), GFAP (green) (astrocyte progenitors) and E-cadherin (green) (cell-cell interactions). The dashed lines indicate the locations of spheroids. The arrows point to the direction of spheroid locations. Hoechst: blue. Scale bar: 100 μm.
Figure 5
Figure 5
Histology images of early stage hybrid spheroids. (A) Images of histological sections of spheroids (total day 21) showed the expression of β-tubulin III (green) and vascular marker CD31 (red), ZO1 (green). Hoechst: blue. The dashed lines indicate the locations of spheroids. Some images show the lumen. Scale bar: 100 μm. (B) Confocal images of day 21 spheroids for FOXG1 (green) and CD31 (red). Arrows point to CD31+ lumen. Scale bar: 100 μm.
Figure 6
Figure 6
Quantification of neural and vascular markers by flow cytometry and histology images of late stage hybrid spheroids. Flow cytometry histograms for day 21 iEC spheroids, iNPC spheroids, or tri-cultured spheroids for (A) β-tubulin III; and (B) CD31. Black line: negative control; red line: marker of interest. The percentage indicates the positive cells versus total cells. (C) Flow cytometry quantification of β-tubulin III (β-tub III, n = 3) and (D) CD31 (n = 3). *Indicates p < 0.05 for the different test conditions. (E) Images of histological sections of late stage spheroids (total day 47) showed the expression of cortical layer markers: TBR1 (red)/SATB2 (green), BRN2 (red)/SATB2 (green). SATB2: cortical superficial layer II-IV. Hoechst: blue. The dashed lines indicate the locations of spheroids and the cortical layers. Scale bar: 100 μm. (F) Confocal images of histological sections of spheroids (total day 47) for β-tubulin III (green) and vascular marker CD31 (red). Scale bar: 50 μm.
Figure 7
Figure 7
RT-PCR analysis of gene expression of hybrid spheroids. mRNAs were isolated from day 21 hybrid spheroids for RT-PCR. Brain regional marker genes (contribution from iNPCs): (A) TBR1, (B) Nkx2.1; (C) HOXB4. Matrix remodeling and cell-cell communication genes (contribution from MSCs): (D) MMP2; (E) MMP3; (F) Notch-1. Blood-brain barrier-related genes (contributions from iECs): (G); GLUT-1; (H) BCRP; (I) PGP. *Indicates p < 0.05 for the test conditions compared with the iNPC only control. # indicates p < 0.05 among the test conditions.
Figure 8
Figure 8
Effects of AMD3100 treatment on the aggregation kinetics of hybrid spheroids. (A) Overlay of phase contrast images (iNPCs) with fluorescent images (hMSCs labeled with CellTracker Green, iECs labeled with CellTracker Red) of different hybrid spheroids were either (Ai) untreated (control) or (Aii) treated with CXCR4 inhibitor (AMD3100). Scale bar: 400 μm. (B) Analysis of aspect ratios, i.e., area of MSCs in fused spheroids over total area of fused spheroid, for groups either (Bi) untreated (control) or (Bii) treated with CXCR4 inhibitor (AMD3100). *Indicates p < 0.05 for the different test conditions.

References

    1. Yin X, et al. Engineering stem cell organoids. Cell Stem Cell. 2016;18:25–38. doi: 10.1016/j.stem.2015.12.005. - DOI - PMC - PubMed
    1. Qian X, et al. Brain-region-specific organoids using mini-bioreactors for modeling ZIKV exposure. Cell. 2016;165:1238–1254. doi: 10.1016/j.cell.2016.04.032. - DOI - PMC - PubMed
    1. Lancaster MA, et al. Cerebral organoids model human brain development and microcephaly. Nature. 2013;501:373–379. doi: 10.1038/nature12517. - DOI - PMC - PubMed
    1. Lancaster MA, Knoblich JA. Organogenesis in a dish: modeling development and disease using organoid technologies. Science. 2014;345:1247125. doi: 10.1126/science.1247125. - DOI - PubMed
    1. Pasca SP. The rise of three-dimensional human brain cultures. Nature. 2018;553:437–445. doi: 10.1038/nature25032. - DOI - PubMed

Publication types