. 2019 Apr 12;9(1):5988.
doi: 10.1038/s41598-019-42430-4.

Sperm physiology varies according to ultradian and infradian rhythms

Affiliations

Sperm physiology varies according to ultradian and infradian rhythms

Ayelén Moreno-Irusta et al. Sci Rep. .

Abstract

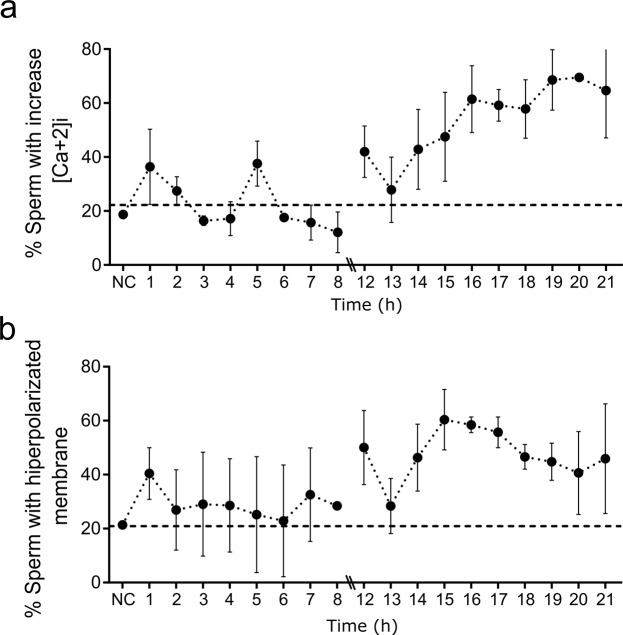
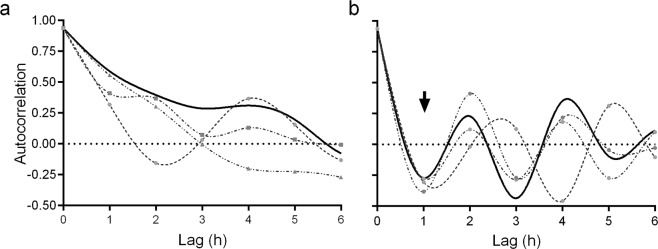
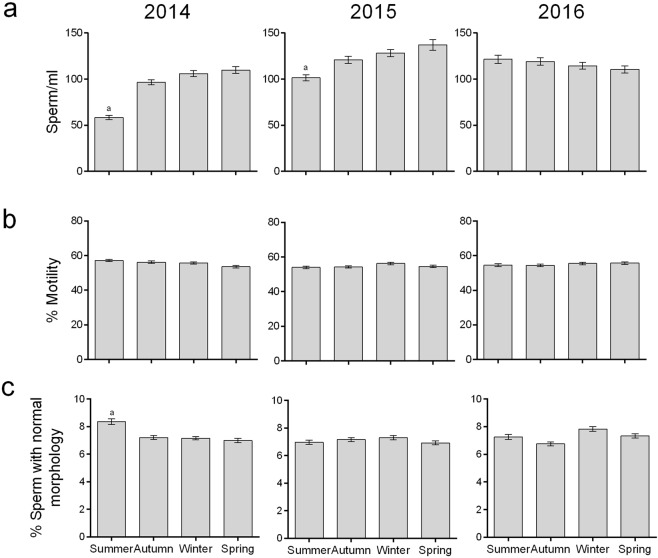
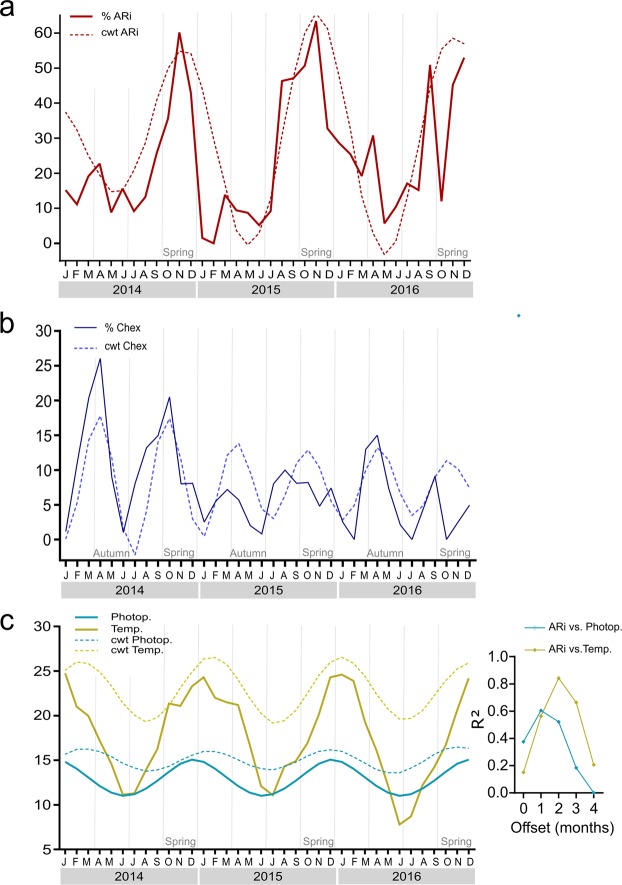
The spermatozoon must be physiologically prepared to fertilize the egg, process called capacitation. Human sperm samples are heterogeneous in their ability to capacitate themselves, which leads to variability between samples from the same or different donors, and even along the seasons. Here we studied sperm variation in the capacitation state according to the ability of capacitated spermatozoa to acrosome react upon stimulation (% ARi) and to be recruited by chemotaxis (% Chex). Both indirect indicators of sperm capacitation increased along the incubation time with fluctuations. Those capacitated sperm recruited by chemotaxis showed an ultradian rhythm with a cycle every 2 h, which might be influenced by unknown intrinsic sperm factors. Two infradian rhythms of 12 months for the % ARi and of 6 months for % Chex were observed, which are associated with the joint action of temperature and photoperiod. Thus, to avoid false negative results, human sperm samples are recommended to be incubated for a long period (e.g. 18 h) preferably in spring time. This innovative point of view would lead to better comprehend human reproductive biology and to think experimental designs in the light of sperm cyclicity or to improve sperm aptitude for clinical purposes.


Conflict of interest statement

A.M-I., J.M.K., E.M.D., A.M.V., M.N.G., R.M., C.L.T., M.J.F., A.B., N.A.P. and C.A.N.M. declare not competing interests. L.C.G. and H.A.G. are inventors of the SSA device, and the Consejo de Investigaciones Científicas y Ténicas and the Universidad Nacional de Córdoba are the owners of the patent.

Figures

Figure 1
Figure 1
Sperm physiology fluctuation along incubation time. Percentage of ARi spermatozoa (circles) and the percentage of spontaneous AR spermatozoa (triangles) during 24-hours incubation period under capacitating conditions (a). Percentage of Chex during 24-hours incubation period under capacitating conditions (b). Percentage of motile (black circles) and live (white triangles) spermatozoa, during 24 hours incubation under capacitating conditions (c). ARi, induced acrosome reaction; Chex, capacitated spermatozoa recruited by chemotaxis. Data are expressed as the mean ± SEM, of 8 independent samples.
Figure 2
Figure 2
Distribution of sperm samples according to the physiological state. Percentage of samples showing a defined range of % ARi (a) or % Chex (b), determined during incubation. The corresponding ranges of each parameter are shown in the upper right corner of each Figure. ARi, induced acrosome reaction; Chex, capacitated spermatozoa recruited by chemotaxis. Data include measurements of 9 independent experiments performed with ejaculates from different donors.
Figure 3
Figure 3
Sperm membrane potential and intracellular Ca+2 along incubation time. Percentage of spermatozoa showing an increase in: the intracellular calcium (a) and the hyperpolarized membrane (b). For the analysis, the percentage of spermatozoa exceeding the third quartile of fluorescence intensity was taken; the dotted line shows the percentage of spermatozoa that exceeds the third quartile in non-capacitated samples (NC). Data are expressed as the mean ± SEM of 8 independent experiments performed with ejaculates from different donors.
Figure 4
Figure 4
Verification of cyclicity in sperm physiology along incubation time. Autocorrelation analysis of time series of three representative samples (gray lines) and the average of all the samples (N = 7; black line) from data represented in Fig. 1, determined as: % ARi, (a) and % Chex (b) during 24-hours incubation period. Black arrow points to a negative autocorrelation value (average curve) that is followed by a positive one, indicating that overall at 1-hour intervals higher values are followed by lower values, while the lower are followed by larger values, indicating the existence of periodicity. ARi, induced acrosome reaction; Chex, capacitated spermatozoa recruited by chemotaxis.
Figure 5
Figure 5
Sperm concentration, motility and morphology values along a three-year period (2014–2016). Sperm concentration (a). Percentage of motile sperm (b). Percentage of spermatozoa with normal morphology (c). Data are expressed as the mean ± SEM of N ∼ 1400 samples per year. aStatistically significant differences vs all the other categories.
Figure 6
Figure 6
Infradian rhythms observed in sperm physiology after 18 h incubation and its relation to environmental factors. The time series of the % ARi sperm and the % Chex sperm are shown in panel (a,b), respectively, while photoperiod (light blue) and mean temperature (yellow) time series (continuous lines) are shown in panel (c). The corresponding Morlet Wavelet coefficients (cwt) at different monthly scale (dotted lines) are shown in each panel. Vertical gray lines indicate the change in season. Inset corresponds to the correlation coefficient (R2) obtained between Morlet Wavelet coefficient at a 12-month scale of % ARi and photoperiod (blue) or temperature (yellow), at different offsets. To improve visualization, Wavelet coefficients were offset by values of 30, 18, 15 and 10 for % ARi, temperature, photoperiod, and %Chex, respectively. Data are expressed as the mean of 3–4 independent experiments, for each month, performed with ejaculates from different donors. Temperature and photoperiod are shown as the mean of data from 36 consecutive months. ARi, induced acrosome reaction; Chex, capacitated spermatozoa recruited by chemotaxis; cwt, wavelet coefficents; Photop., photoperiod; Temp., temperature.
Figure 7
Figure 7
Autocorrelation analysis for sperm capacitation over a 3-year period. Autocorrelation analysis of the % ARi (a) or % Chex (b) spermatozoa incubated under capacitating conditions for 4 h (gray line) and 18 h (black line), and the average temperature (gray solid line) and photoperiod (dotted line) values (c). Time series used in this analysis are based on data from Fig. 6. Red and black dotted lines highlight the 6 and 12month cycle, respectively. ARi, induced acrosome reaction; Chex, capacitated spermatozoa recruited by chemotaxis.

References

    1. Barroso G, et al. Developmental sperm contributions: fertilization and beyond. Fertil. Steril. 2009;92:835–848. doi: 10.1016/j.fertnstert.2009.06.030. - DOI - PubMed
    1. CHANG M. C. Fertilizing Capacity of Spermatozoa deposited into the Fallopian Tubes. Nature. 1951;168(4277):697–698. doi: 10.1038/168697b0. - DOI - PubMed
    1. Austin, C. Observations on the Penetration of the Sperm into the Mammalian Egg. Australian journal of scientific research. Ser. B: Biological sciences4 (1951). - PubMed
    1. Zeng Y, Oberdorf JA, Florman HM. pH Regulation in Mouse Sperm: Identification of Na+-, Cl−-, and [formula] Dependent and Arylaminobenzoate-Dependent Regulatory Mechanisms and Characterization of Their Roles in Sperm Capacitation. Dev. Biol. 1996;173:510–520. doi: 10.1006/dbio.1996.0044. - DOI - PubMed
    1. Nakanishi T, Ikawa M, Yamada S, Toshimori K, Okabe M. Alkalinization of Acrosome Measured by GFP as a pH Indicator and Its Relation to Sperm Capacitation. Dev. Biol. 2001;237:222–231. doi: 10.1006/dbio.2001.0353. - DOI - PubMed

Publication types