. 2019 Apr 12;9(1):5981.
doi: 10.1038/s41598-019-42436-y.

Biomarkers of post-discharge mortality among children with complicated severe acute malnutrition

Affiliations

Biomarkers of post-discharge mortality among children with complicated severe acute malnutrition

James M Njunge et al. Sci Rep. .

Abstract

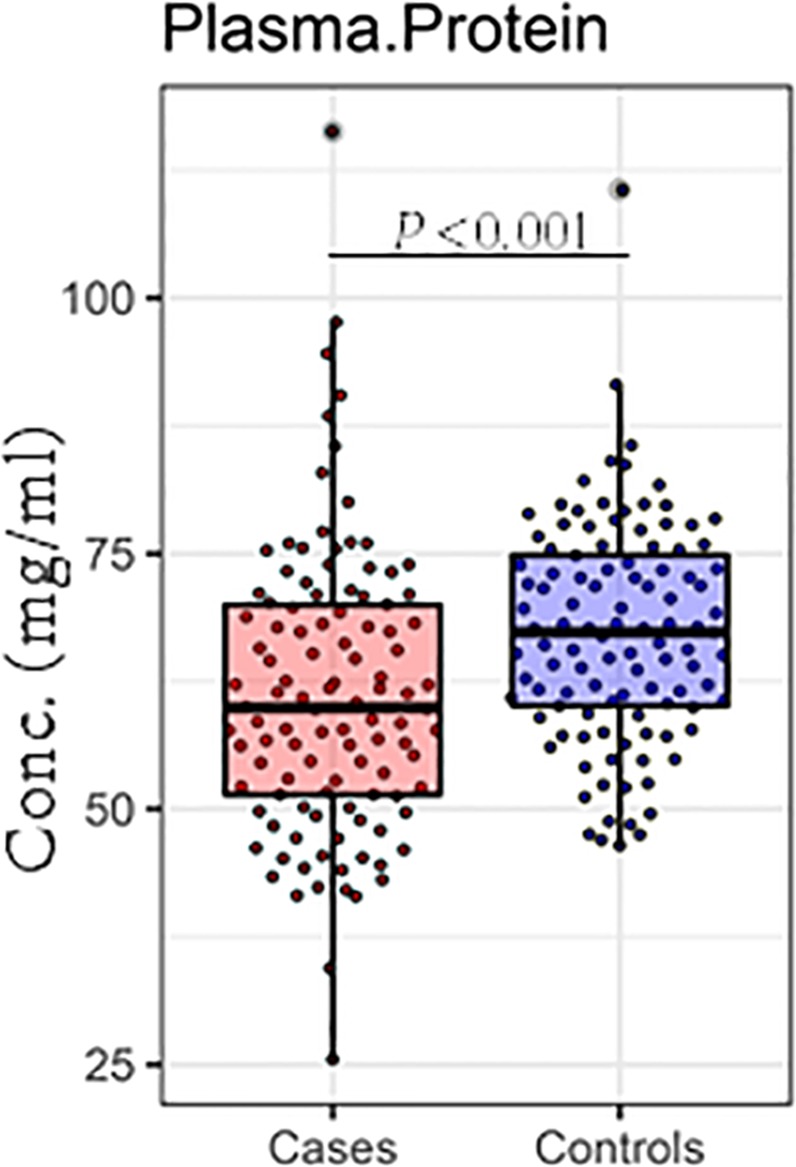
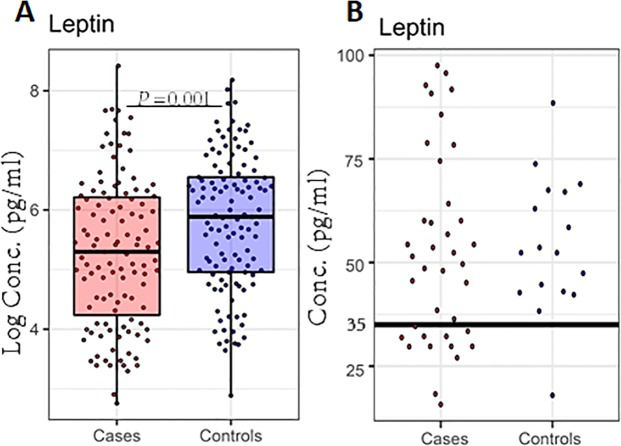
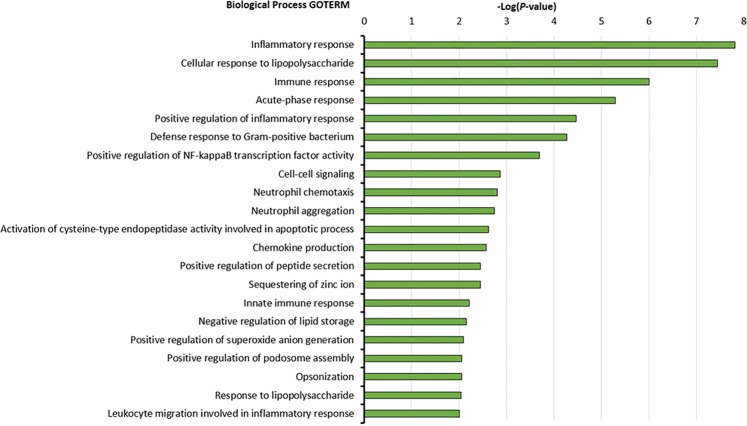
High mortality after discharge from hospital following acute illness has been observed among children with Severe Acute Malnutrition (SAM). However, mechanisms that may be amenable to intervention to reduce risk are unknown. We performed a nested case-control study among HIV-uninfected children aged 2-59 months treated for complicated SAM according to WHO recommendations at four Kenyan hospitals. Blood was drawn from 1778 children when clinically judged stable before discharge from hospital. Cases were children who died within 60 days. Controls were randomly selected children who survived for one year without readmission to hospital. Untargeted proteomics, total protein, cytokines and chemokines, and leptin were assayed in plasma and corresponding biological processes determined. Among 121 cases and 120 controls, increased levels of calprotectin, von Willebrand factor, angiotensinogen, IL8, IL15, IP10, TNFα, and decreased levels of leptin, heparin cofactor 2, and serum paraoxonase were associated with mortality after adjusting for possible confounders. Acute phase responses, cellular responses to lipopolysaccharide, neutrophil responses to bacteria, and endothelial responses were enriched among cases. Among apparently clinically stable children with SAM, a sepsis-like profile is associated with subsequent death. This may be due to ongoing bacterial infection, translocated bacterial products or deranged immune response during nutritional recovery.


Conflict of interest statement

The authors declare no competing interests.

Figures

Figure 1
Figure 1
Plasma total protein concentration is significantly different between cases (n = 119) and controls (n = 119). Box plot summarize the median and interquartile ranges of plasma total protein and P values < 0.05 are significant.
Figure 2
Figure 2
Systemic inflammatory proteins are increased among cases. (A) Bar plot of differentially expressed proteins from the mass spectrometry-based proteome analysis between cases (n = 121) and controls (n = 120). The analysis was performed using proteome measurements in plasma among cases and controls. The bar graph depicts the log10 of the fold change of differentially expressed proteins. Red and green bars indicate significantly up- and downregulated proteins among cases. (B) Box plot summaries of the median and interquartile ranges of natural logarithm concentrations of 5 cytokines that were significantly different between cases (n = 112) and controls (n = 113). Overlaid dots represent individual data points. GCSF, granulocyte-colony stimulating factor; IL8, interleukin 8; IL15, interleukin 15; IP10, Interferon gamma-induced protein 10 (IP-10)/chemokine (C-X-C motif) ligand 10; TNFA, tumour necrosis factor; P values represent the adjusted P value using the Benjamini and Hochberg (BH) method for multiple testing.
Figure 3
Figure 3
Pairwise correlation heatmap among differentially expressed proteins FDR < 0.05, MUAC, age, Protein, and leptin. MUAC, Mid upper arm circumference. Protein, Total plasma protein. 1 and −1 depicts the highest positive and negative correlation values respectively in the correlation matrix. Pairwise correlations highlighted in bold are P < 0.05 and those with bold and underlined are P < 0.001.
Figure 4
Figure 4
Leptin concentrations are significantly different between cases (n = 119) and controls (n = 119). (A) Box plot summary of the median and IQRs of natural logarithms of leptin concentrations. Overlaid dots represent individual data points. (B) Leptin concentration, showing only those <100 pg/ml among cases and controls. The dot plot depicts the 35 pg/ml leptin cut-off and dots represent the individual leptin data points <100 pg/ml. P < 0.05 are significant.
Figure 5
Figure 5
Enrichment analysis of upregulated proteins among cases. Biological processes associated with early post-discharge mortality in children with SAM based on Gene Ontology (GO) analysis. The analysis for pathways enriched was performed using the DAVID Bioinformatics Resources version 6.8. The Bar graphs depict the enriched GO process category and the −log10 of the P value. The P value depicts the probability that a particular biological process is enriched in a group of proteins relative to other biological processes.

References

    1. Black RE, et al. Maternal and child undernutrition and overweight in low-income and middle-income countries. Lancet. 2013;382(9890):427–451. doi: 10.1016/S0140-6736(13)60937-X. - DOI - PubMed
    1. Liu L, et al. Global, regional, and national causes of under-5 mortality in 2000–15: an updated systematic analysis with implications for the Sustainable Development Goals. Lancet. 2016;388(10063):3027–3035. doi: 10.1016/S0140-6736(16)31593-8. - DOI - PMC - PubMed
    1. Pelletier DL, et al. The effects of malnutrition on child mortality in developing countries. Bull World Health Organ. 1995;73(4):443–8. - PMC - PubMed
    1. Caulfield LE, et al. Undernutrition as an underlying cause of child deaths associated with diarrhea, pneumonia, malaria, and measles. Am J Clin Nutr. 2004;80(1):193–198. doi: 10.1093/ajcn/80.1.193. - DOI - PubMed
    1. Nair H, et al. Global and regional burden of hospital admissions for severe acute lower respiratory infections in young children in 2010: a systematic analysis. Lancet. 2013;381(9875):1380–1390. doi: 10.1016/S0140-6736(12)61901-1. - DOI - PMC - PubMed

Publication types