. 2019 Oct;56(10):7097-7112.
doi: 10.1007/s12035-019-1576-4. Epub 2019 Apr 13.

Higher Reliance on Glycolysis Limits Glycolytic Responsiveness in Degenerating Glaucomatous Optic Nerve

Affiliations

Higher Reliance on Glycolysis Limits Glycolytic Responsiveness in Degenerating Glaucomatous Optic Nerve

Assraa Hassan Jassim et al. Mol Neurobiol. 2019 Oct.

Abstract

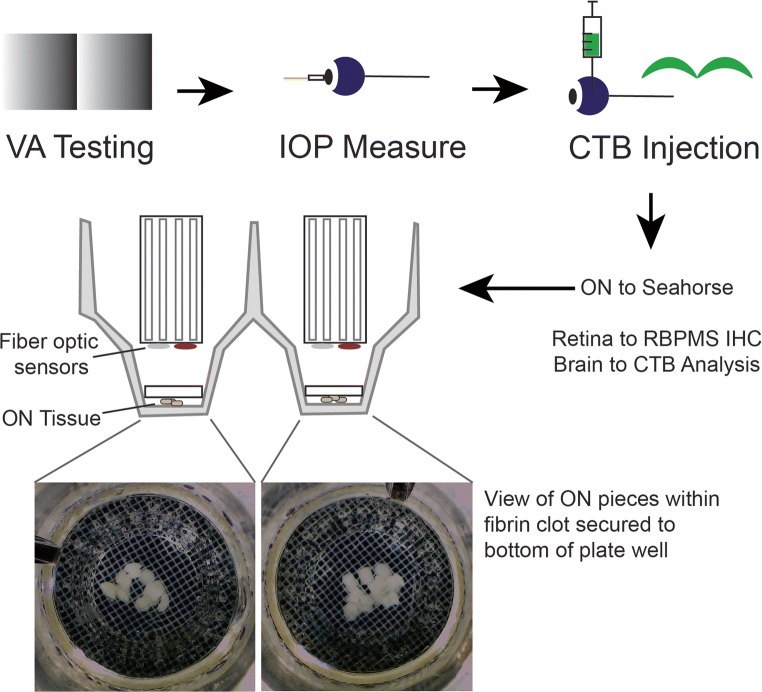
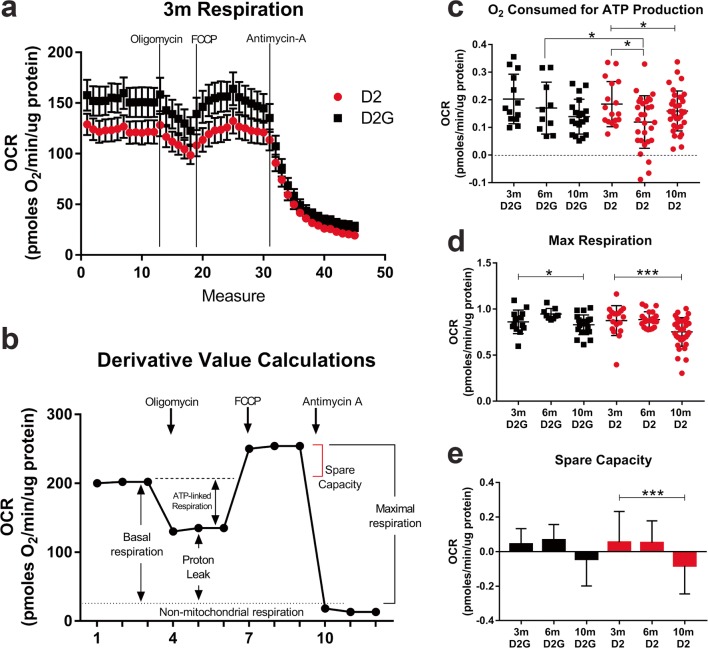
Metabolic dysfunction accompanies neurodegenerative disease and aging. An important step for therapeutic development is a more sophisticated understanding of the source of metabolic dysfunction, as well as to distinguish disease-associated changes from aging effects. We examined mitochondrial function in ex vivo aging and glaucomatous optic nerve using a novel approach, the Seahorse Analyzer. Optic nerves (ON) from the DBA/2J mouse model of glaucoma and the DBA/2-Gpnmb+ control strain were isolated, and oxygen consumption rate (OCR) and extracellular acidification rate (ECAR), the discharge of protons from lactate release or byproducts of substrate oxidation, were measured. The glial-specific aconitase inhibitor fluorocitrate was used to limit the contribution of glial mitochondria to OCR and ECAR. We observed significant decreases in maximal respiration, ATP production, and spare capacity with aging. In the presence of fluorocitrate, OCR was higher, with more ATP produced, in glaucoma compared to aged ON. However, glaucoma ON showed lower maximal respiration. In the presence of fluorocitrate and challenged with ATPase inhibition, glaucoma ON was incapable of further upregulation of glycolysis to compensate for the loss of oxidative phosphorylation. Inclusion of 2-deoxyglucose as a substrate during ATPase inhibition indicated a significantly higher proportion of ECAR was derived from TCA cycle substrate oxidation than glycolysis in glaucoma ON. These data indicate that glaucoma axons have limited ability to respond to increased energy demand given their lower maximal respiration and inability to upregulate glycolysis when challenged. The higher ATP output from axonal mitochondria in glaucoma optic nerve compensates for this lack of resiliency but is ultimately inadequate for continued function.

Keywords: DBA/2J; Fluorocitrate; Glaucoma; Mitochondria; Optic nerve; Seahorse analyzer.


Conflict of interest statement

The authors declare that they have no conflict of interest.

Figures

Fig. 1
Fig. 1
Experimental design. The initial, non-fluorocitrate experiments took place as shown, with mice first placed in the forced-choice swim task in order to establish their visual acuity. Mouse intraocular pressure (IOP) was measured, then mice received bilateral posterior chamber injections of cholera toxin-B conjugated to AlexaFluor-488 (CTB-488). Three days later, mice were sacrificed and optic nerves (ONs) were chopped, secured within a fibrin clot and inverted into a Seahorse Islet Capture plate for analysis. Retinas were dissected, fixed, and immunolabeled with RBPMS. Brains were fixed, sectioned, and analyzed for CTB-488 quantity in the superior colliculus (SC). See “Materials and Methods” for additional detail. The fluorocitrate experiments included IOP measurement and RGC immunolabeling, but did not include CTB-488 injection, nor visual acuity determination
Fig. 2
Fig. 2
DBA/2J retina and brain show degenerative changes by 10 months of age. a Intraocular pressure (IOP) measured in all 3-, 6-, and 10-month-old DBA/2J (D2) and DBA/2J-Gpnmb+ (D2G) indicates a significant IOP increase by ANOVA (Kruskal-Wallis H test, χ2(2) = 54.19, ****p < 0.0001) in the D2 mice from 3 to 10 months. There was no change in average IOP across the D2G mice. The increases from 3 to 6 months, and 6 to 10 months in the D2 were statistically significant (t test, p = 0.0091 and p < 0.0001, respectively). bd Outcome measures for mice in the non-fluorocitrate experiments. b Retinal ganglion cell (RGC) density in the D2 and D2G mice at 3, 6, and 10 months of age indicates significantly decreased RGC density in 6 month D2 versus D2G (t test, *p = 0.0482) and in 10-month D2 versus D2G (t test, ***p = 0.0005). The 10-month-old D2 retina also had significantly lower RGC density than 6-month-old D2 retina (t test, ****p < 0.0001). c Visual acuity of mice as spatial frequency threshold in cycles/degree shows a significant decline in visual acuity in the D2 mice from 3 to 10 months of age (ANOVA, F2,45 = 3.482, *p = 0.0393). There was a significant decline in the D2G mice from 3 to 6 months of age (t test, **p = 0.0039). The visual acuity was also significantly lower in the 10-month-old D2 versus D2G mice (t test, **p = 0.0091). d The percent area fraction of cholera toxin-B (CTB) fluorescent label in the superior colliculus (SC) showed a significant decline with aging and pathology in the D2 mice (ANOVA, F2,95 = 29.95, ****p < 0.0001). There was also a significant difference in CTB label in the 10-month-old D2 versus D2G mice (t test, ****p < 0.0001). e Photomicrographs of flatmount retina from 10-month-old D2G and D2 mice. Top panels show flatmount retina with white squares to identify the areas from which the high-magnification insets were drawn. Scale bar = 500 μm. Insets show RBPMS-positive RGCs (magenta) in corresponding flatmount retina. Scale bar = 50 μm. f Cross-sections of superior colliculus showing CTB labeling (green) in the retinorecipient portions of the superficial layers of D2G and D2 brain. Scale bar = 100 μm
Fig. 3
Fig. 3
Oxygen consumption rate (OCR) in D2 and D2G ON, normalized to amount of ON protein per well, used to calculate ATP production, maximal respiration, and spare capacity in ON. Media for these experiments contained 25 mM glucose, 4 mM glutamine, and 0.5 mM sodium pyruvate. a Mitochondrial respiration in the 3-month-old D2G ON (black squares), and the 3-month-old D2 ON (red circles). There were no statistical differences for OCR taken after oligomycin, FCCP, and antimycin A injections across strain within the 3, 6, and 10-month-old age groups; only the 3-month-old graphs are shown as example output. OCR is pmol O2/min/μg protein ± SEM for this graph only, to allow individual points to be visible. b Schematic showing the various calculated values for basal respiration (baseline), ATP-linked respiration (often referred to as ATP production), maximal respiration, and spare capacity, as derived from the oxygen consumption rate measured during a Seahorse Analyzer run. Arrows show the injection points for the oligomycin, the FCCP, and the antimycin A compounds that inhibit the F0F1-ATPase, uncouple the mitochondrial membrane potential from ATP production, and inhibit Complex III of the electron transport chain, respectively. c ATP production decreased significantly with age in the D2 ON (ANOVA, F2,78 = 3.632, *p = 0.031). ATP production was significantly lower in the 6-month-old D2 ON when compared to 3-month D2 (t test, *p = 0.0236) and the 6-month-old D2G ON (t test, *p = 0.032). ATP production did not vary across ages in the D2G mouse ON. d Maximal respiration in the D2 and D2G ON decreased significantly with aging (within strain for D2 Kruskal-Wallis H test, χ2(2) = 14.78, ***p = 0.0006; for D2G, ANOVA, F2,40 = 3.771, *p = 0.0316). e Spare capacity, the potential for acceleration of ATP production when necessary, was significantly decreased with aging in the D2 but not the D2G ON (within strain for D2 Kruskal-Wallis H test, χ2(2) = 16.8, ***p = 0.0002; for D2G Kruskal-Wallis H test, χ2(2) = 5.597, p = 0.0609)
Fig. 4
Fig. 4
Extracellular acidification rate (ECAR) normalized to protein per well in 3-, 6-, and 10-month-old D2 ON. a Baseline ECAR, normalized by amount of protein per well, was not statistically different in the D2 versus the D2G ON at 3 months of age (t test, p = 0.0564), but was significantly higher in the D2 ON versus the D2G at 6 months of age (t test, *p = 0.013). Baseline ECAR was significantly higher in the 10-month-old D2 ON compared to the D2G (t test, ***p = 0.0003). b ECAR measured in the presence of oligomycin was not significantly different in the D2 versus D2G ON at 3 months of age (t test, p = 0.1863), but was significantly higher in 6-month-old D2 compared to D2G ON (t test, *p = 0.0282). ECAR in the presence of oligomycin was significantly higher in the 10-month-old D2 compared to D2G ON (t test, **p = 0.0099). c The difference between ECAR at baseline and ECAR in the presence of oligomycin. d The ratio of OCR to ECAR in the ONs shows a significantly decreased ratio in the D2 ON (t test, ***p = 0.0006)
Fig. 5
Fig. 5
RGC density and mitochondrial respiration for mice used in the fluorocitrate experiments. Media for these experiments contained 2 mM glucose that increased to 8 mM at the oligomycin step, 4 mM glutamine, and 0.5 mM sodium pyruvate. a. RGC density in 3-, 6-, and 10-month-old D2 and D2G mouse retina decreased significantly with age in the D2 retina (ANOVA, F2,42 = 15.96, ****p < 0.0001). The 10-month-old D2 retinas had significantly lower RGC density than age-matched D2G retinas (t test, ***p = 0.0006). b Baseline oxygen consumption rate (OCR), normalized to protein per well, in the 10-month-old D2G and D2 ON. There was no statistical difference across strain. c OCR in 10-month-old D2 and D2G ON with fluorocitrate (FC) treatment indicates significantly higher baseline OCR in the D2 (t test, *p = 0.0445). Data are normalized to the OCR with FC treatment and expressed as percent of FC OCR. d OCR in 10-month-old D2 and D2G ON in the presence of FC and oligomycin shows significantly lower OCR in the D2 ON compared to the D2G (t test, *p = 0.034). e ATP production (the difference between oligomycin and FC baseline OCR) is significantly higher in the D2 ON at 10 months of age (t test, *p = 0.027). f OCR with FCCP treatment in the presence of FC is significantly lower in the D2 compared to D2G ON at 6 months of age (t test, **p = 0.0057). g OCR after treatment with FCCP, in the presence of FC, shows significantly lower OCR in 10-month D2 ON compared to D2G (t test, *p = 0.028). h The fraction of basal respiration driving ATP synthesis, or coupling efficiency, is significantly higher in the 10-month D2 ON (t test, **p = 0.003)
Fig. 6
Fig. 6
ECAR in D2 and D2G ON in the presence of FC. a Baseline ECAR is significantly higher in the 10-month-old D2 ON compared to the D2G, prior to FC (t test, **p = 0.0012). b ECAR with oligomycin treatment is significantly lower in the 10-month-old D2 ON compared to the D2G (t test, **p = 0.0011); ECAR from D2 ON with 2-deoxyglucose (2-DG) is significantly lower than D2 ON in glucose (t test, ***p = 0.0003); and ECAR for D2G ON with 2-DG is significantly lower than D2G ON in glucose (t test, **p = 0.0079). c The ratio of OCR to ECAR in the 10-month-old ONs shows the D2 has significantly lower ratio than the D2G (t test, **p = 0.0042)

References

    1. MacVicar BA, Newman EA. Astrocyte regulation of blood flow in the brain. Cold Spring Harb Perspect Biol. 2015;7:1–15. doi: 10.1101/cshperspect.a020388. - DOI - PMC - PubMed
    1. Inman DM, Harun-Or-Rashid M (2017) Metabolic vulnerability in the neurodegenerative disease glaucoma. Front Neurosci 11:. 10.3389/fnins.2017.00146 - PMC - PubMed
    1. Harun-or-Rashid M, Pappenhagen N, Wilson GN, et al. Structural and functional rescue of chronic metabolically stressed optic nerves through respiration. J Neurosci. 2018;38:5122–5139. doi: 10.1523/JNEUROSCI.3652-17.2018. - DOI - PMC - PubMed
    1. Simpson IA, Carruthers A, Vannucci SJ. Supply and demand in cerebral energy metabolism: the role of nutrient transpoters. J Cereb Blood Flow Metab. 2007;27:1766–1791. doi: 10.1038/sj.jcbfm.9600521. - DOI - PMC - PubMed
    1. Libby RT, Anderson MG, I-HH P, et al. Inherited glaucoma in DBA/2J mice: pertinent disease features for studying the neurodegeneration. Vis Neurosci. 2005;22:637–648. doi: 10.1017/S0952523805225130. - DOI - PubMed

LinkOut - more resources