. 2019 Apr 26:14:210-225.
doi: 10.1016/j.isci.2019.03.030. Epub 2019 Mar 29.

Vitamin K2-Dependent GGCX and MGP Are Required for Homeostatic Calcium Regulation of Sperm Maturation

Affiliations

Vitamin K2-Dependent GGCX and MGP Are Required for Homeostatic Calcium Regulation of Sperm Maturation

He Ma et al. iScience. .

Abstract

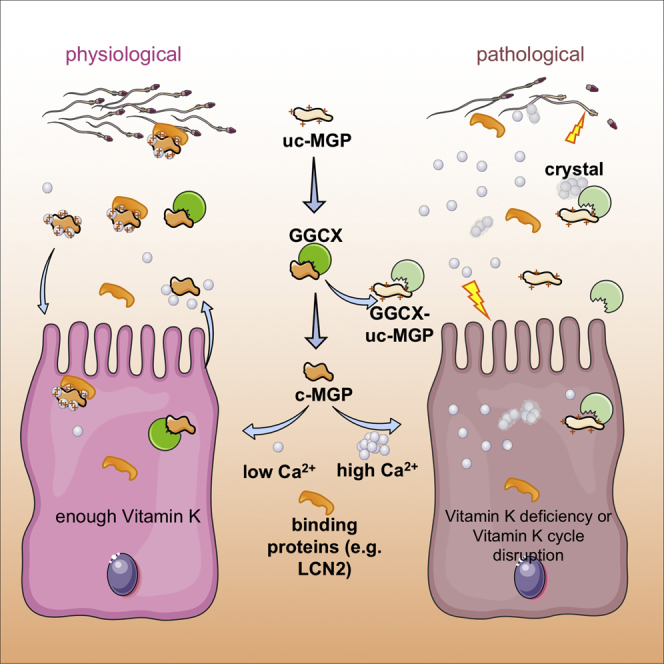
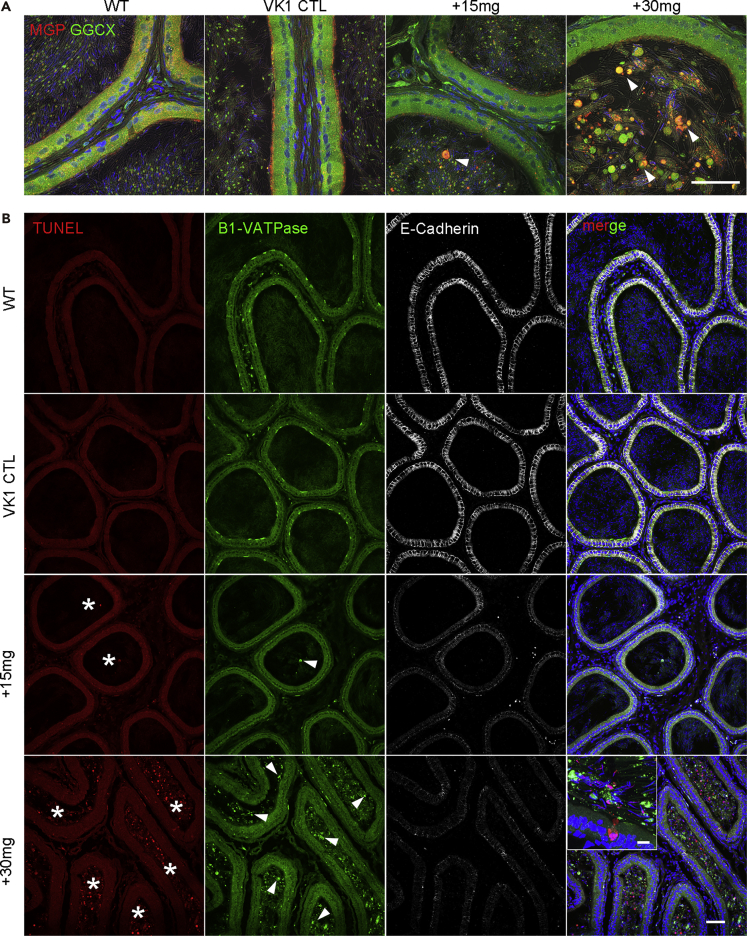
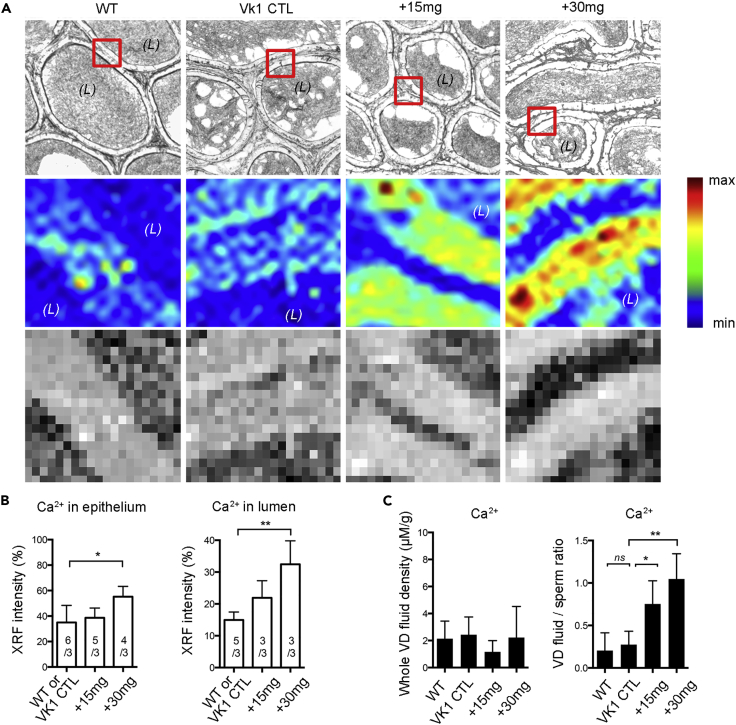
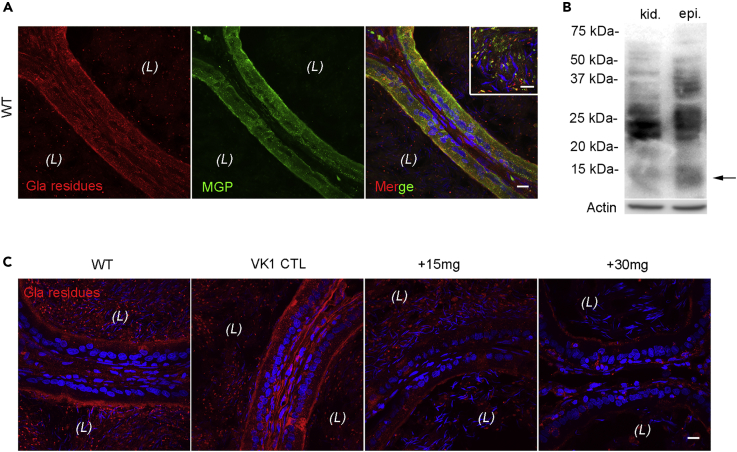
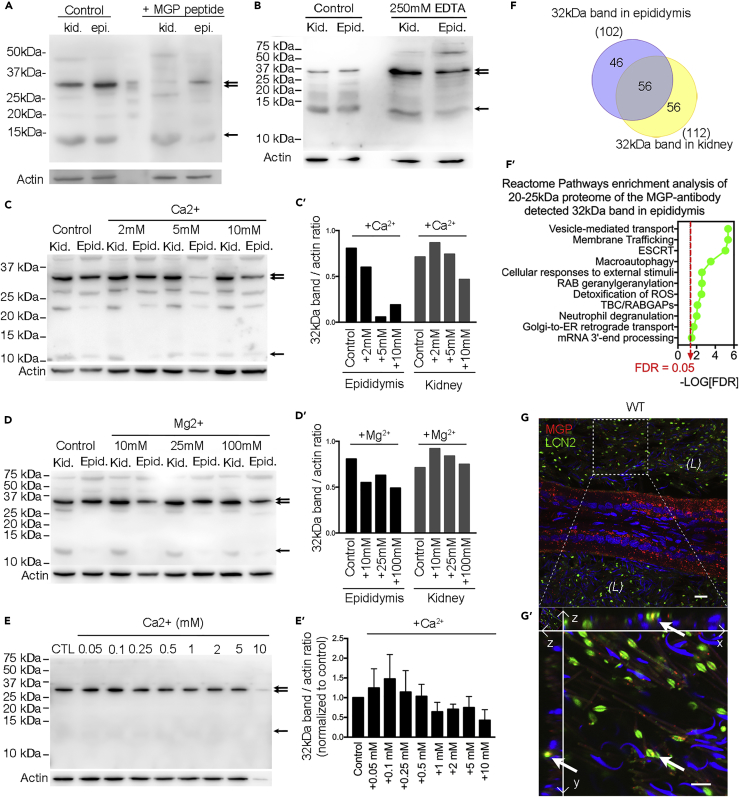
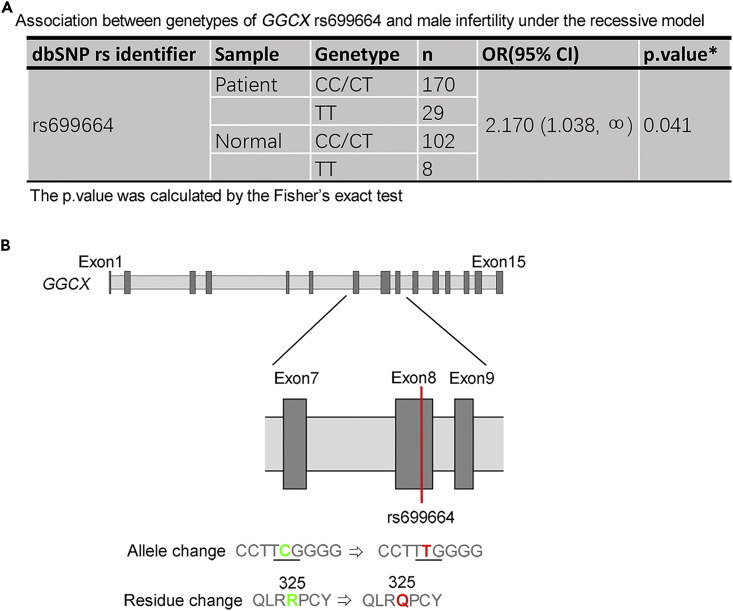
A low-calcium microenvironment is essential for spermatozoa to mature in the epididymis; however, it remains unclear how dysregulation of epididymal luminal calcium is associated with male infertility. Using a warfarin-induced vitamin K2 deficiency rat model, we found that vitamin-K-dependent γ-glutamyl carboxylase (GGCX) and matrix Gla protein (MGP) were essential in extracellular calcium signaling of the intercellular communication required for epididymal sperm maturation. We found that GGCX and MGP co-localized in the vesicular structures of epididymal cells and spermatozoa. Calcium-regulated MGP binds to proteins in a biphasic manner; sub-millimolar calcium enhances, whereas excessive calcium inhibits, the binding. Bioinformatic analysis of the calcium-dependent MGP-bound proteome revealed that vesicle-mediated transport and membrane trafficking underlie the intercellular communication networks. We also identified an SNP mutation, rs699664, in the GGCX gene of infertile men with asthenozoospermia. Overall, we revealed that the GGCX-MGP system is integrated with the intercellular calcium signaling to promote sperm maturation.

Keywords: Cell Biology; Developmental Biology; Specialized Functions of Cells.


Figures

None
Graphical abstract
Figure 1
Figure 1
The Expression Patterns of Vitamin K Cycle-Associated Proteins in Rats (A) qPCR of GGCX, MGP, VKORC1, and VKORC1L1 mRNA in different tissues of adult WT rats. (B) GGCX and MGP mRNA in the key postnatal stages (days 6–10 and weeks 3–12) of the rat epididymis. Results are means (±SD) of three rats in panels A and B. (C) Immunoblot of GGCX and MGP proteins in the tissue lysates of the epididymis and kidney from WT rats. Arrows indicate the bands of expected size of GGCX (∼88 kDa) and MGP (∼12 kDa). Actin serves as the loading control. Note the additional band detected at ∼32 kDa by MGP antibody larger than its expected size, a characteristic of MGP-mediated calcium-dependent complex aggregation as described in this study. (D and E) Immunolabeling of GGCX (D, red) and MGP (E, red) proteins in cryosections of the WT adult rat epididymis. CD, cauda epididymidis; CPS, corpus; CPT, caput; IS, initial segment. Clear cells are labeled for B1-VATPase in green. Nuclei and spermatozoa heads are labeled with DAPI in blue. (L), lumen. Scale bars, 20 μm. (F) Higher magnification showing GGCX immunolabeling in the granular organelles of principal cells. Arrows: apical stereocilia or principal cells; asterisks: the cytoplasmic droplets of spermatozoa. (G) Higher magnification showing the MGP-labeled vesicular structures (double arrows) at the head of spermatozoa near the apical domain of principal cells. Scale bars,10 μm in F and G.
Figure 2
Figure 2
Co-localization of MGP and GGCX Proteins in Vesicular Structures of Epithelial Cells and Spermatozoa in the Epididymis (A) Representative projections of stacks of serial confocal images showing the double-immunofluorescence labeling of MGP (red) and GGCX (green) in the different regions of the rat epididymis. CD, cauda epididymidis; CPS, corpus; CPT, caput; IS, initial segment. (L) lumen; (I) interstitial tissue. Scale bar, 20 μm. (B) Three-dimensional reconstruction and orthogonal views (xy, xz, yz) of higher magnification of stacks of confocal images demonstrating the co-localization of MGP and GGCX (yellow) in both intracellular and extracellular vesicular structures of epithelial cells (arrows) and cytoplasmic droplets (double arrows) of spermatozoa in the lumen of CPS and CD. Long arrows indicate the xy, xz, and yz dimensions. DAPI (blue) was used to visualize nuclei and sperm heads. (L), lumen. Scale bars, 10 μm.
Figure 3
Figure 3
Functional Analysis of Warfarin-Treated Rat Epididymal Sperm and Male Fertility (A–C) Body weights (A), organ-to-body weight ratios for the testes, epididymis, kidneys, and spleens (B) as well as the litter size (C) of rats from +15mg and +30mg warfarin-treated groups versus WT and VK1 supplemented control groups. (D) CASA quantification of the concentration of motile caput and cauda spermatozoa. (E–H) The percentage of motile (E) and progressive (F) sperm and the comparison of VSL (G) and VAP (H) parameters of cauda sperm from warfarin-treated and control rats. (I) Images of caput and cauda sperm during CASA experiments. Note the numerous granular vesicles in the contents of cauda epididymidis of the warfarin-treated rats but not in the controls nor the caput contents. (J) Percentage of defective cauda sperm from warfarin-treated rats versus controls. (K) H&E staining showing gross anatomy of epididymis of each group. Arrowheads indicate the detached epithelial cells in the lumen. (L) Immunofluorescent labeling showing the reduced F-actin in the smooth muscle layer (arrows) in the basal compartment of warfarin-treated epididymis. (M) Immunolabeling of γ-H2AX (red) in testicular sections showing normal spermatogenesis in the testes of each group. Nuclei are labeled in blue with DAPI. Scale bars, 50 μm. Bar graph data herein and in subsequent figures show the means (±SD) of at least three rats or trials; ns: no significant difference; *p < 0.05, **p < 0.01, ***p < 0.001, ****p < 0.0001.
Figure 4
Figure 4
Warfarin-Treated Rats Show Microenvironment Disorders and Apoptotic Epididymal Epithelial Cells (A) Confocal projection and superimposed differential interference contrast images of CPS cryosections double immunolabeling for MGP (red) and GGCX (green) of rats under wild-type, VK1 control, +15 mg, and +30 mg warfarin conditions. Arrowheads indicate the shedding of epithelial cells and larger vesicles into the lumen of warfarin-treated epididymides. (B) Triple-fluorescent labeling for TUNEL (red), clear cell marker B1-VATPase (green) and epithelial cell marker E-Cadherin (white) of epididymal cryosections of the different groups. Note the reduced signals of B1-VATPase and E-cadherin in the epithelium of +15 mg and +30 mg warfarin-treated groups in a dosage-dependent manner. There are numerous TUNEL-positive cells (asterisks) and some B1-VATPase positive cells (arrowheads) in the lumen, particularly in the +30 mg group. Inset: higher magnification image showing the +30 mg treated epididymis. Scale bars, 50 μm in A and B, 10 μm in the inset.
Figure 5
Figure 5
Synchrotron-Based Elemental XRF Imaging and ICP-MS Analysis Revealed Calcium Homeostatic Dysregulation in the Epididymis after Warfarin Administration to Rats (A and B) (A) Light microscopical images arranged in the first row, the boxes indicate the selected regions for XRF analysis in the unstained sections. The second row are XRF elemental maps in the epididymis corpus region of different groups. The elemental maps of Ca2+ were acquired using XFM beamline. The third row presents the relative quantitative concentration of Ca2+ in the regions and summarized in histograms as in panel B. (L), lumen. (C) ICP-MS analysis of relative Ca2+ density in whole VD fluid and the ratio of Ca2+ density within sperm-free VD fluid versus spermatozoa.
Figure 6
Figure 6
Decreased Protein Carboxylation in the Epididymis of Warfarin-Treated Rats (A) Double immunolabeling with antibodies against Gla-residue-containing proteins (red) and MGP (green) in CPS epididymides showing the similar cellular localization of Gla residues and MGP. Enriched co-localization (yellow) of Gla-residue-containing proteins and MGP in the apical pole of principal cells and luminal vesicular contents (inset). (B) Immunoblot of Gla-residue-containing proteins in rat epididymal and kidney lysates. Arrow indicates the expected size of MGP at ∼12 kDa. Actin: loading control. (C) Immunolabeling of Gla-residue-containing proteins (red) in CPS epididymides of rats from warfarin-treated and control groups. Blue: DAPI labeling for nuclei. (L), lumen. Scale bars, 20 μm in A and C, 10 μm in the inset.
Figure 7
Figure 7
VKD Protein MGP-Mediated Biphasic Calcium-Dependent Complex Aggregation and Binding Target Identification (A) Western blot detection of MGP in total homogenates of kidney and epididymis from WT rats. A band at ∼12 kDa (arrow), corresponding to the molecular weight of MGP, and another band at ∼32 kDa (double arrow), ∼20 kDa larger than MGP, were detected. Both bands were almost abolished by the preincubation with a 10-fold excess of the immunizing peptide of MGP (+MPG peptide) compared with controls. (B) The ∼32 kDa MGP-antibody-detected protein bands (double arrow) were significantly enriched in the presence of 250 mM EDTA compared with controls, whereas the 12 kDa bands remained unchanged (arrow). (C–D′) (C and D) Western blot showing the ∼32 kDa bands in the presence of 2–10 mM Ca2+ or 10 to 100 mM Mg2+. (C′ and D′) Bar graph showing 32 kDa band/actin intensity ratio in the presence of ions as indicated. (E and E′) (E) Western blot of proteins lysates from DC2 cells in the presence of various calcium concentrations and (E′) the summary of the biphasic effect of externally added calcium on the MGP-detected 32 KDa band intensity. (F and F′) (F) Venn diagram of proteins of molecular size 20–25 kDa detected in the 32 kDa band of the epididymal and kidney lysates analyzed by in-gel digestion and LC-MS/MS. (F′) Reactome pathways enrichments analysis of the candidate proteome of epididymis as in panel F. FDR, false discovery rate. (G and G′) (G) Double immunolabeling of MGP (red) and one of 20 kDa proteins detected in the epididymal ∼32 kDa band, LCN2 (green), in the WT rat corpus epididymidis. (G′) Orthogonal views of high-magnification image showing the predominant colocalization (arrows) of MGP and LCN2 in cytoplasmic droplets of spermatozoa in the lumen. Nuclei and heads of spermatozoa are labeled blue with DAPI. Scale bar, 10 μm.
Figure 8
Figure 8
GGCX Gene Mutations in Infertile Male Patients with Asthenozoospermia (A) The association between genotypes of GGCX rs699664 and male infertility was assessed in 199 infertile patients with asthenozoospermia and 110 fertile controls under the recessive model. In this the GGCX rs699664 is assumed allele T recessive and a one-sided p < 0.05 was considered to be significant. (B) The location of rs699664 is on the eighth exon of GGCX gene with the single nucleotide variation from C (green) to T (red), which results in a residue change from arginine325 (R, green) to glutamine325 (Q, red).

References

    1. Balercia G., Moretti S., Vignini A., Magagnini M., Mantero F., Boscaro M., Ricciardo-Lamonica G., Mazzanti L. Role of nitric oxide concentrations on human sperm motility. J. Androl. 2004;25:245–249. - PubMed
    1. Braun R.E. Post-transcriptional control of gene expression during spermatogenesis. Semin. Cell Dev. Biol. 1998;9:483–489. - PubMed
    1. Breton S., Smith P.J., Lui B., Brown D. Acidification of the male reproductive tract by a proton pumping (H+)-ATPase. Nat. Med. 1996;2:470–472. - PubMed
    1. Chen Q., Yan M.H., Cao Z.H., Li X., Zhang Y.F., Shi J.C., Feng G.H., Peng H.Y., Zhang X.D., Zhang Y. Sperm tsRNAs contribute to intergenerational inheritance of an acquired metabolic disorder. Science. 2016;351:397–400. - PubMed
    1. Chen Q., Yan W., Duan E.K. Epigenetic inheritance of acquired traits through sperm RNAs and sperm RNA modifications. Nat. Rev. Genet. 2016;17:733–743. - PMC - PubMed

LinkOut - more resources