. 2019 Aug 1:196:161-172.
doi: 10.1016/j.neuroimage.2019.04.034. Epub 2019 Apr 11.

Functional resting-state brain connectivity is accompanied by dynamic correlations of application-dependent [18F]FDG PET-tracer fluctuations

Affiliations

Functional resting-state brain connectivity is accompanied by dynamic correlations of application-dependent [18F]FDG PET-tracer fluctuations

Mario Amend et al. Neuroimage. .

Abstract

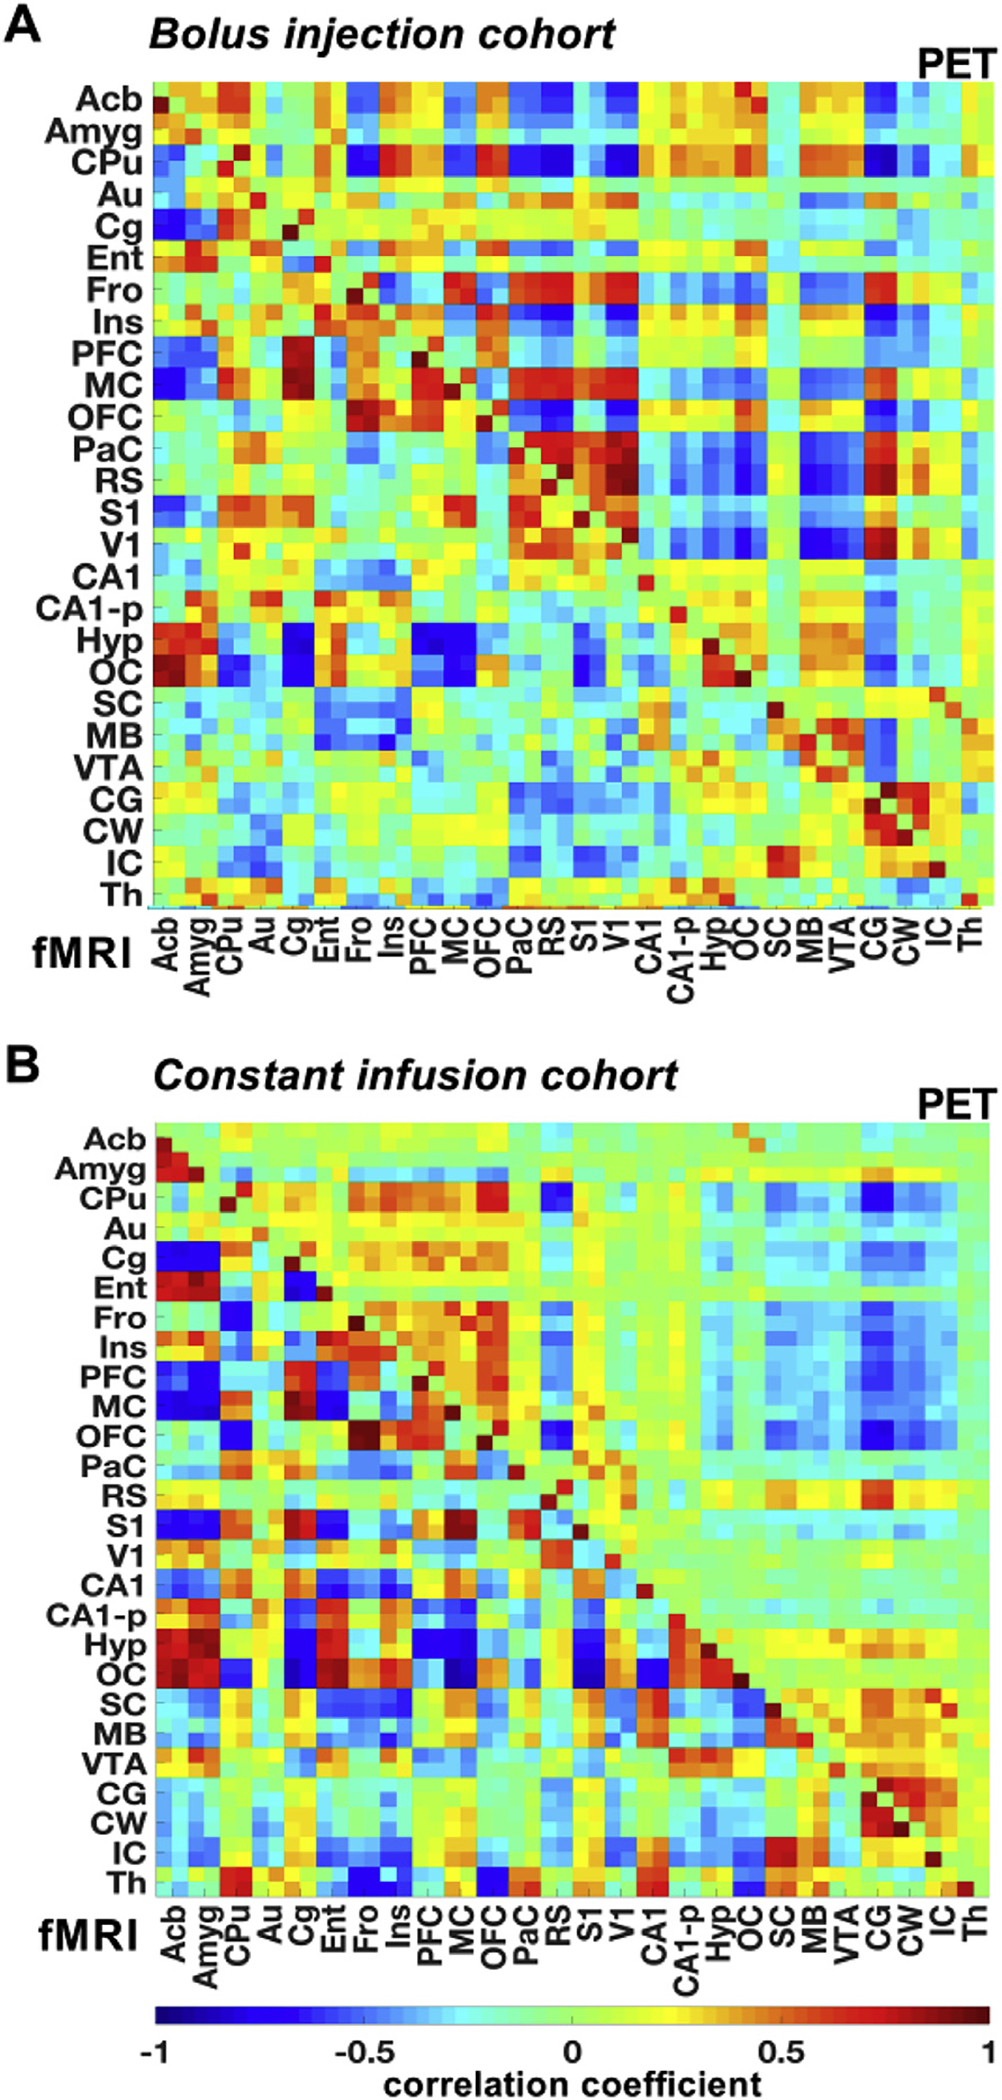
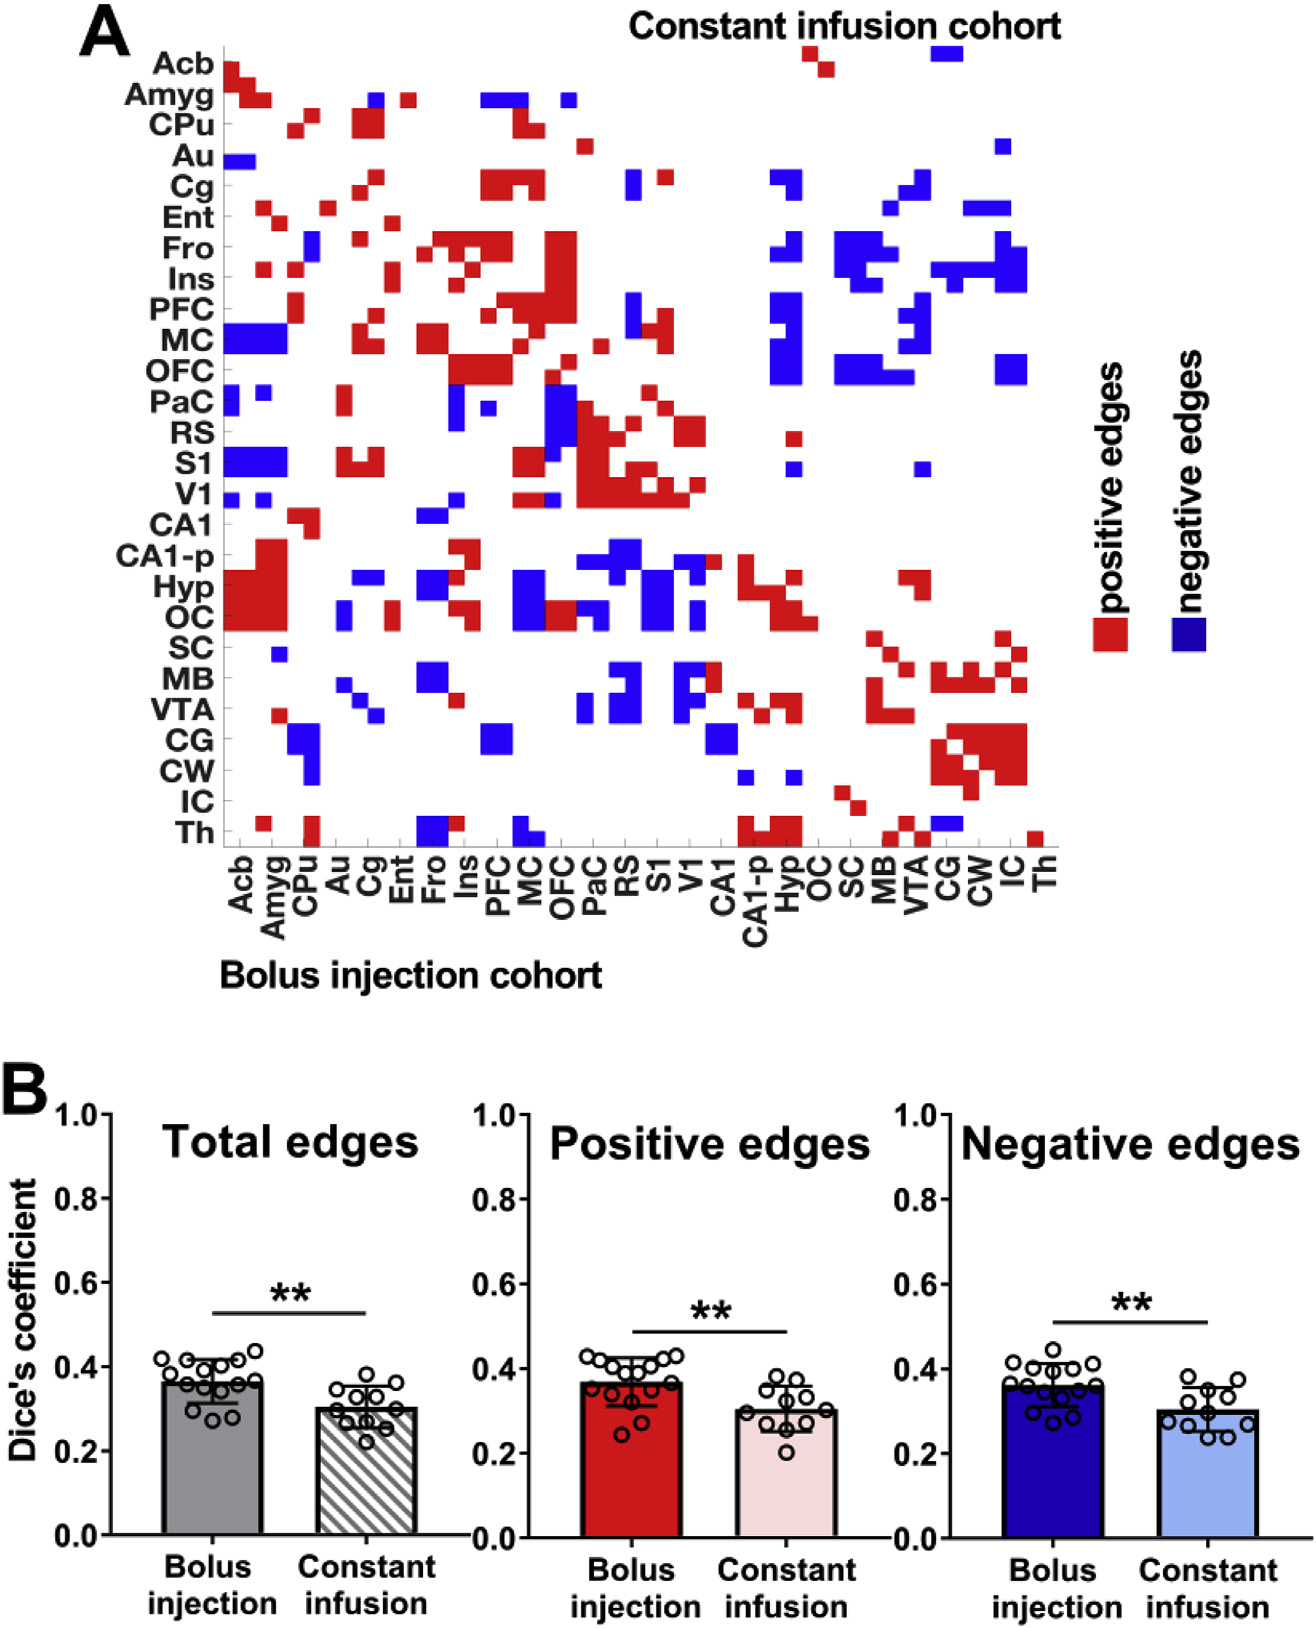
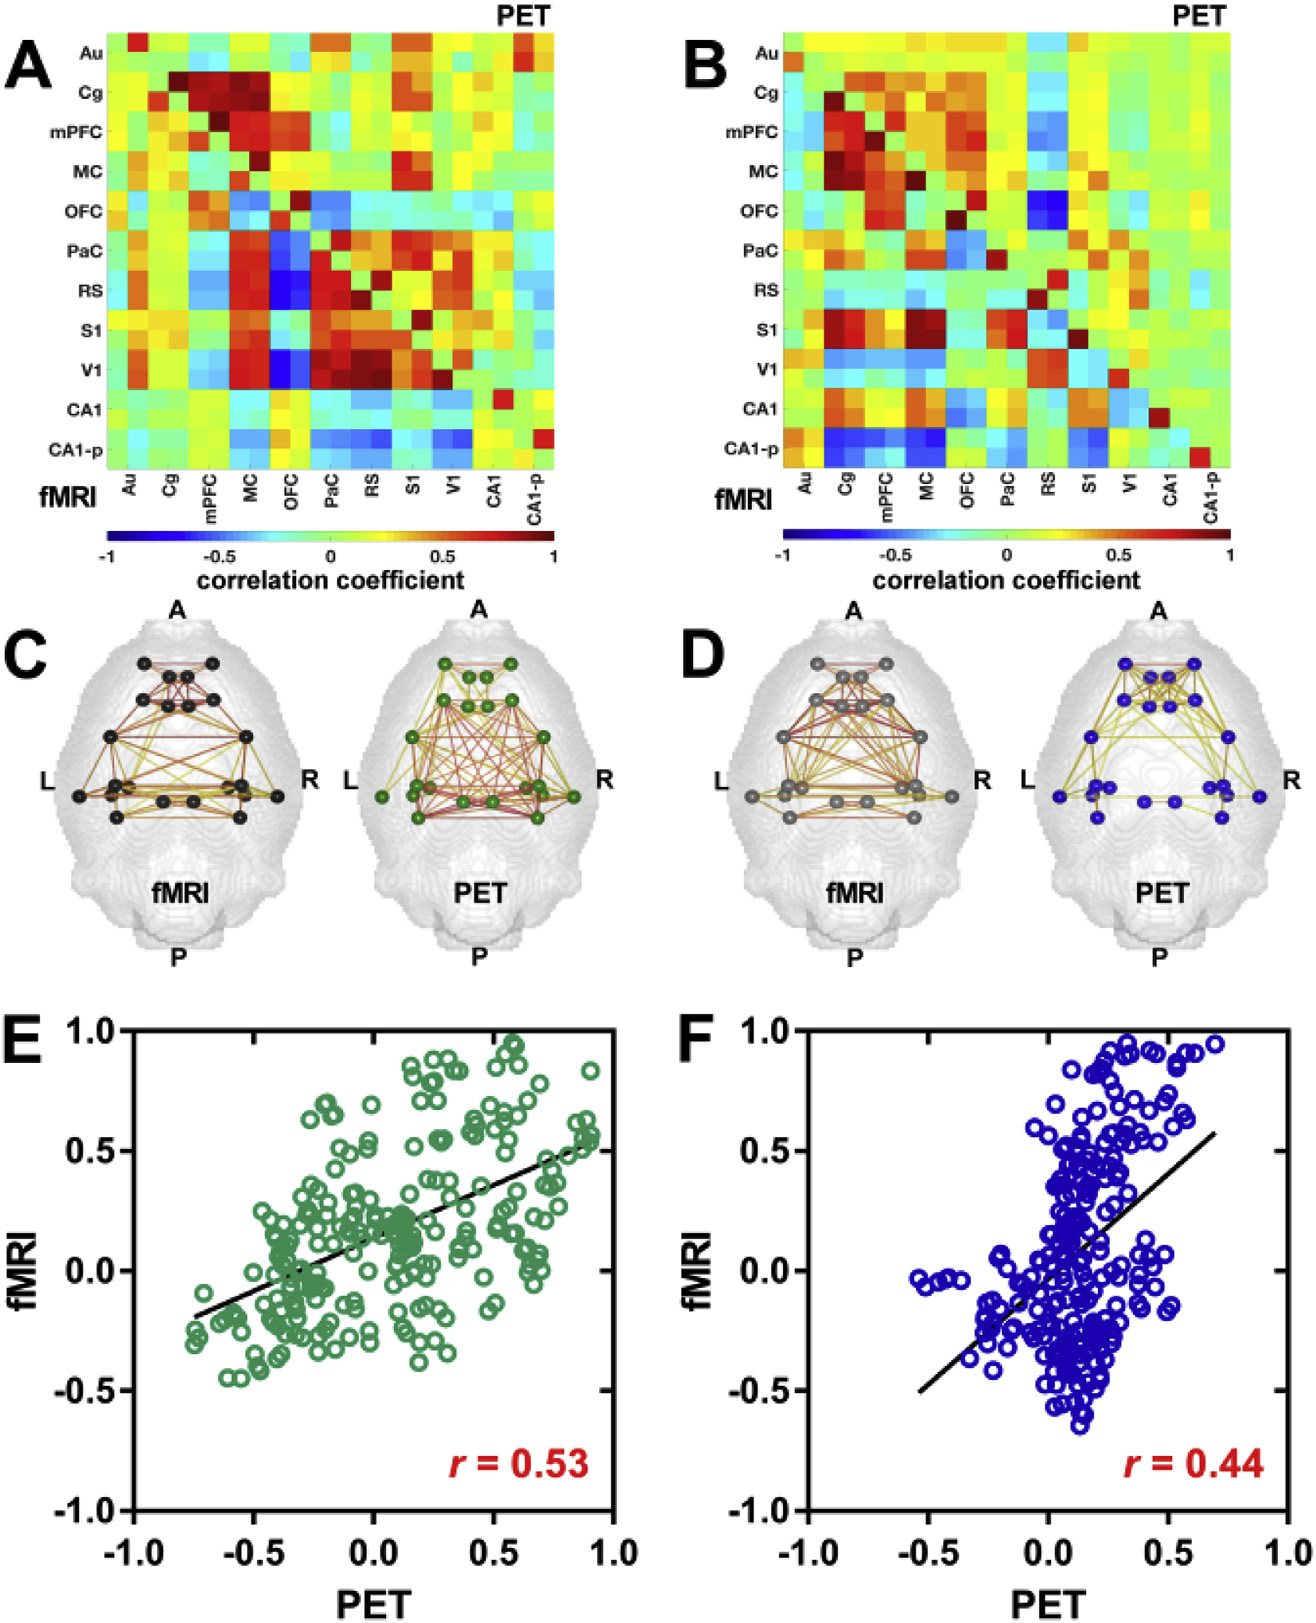
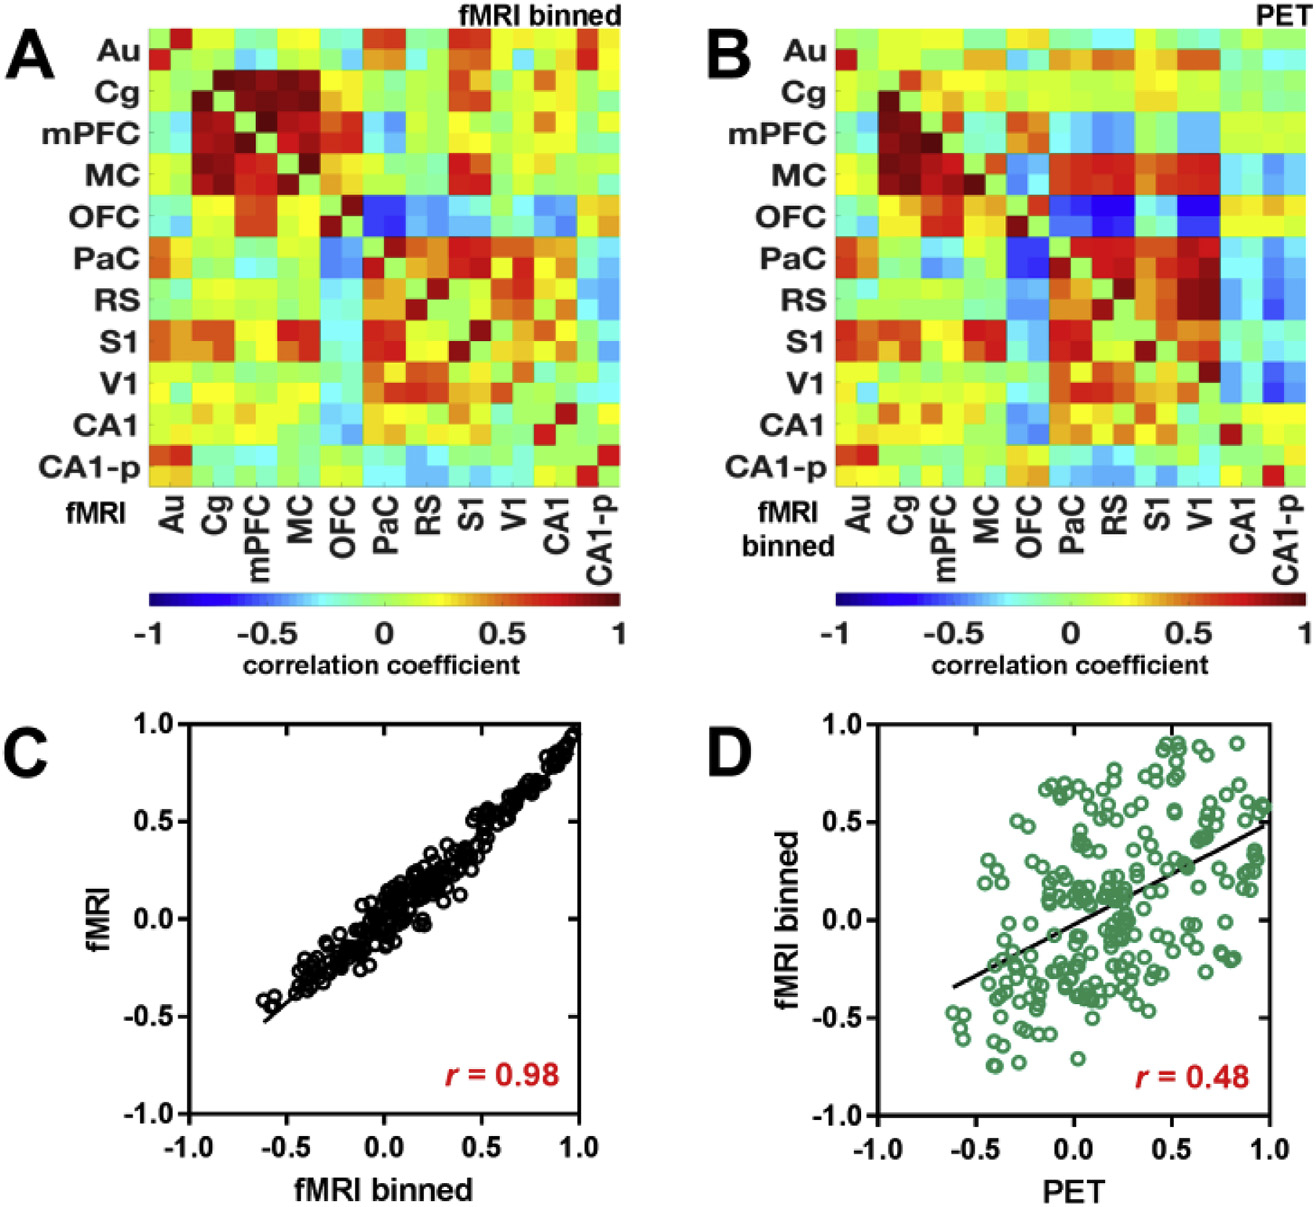
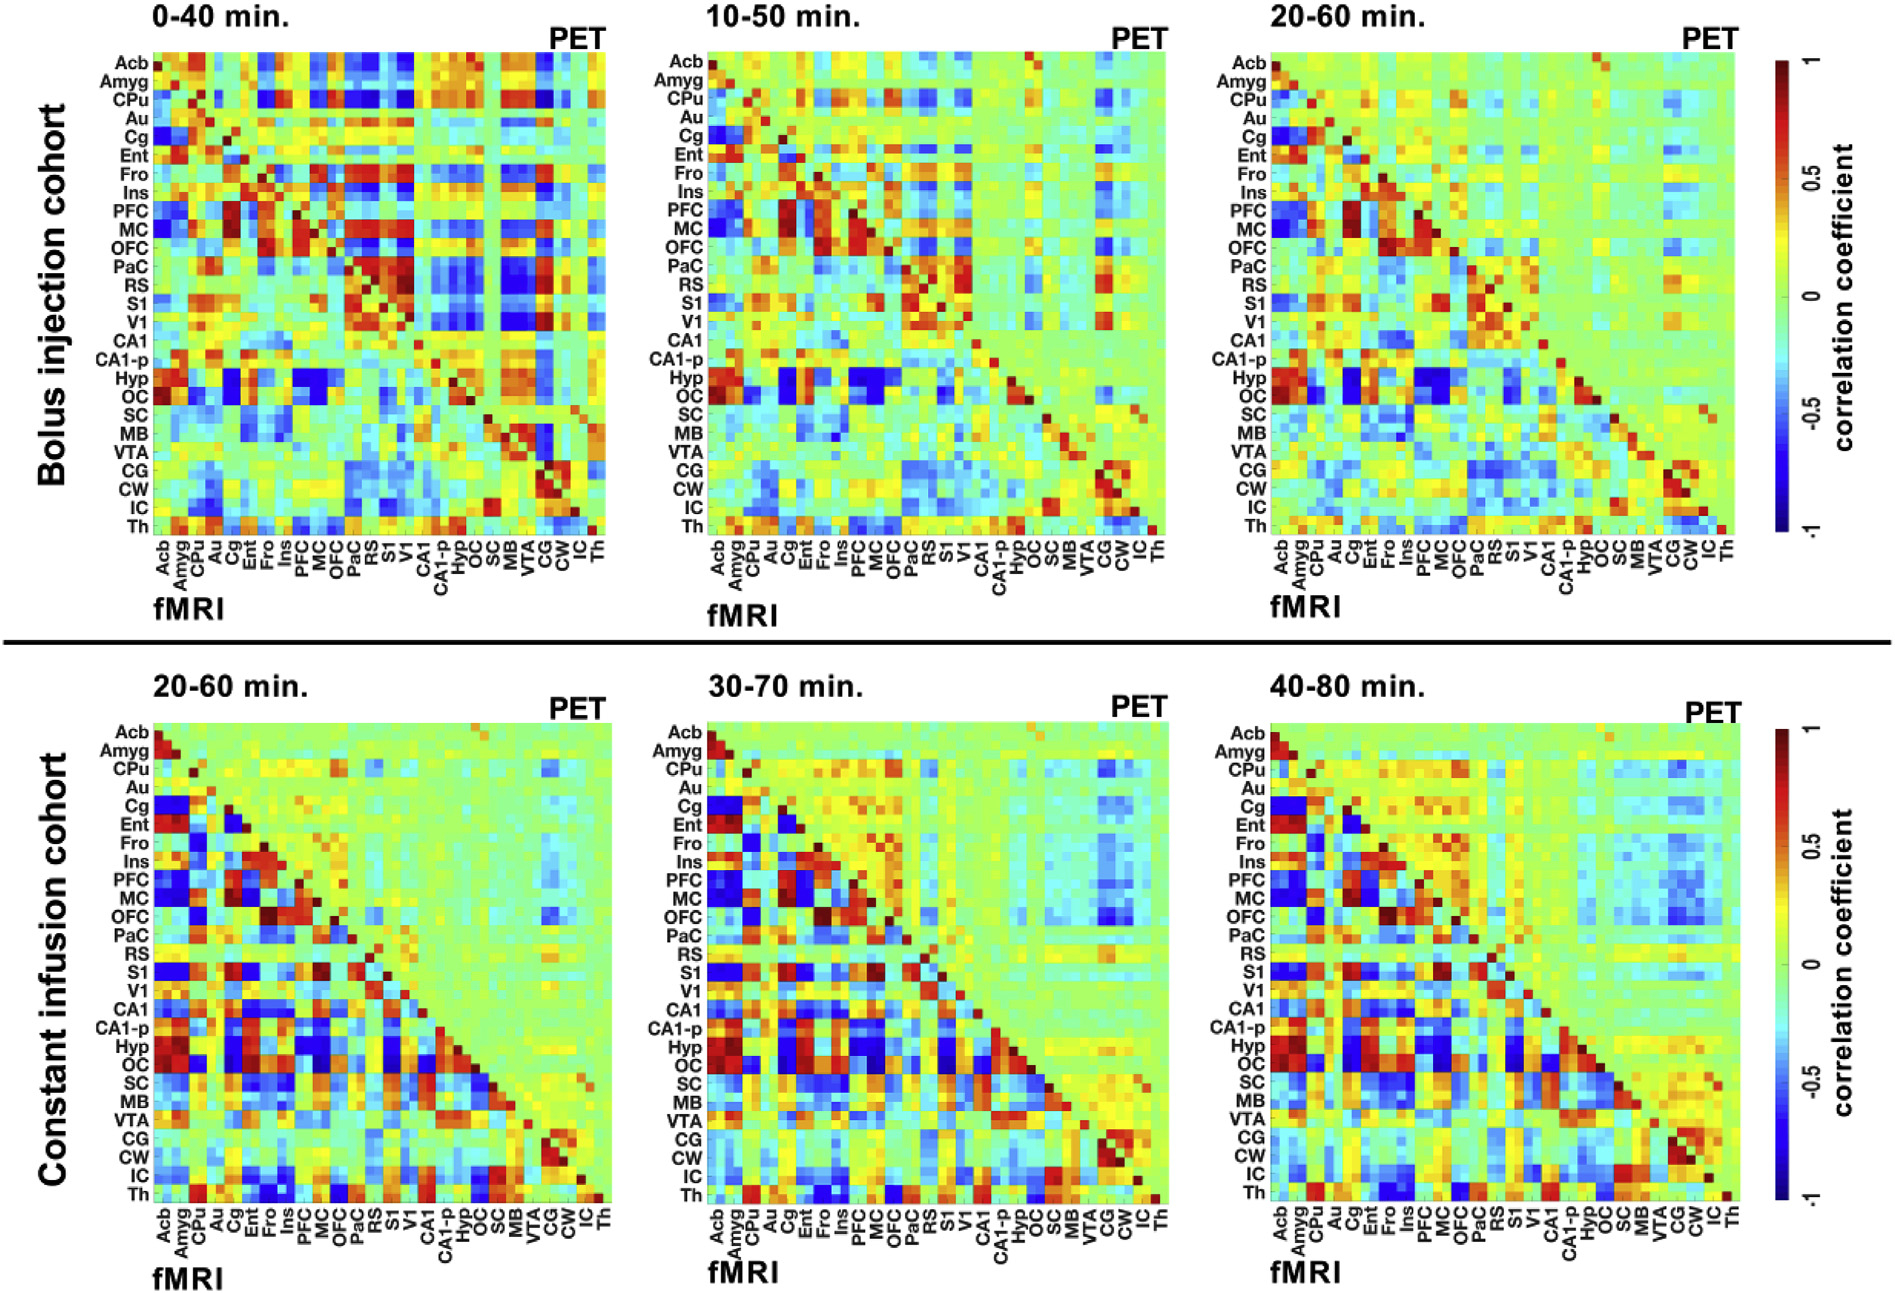
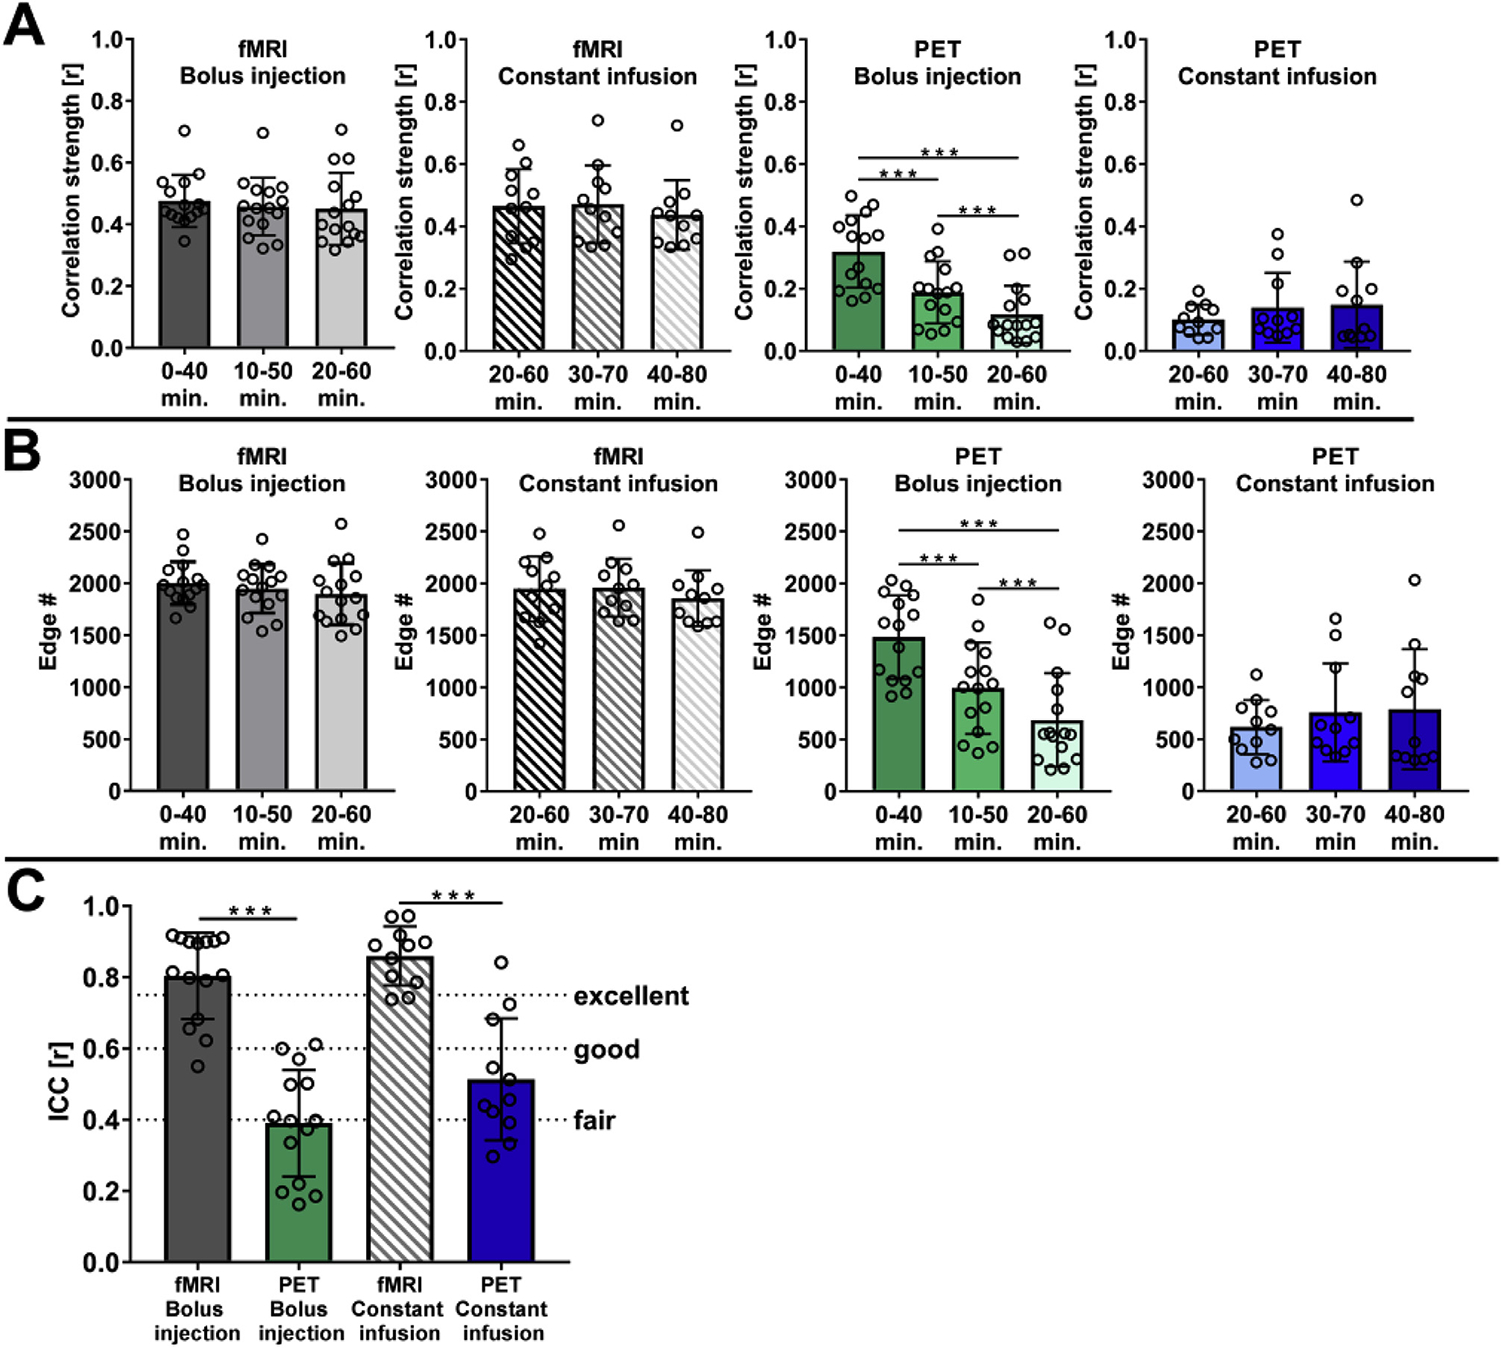
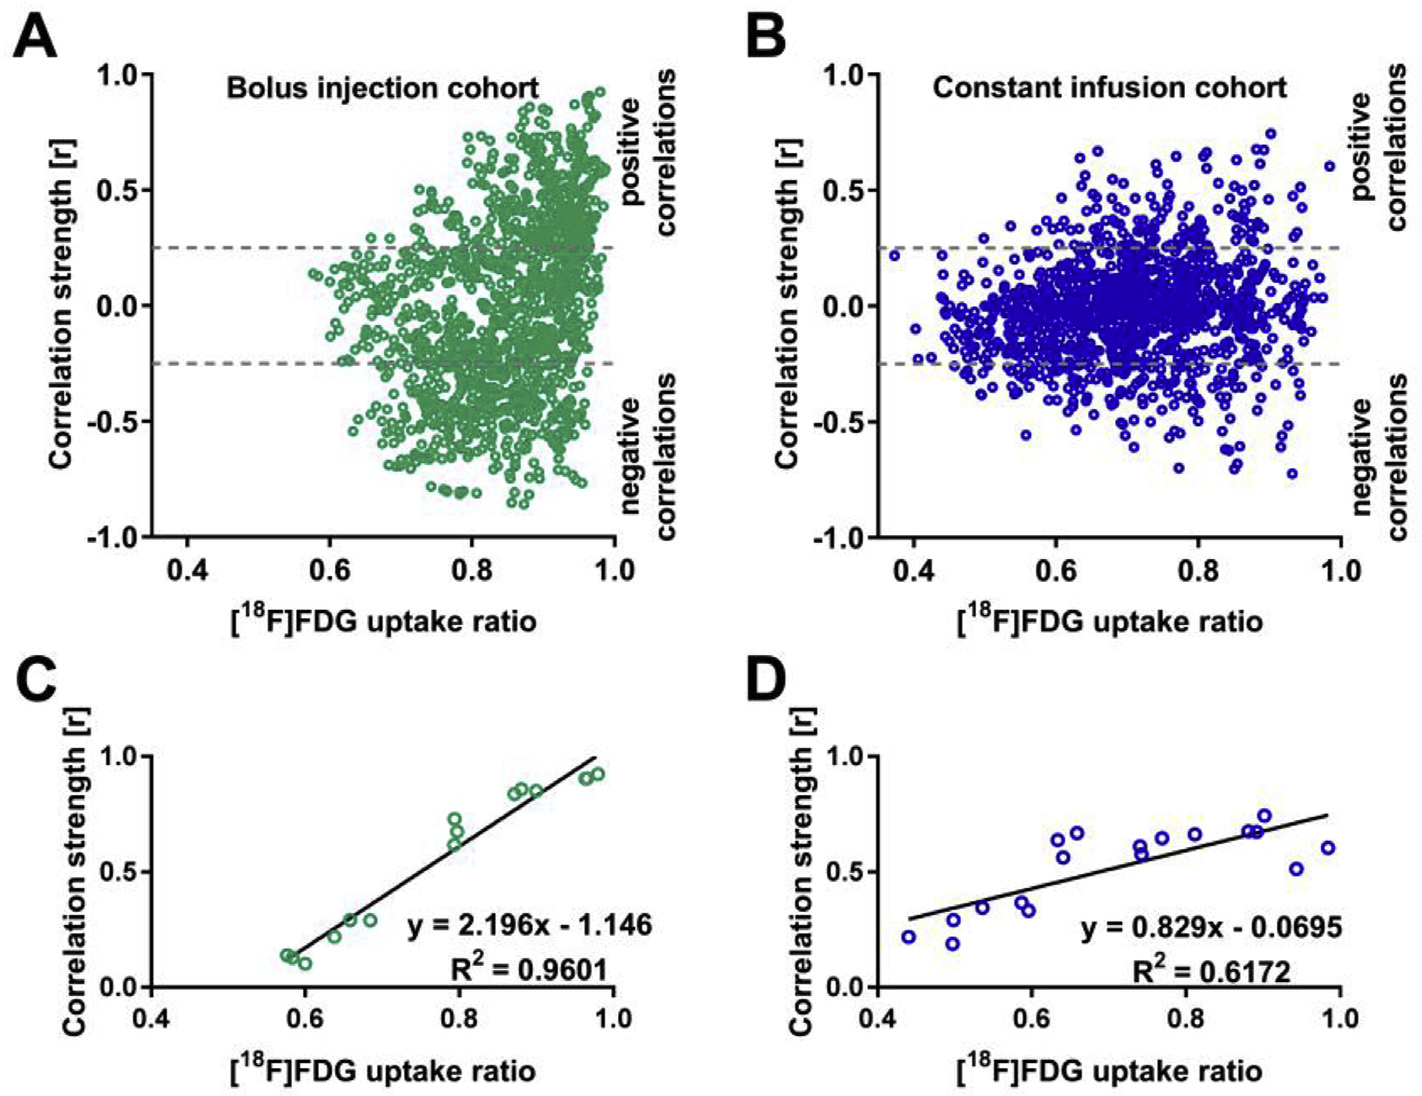
Brain function is characterized by a convolution of various biochemical and physiological processes, raising the interest whether resting-state functional connectivity derived from hemodynamic scales shows underlying metabolic synchronies. Increasing evidence suggests that metabolic connectivity based on glucose consumption associated PET recordings may serve as a marker of cognitive functions and neuropathologies. However, to what extent fMRI-derived resting-state brain connectivity can also be characterized based on dynamic fluctuations of glucose metabolism and how metabolic connectivity is influenced by [18F]FDG pharmacokinetics remains unsolved. Simultaneous PET/MRI measurements were performed in a total of 26 healthy male Lewis rats. Simultaneously to resting-state fMRI scans, one cohort (n = 15) received classical bolus [18F]FDG injections and dynamic PET images were recorded. In a second cohort (n = 11) [18F]FDG was constantly infused over the entire functional PET/MRI scans. Resting-state fMRI and [18F]FDG-PET connectivity was evaluated using a graph-theory based correlation approach and compared on whole-brain level and for a default-mode network-like structure. Further, pharmacokinetic and tracer uptake influences on [18F]FDG-PET connectivity results were investigated based on the different PET protocols. By integrating simultaneous resting-state fMRI and dynamic [18F]FDG-PET measurements in the rat brain, we identified homotopic correlations between both modalities, suggesting an underlying synchrony between hemodynamic processes and glucose consumption. Furthermore, the presence of the prominent resting-state default-mode network-like structure was not only depicted on a functional scale but also from dynamic fluctuations of [18F]FDG. In addition, the present findings demonstrated strong pharmacokinetic and tracer uptake dependencies of [18F]FDG-PET connectivity outcomes. This study highlights the application of dynamic [18F]FDG-PET to study cognitive brain functions and to decode underlying brain networks in the resting-state. Thereby, PET-derived connectivity outcomes indicated strong dependencies on tracer application regimens and subsequent time-varying tracer pharmacokinetics.

Keywords: Connectomics; Resting-state brain networks; Simultaneous PET/fMRI; fPET.


Conflict of interest statement

Conflicts of interest

The authors declare no conflict of interest.

Figures

Fig. 1.
Fig. 1.. Whole-brain functional and [18F]FDG-PET graph theory-based connectivity.
Whole-brain group-mean Pearson’s r correlation coefficient matrices were computed for the fMRI and [18F]FDG-PET data of the (A) bolus injection and (B) the constant infusion cohorts. The color scale represents the strengths of correlations. Correlation coefficients with p-values ≥ 0.05 were set to 0. The respective brain ROIs and their abbreviations are listed in Supplementary Table 1. Bolus injection cohort (N = 15); constant infusion cohort (N = 11).
Fig. 2.
Fig. 2.. Correlation synchrony based on fMRI and dynamic PET data.
(A) Tertiary group-mean matrices of the bolus injection cohort versus the constant infusion cohort indicate common functional and dynamic [18F]FDG-PET correlations; red shows common positive edges (r > 0.25) and blue shows common negative edges (r < −0.25). (B) Dice coefficients indicate similarities for total, positive and negative edges between weighted group-mean functional and dynamic [18F] FDG-PET correlations in both cohorts. The respective brain ROIs and their abbreviations are listed in Supplementary Table 1. Bolus injection cohort (N = 15); constant infusion cohort (N = 11). The error bars represent standard deviations. ** represents p-values < 0.01.
Fig. 3.
Fig. 3.. Functional and [18F]FDG-PET correlations within the DMN-like network.
Group-mean Pearson’s r correlation coefficient matrices of the DMN-like structure were computed for the fMRI and [18F]FDG-PET data of the (A) bolus injection and (B) constant infusion cohorts. Correlation coefficients with p-values ≥ 0.05 were set to 0. Positive correlations (r ≥ 0.25) are displayed within regions of the DMN-like structure for (C) the bolus injection and (D) constant infusion cohorts. Colored nodes represent the different brain regions involved in the DMN-like structure. Colored lines indicate positive correlation between two nodes. The color scale represents the strengths of correlations. Scatter plots of pair-wise correlations between brain regions (averaged across subjects) containing the DMN-like structure and linear fits were computed for (E) the bolus injection and (F) constant infusion cohorts. The correlation value represents Pearson’s correlation coefficient r. The different brain ROIs containing the DMN-like structure and their abbreviations are listed in Supplementary Table 2. Bolus injection cohort (N = 15); constant infusion cohort (N = 11).
Fig. 4.
Fig. 4.. Temporal synchronization of fMRI and PET data.
fMRI time course data of the bolus injection cohort were binned to the temporal resolution of the PET data (1 min) and Pearson’s r correlation coefficient matrices were computed for the DMN-like structure. Resulting matrices were compared to (A) the original fMRI data and the (B) the [18F]FDG-PET data. Scatter plots of pair-wise correlations between brain regions (averaged across subjects) containing the DMN-like structure and linear fits were computed for (C) the comparison between original fMRI and binned fMRI data, as well as for (D) the comparison between binned fMRI and [18F]FDG-PET data. The correlation value represents Pearson’s correlation coefficient r. The different brain ROIs containing the DMN-like structure and their abbreviations are listed in Supplementary Table 2. (N = 15).
Fig. 5.
Fig. 5.. Dynamic [18F]FDG-PET connectivity.
Pearson’s r correlation coefficient matrices were computed for the fMRI and [18F]FDG-PET data of the bolus injection and constant infusion cohorts at three different time intervals of 40 min (bolus injection cohort: 0–40 min, 10–50 min, and 20–60 min; constant infusion cohort: 20–60 min, 30–70 min, and 40–80 min). The color scale represents the strengths of correlations. Correlation coefficients with p-values ≥ 0.05 were set to 0. The different brain ROIs and their abbreviations are listed in Supplementary Table 1 p ≥ 0.05. Bolus injection cohort (N = 15); constant infusion cohort (N = 11).
Fig. 6.
Fig. 6.. Quantitative dynamic correlation characteristics.
(A) The mean correlation strengths and (B) edge numbers of functional and [18F]FDG-PET correlations were calculated for the bolus injection and constant infusion cohorts at three 40-min time intervals (bolus injection cohort: 0–40 min, 10–50 min, and 20–60 min; constant infusion cohort: 20–60 min, 30–70 min, and 40–80 min). (C) Intraclass correlations were calculated to describe within-scan consistency between functional and [18F]FDG-PET correlation matrices obtained for the three mentioned time intervals. Intraclass correlations are interpreted as r < 0.40: poor correlation, 0.40 ≤ r < 0.59: fair correlation, 0.60 ≤ r < 0.75: good correlation, and r ≥ 0.75: excellent correlation. The error bars represent standard deviations. Bolus injection cohort (N = 15); constant infusion cohort (N = 11). *** represents p-values < 0.001.
Fig. 7.
Fig. 7.. [18F]FDG-PET correlation strength is tracer uptake-dependent.
The dependencies of correlation coefficient strengths on the [18F]FDG uptake ratios of the respective brain areas are shown in scatter plots for the bolus injection cohort (A) and the constant infusion cohort (B). The three highest positive correlations for six [18F]FDG uptake ratio intervals (0.40–0.50, 0.50–0.60, 0.60–0.70, 0.70–0.80, 0.80–0.90, and 0.90–1.00) were selected for linear regression analysis for (C) the bolus injection and (D) constant infusion cohorts. Bolus injection cohort (N = 15); constant infusion cohort (N = 11).

References

    1. Aiello M, Salvatore E, Cachia A, Pappata S, Cavaliere C, Prinster A, Nicolai E, Salvatore M, Baron JC, Quarantelli M, 2015. Relationship between simultaneously acquired resting-state regional cerebral glucose metabolism and functional MRI: a PET/MR hybrid scanner study. Neuroimage 113, 111–121. - PubMed
    1. Alf MF, Martic-Kehl MI, Schibli R, Kramer SD, 2013. FDG kinetic modeling in small rodent brain PET: optimization of data acquisition and analysis. EJNMMI Res. 3, 61. - PMC - PubMed
    1. Becerra L, Pendse G, Chang PC, Bishop J, Borsook D, 2011. Robust reproducible resting state networks in the awake rodent brain. PLoS One 6 (10), e25701. - PMC - PubMed
    1. Biswal B, Yetkin FZ, Haughton VM, Hyde JS, 1995. Functional connectivity in the motor cortex of resting human brain using echo-planar MRI. Magn. Reson. Med. 34 (4), 537–541. - PubMed
    1. Bukhari Q, Schroeter A, Rudin M, 2018. Increasing isoflurane dose reduces homotopic correlation and functional segregation of brain networks in mice as revealed by resting-state fMRI. Sci. Rep. 8 (1), 10591. - PMC - PubMed

Publication types