. 2019 Jun 4;139(23):2613-2624.
doi: 10.1161/CIRCULATIONAHA.118.036751. Epub 2019 Apr 15.

Cost-Effectiveness of the US Food and Drug Administration Added Sugar Labeling Policy for Improving Diet and Health

Affiliations

Cost-Effectiveness of the US Food and Drug Administration Added Sugar Labeling Policy for Improving Diet and Health

Yue Huang et al. Circulation. .

Abstract

Background: Excess added sugars, particularly from sugar-sweetened beverages, are a major risk factor for cardiometabolic diseases including cardiovascular disease and type 2 diabetes mellitus. In 2016, the US Food and Drug Administration mandated the labeling of added sugar content on all packaged foods and beverages. Yet, the potential health impacts and cost-effectiveness of this policy remain unclear.

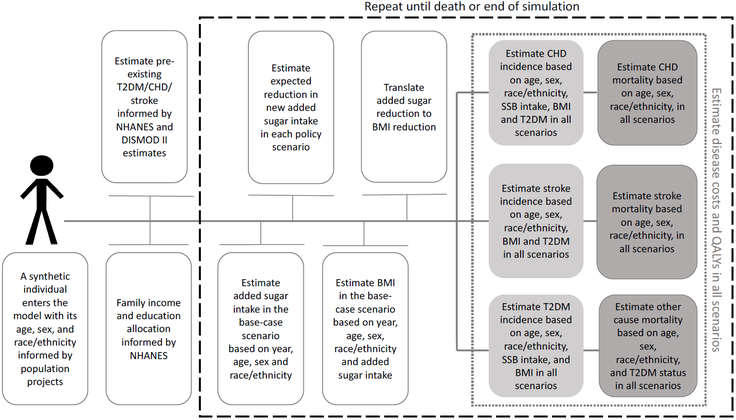
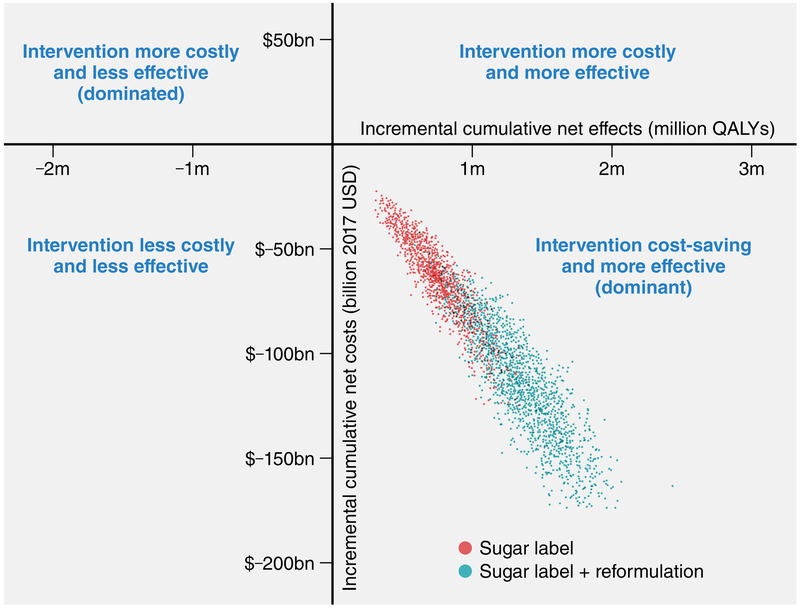
Methods: A validated microsimulation model (US IMPACT Food Policy model) was used to estimate cardiovascular disease and type 2 diabetes mellitus cases averted, quality-adjusted life-years, policy costs, health care, informal care, and lost productivity (health-related) savings and cost-effectiveness of 2 policy scenarios: (1) implementation of the US Food and Drug Administration added sugar labeling policy (sugar label), and (2) further accounting for corresponding industry reformulation (sugar label+reformulation). The model used nationally representative demographic and dietary intake data from the National Health and Nutrition Examination Survey, disease data from the Centers for Disease Control and Prevention Wonder Database, policy effects and diet-disease effects from meta-analyses, and policy and health-related costs from established sources. Probabilistic sensitivity analysis accounted for model parameter uncertainties and population heterogeneity.

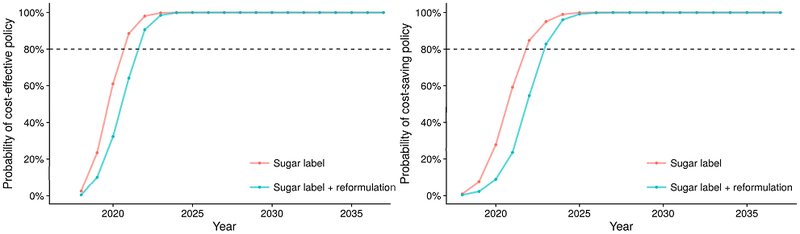
Results: Between 2018 and 2037, the sugar label would prevent 354 400 cardiovascular disease (95% uncertainty interval, 167 000-673 500) and 599 300 (302 400-957 400) diabetes mellitus cases, gain 727 000 (401 300-1 138 000) quality-adjusted life-years, and save $31 billion (15.7-54.5) in net healthcare costs or $61.9 billion (33.1-103.3) societal costs (incorporating reduced lost productivity and informal care costs). For the sugar label+reformulation scenario, corresponding gains were 708 800 (369 200-1 252 000) cardiovascular disease cases, 1.2 million (0.7-1.7) diabetes mellitus cases, 1.3 million (0.8-1.9) quality-adjusted life-years, and $57.6 billion (31.9-92.4) and $113.2 billion (67.3-175.2), respectively. Both scenarios were estimated with >80% probability to be cost saving by 2023.

Conclusions: Implementing the US Food and Drug Administration added sugar labeling policy could generate substantial health gains and cost savings for the US population.

Keywords: cardiovascular diseases; cost-benefit analysis; diabetes mellitus; diet; food labeling; policy; prevention & control.


Figures

Figure 1.
Figure 1.. Etiologic pathway through which the U.S. FDA added sugar labeling policy is translated into changes in disease burden.
Considering harms linked to SSB consumption partly due to their liquid form, large dose, and rapid digestion in comparison to solid foods, etiologic effects on cardiometabolic outcomes were evaluated separately for added sugars in SSBs vs. other foods.
Figure 2.
Figure 2.. Simplified IMPACT model structure for estimating the cost-effectiveness of the U.S. FDA added sugar labeling policy.
To generate a U.S. representative synthetic population of adults aged 30-84 years at baseline, the model utilized demographic information, body mass index (BMI) data, and added sugar intakes from the two most recent NHANES cycles (2011-2014). Demographic information included age, sex, race, income and education, and dietary intake included added sugar from SSBs and other foods, estimated based on two 24-hour dietary recalls per person. Population size by age, sex, and race and future population projections was derived from the CDC Wonder Database (2014). The model simulates first the life courses of synthetic individuals under the base-case scenario and estimates their added sugar consumption, body mass index (BMI), incidence of type 2 diabetes (T2DM), the first episode of coronary heart disease (CHD) and/or stroke, quality-adjusted life-years (QALYs), costs, and death from these diseases or any other cause on an annual basis. Then, it calculates the life courses of the same synthetic individuals under both labeling scenarios and generates annual estimated changes in each health outcome at the individual level.
Figure 3.
Figure 3.. Projected policy and health-related costs for the U.S. FDA added sugar labeling policy over the 20-year simulated period (2018 to 2037).
Probabilistic sensitivity analysis via second-order Monte Carlo approach allowed estimated uncertainty of model parameters and individual heterogeneity to be propagated to the outputs. Output distributions are summarized by medians (lines) and 95% uncertainty intervals (shaded areas). Policy costs included government administration and industry compliance/reformulation costs. Health-related costs included medical, informal care and productivity costs related to coronary heart disease, stroke and type 2 diabetes (Supplemental Table 4). The shaded purple area depicts the uncertainty intervals for policy costs; the red area, for informal care costs; the dark green area, for the overlap between medical costs and productivity costs; the light blue area, for productivity costs alone, and the light green area, for medical costs alone. Negative costs represent savings. Costs were inflated to 2017 USD and discounted at 3% annually.
Figure 4.
Figure 4.. Cost-effectiveness plane for the U.S. FDA added sugar labeling policy by the end of the 20-year simulated period (year 2037).
Each colored dot is the result of each of 2,000 Monte Carlo iterations. Large dots are median combinations of cumulative discounted net costs (2017 USD) and discounted net quality-adjusted life-years (QALYs) for each simulated scenario, and ellipses depict 95% uncertainty intervals. Negative costs represent savings.
Figure 5.
Figure 5.. Estimated probability of cost-effective and cost-saving U.S. FDA added sugar labeling policy over the 20-year simulated period (2018 to 2037).
Probabilities for cost-effectiveness and cost-saving of the U.S. FDA added sugar labeling policy as compared with the base-case scenario were estimated via second-order Monte Carlo approach, with willingness-to-pay threshold being valued at $100,000 per quality-adjusted-life year (QALY).

Comment in

  • Added Sugar Labeling.
    Magnuson EA, Chan PS. Magnuson EA, et al. Circulation. 2019 Jun 4;139(23):2625-2627. doi: 10.1161/CIRCULATIONAHA.119.040325. Epub 2019 Jun 3. Circulation. 2019. PMID: 31157997 No abstract available.

References

    1. Food and Drug Administration. Food labeling: revision of the Nutrition and Supplement Facts Labels; final rule. 2016;21 CFR 101. Federal Register 2016;103: 33742–33999. - PubMed
    1. Te Morenga L, Mallard S and Mann J. Dietary sugars and body weight: systematic review and meta-analyses of randomised controlled trials and cohort studies. BMJ. 2013;346:e7492–e7492. - PubMed
    1. Malik VS, Pan A, Willett WC and Hu FB. Sugar-sweetened beverages and weight gain in children and adults: a systematic review and meta-analysis. Am J Clin Nutr. 2013;98:1084–1102. - PMC - PubMed
    1. Micha R, Peñalvo JL, Cudhea F, Imamura F, Rehm CD and Mozaffarian D. Association Between Dietary Factors and Mortality From Heart Disease, Stroke, and Type 2 Diabetes in the United States. JAMA. 2017;317:912–924. - PMC - PubMed
    1. Malik VS, Popkin BM, Bray GA, Despres JP, Willett WC and Hu FB. Sugar-sweetened beverages and risk of metabolic syndrome and type 2 diabetes: a meta-analysis. Diabetes Care. 2010;33:2477–2483. - PMC - PubMed

Publication types

MeSH terms