. 2019 Nov;15(11):1899-1916.
doi: 10.1080/15548627.2019.1596483. Epub 2019 Apr 14.

HIF1A and NFAT5 coordinate Na+-boosted antibacterial defense via enhanced autophagy and autolysosomal targeting

Affiliations

HIF1A and NFAT5 coordinate Na+-boosted antibacterial defense via enhanced autophagy and autolysosomal targeting

Patrick Neubert et al. Autophagy. 2019 Nov.

Abstract

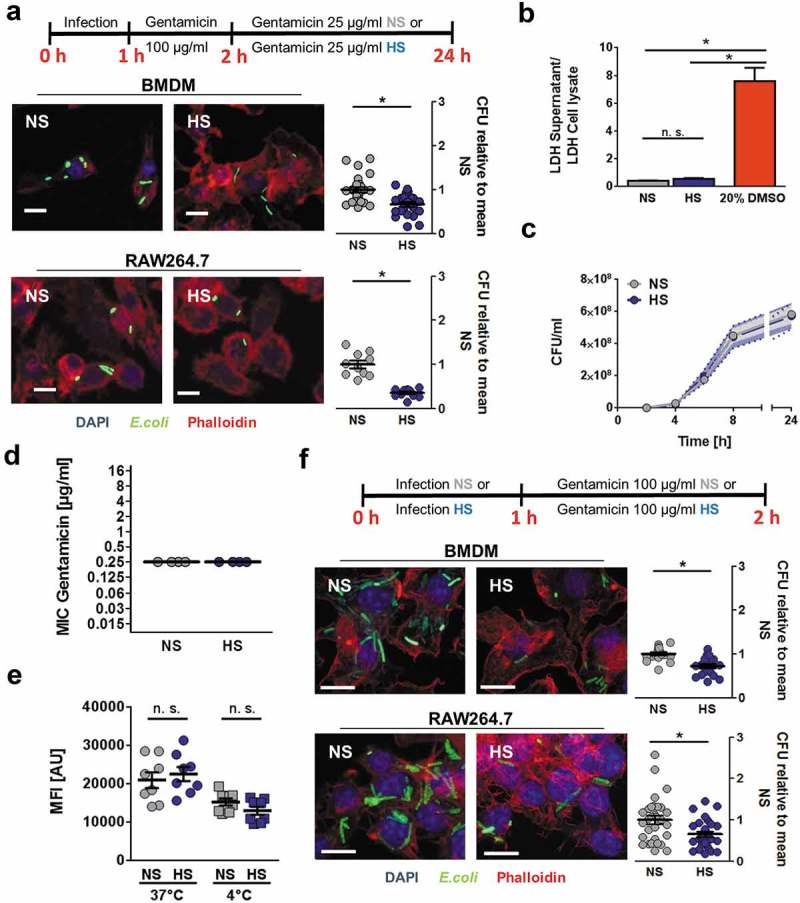
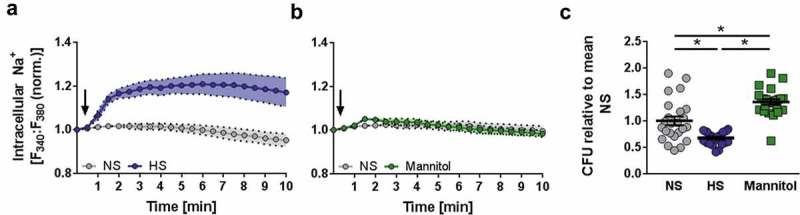
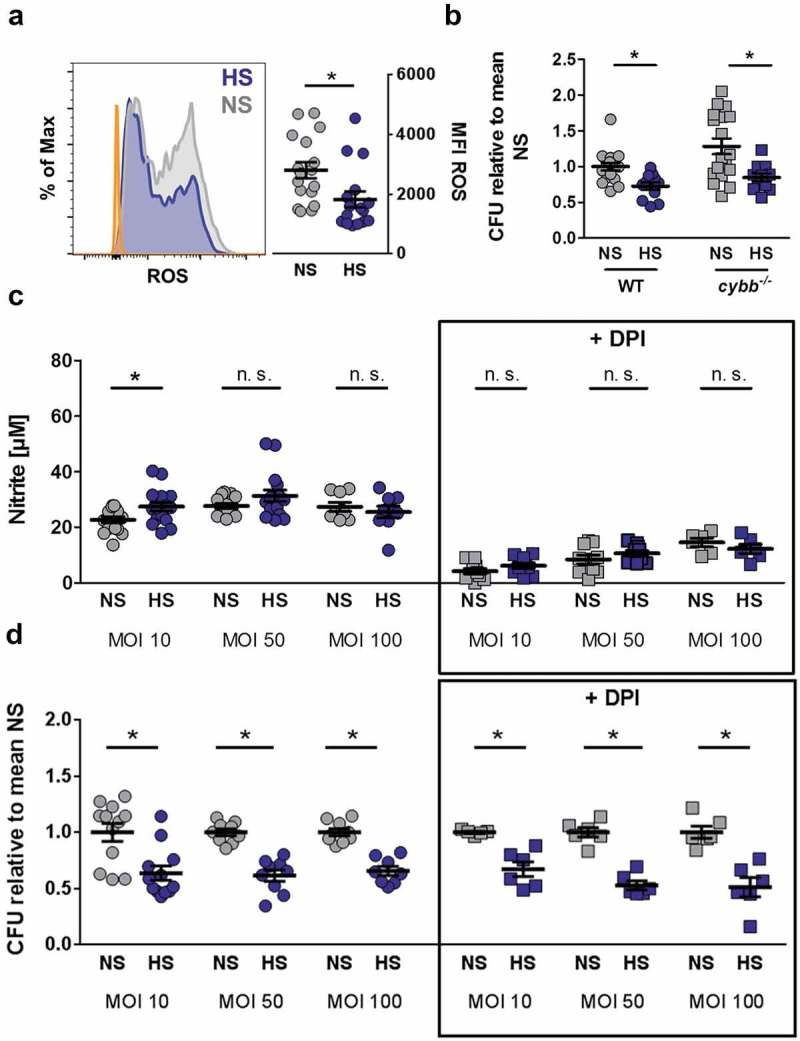
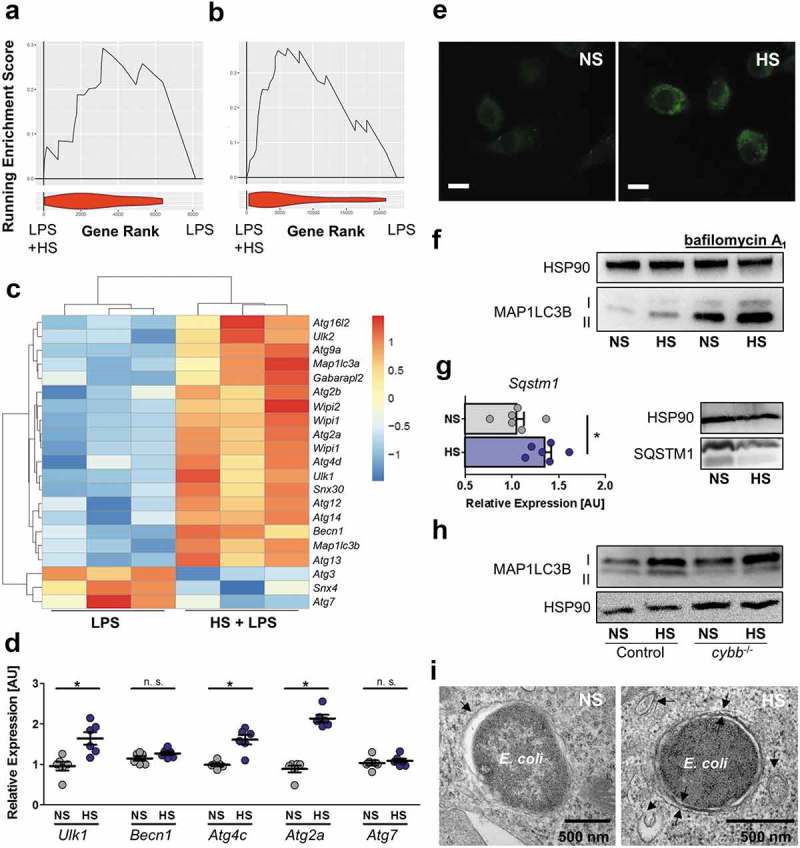
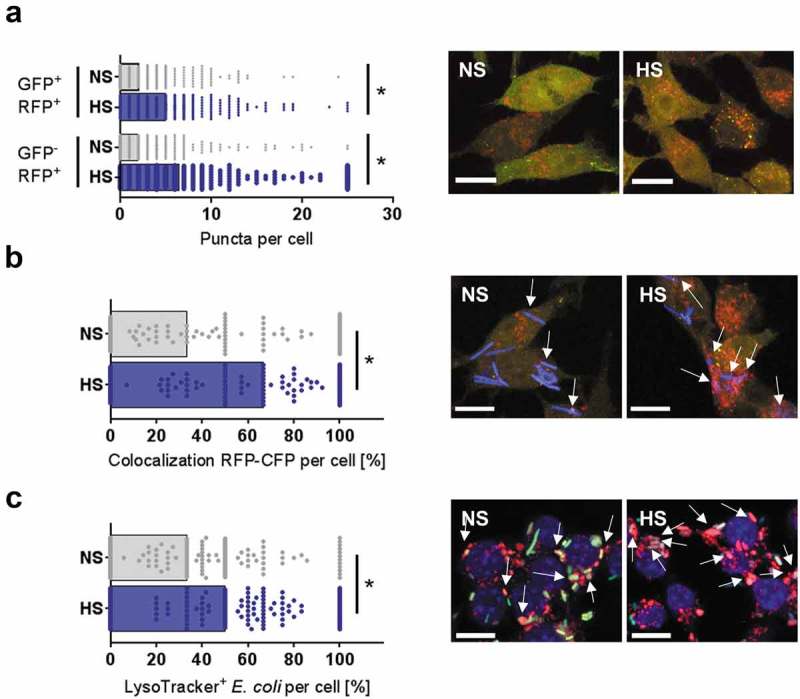
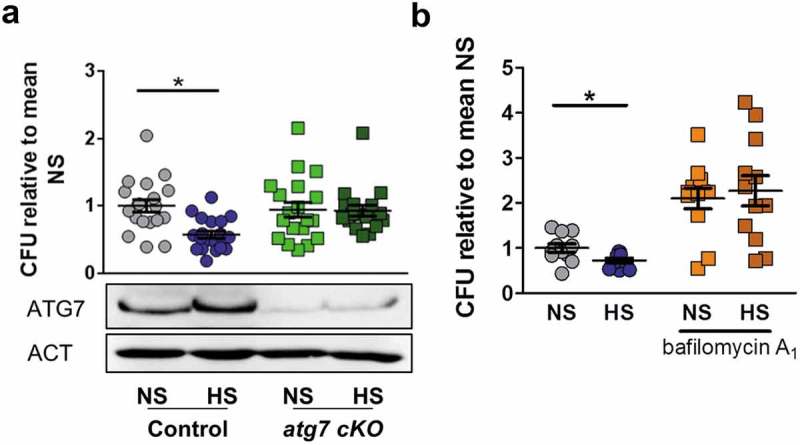
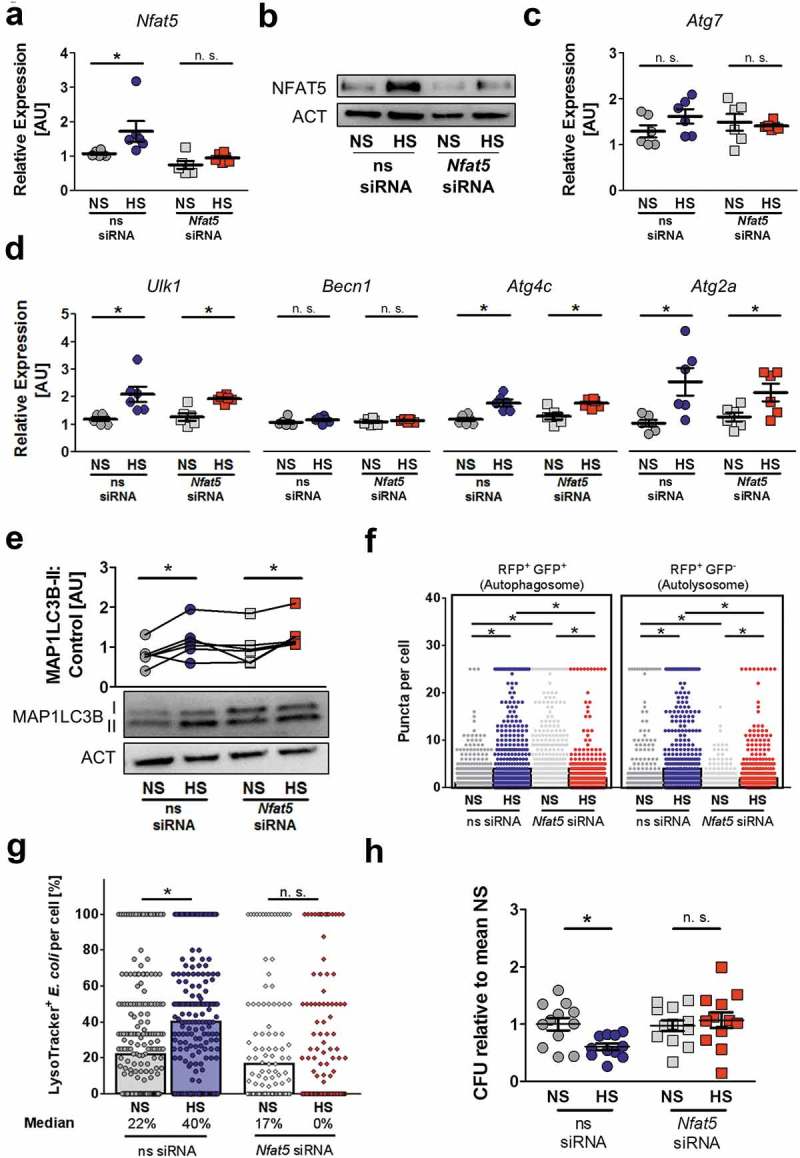
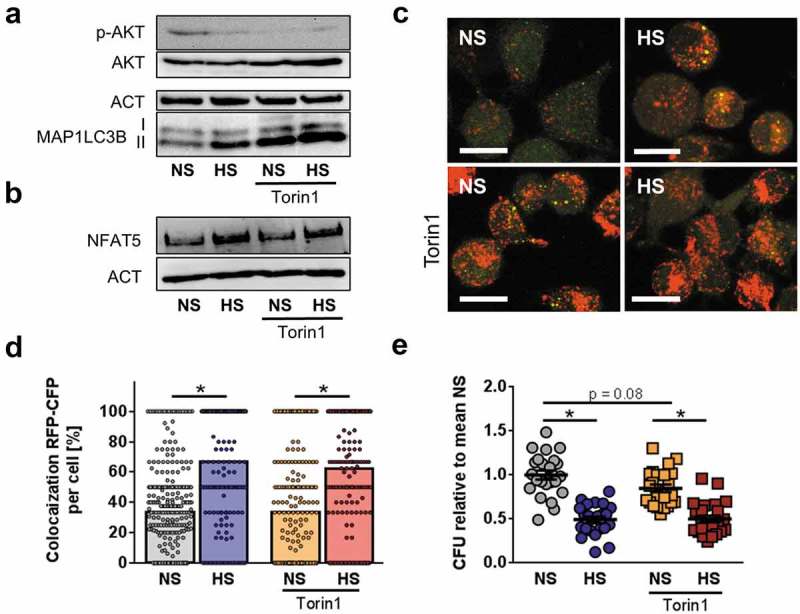
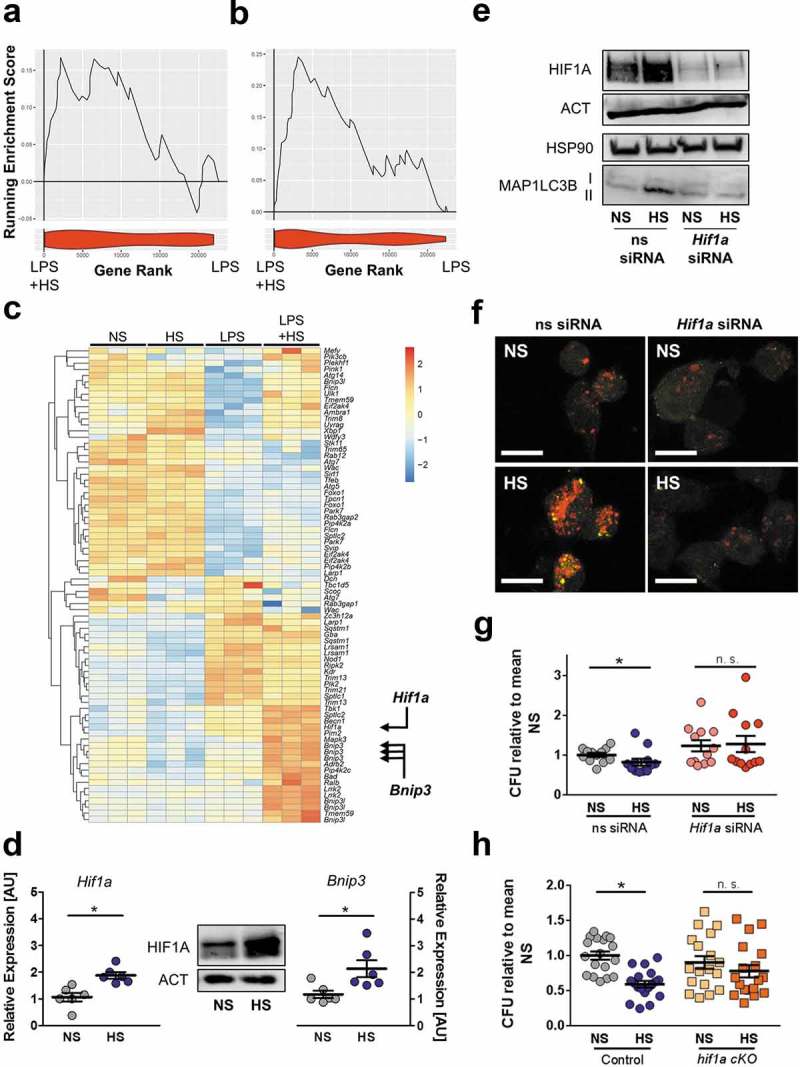
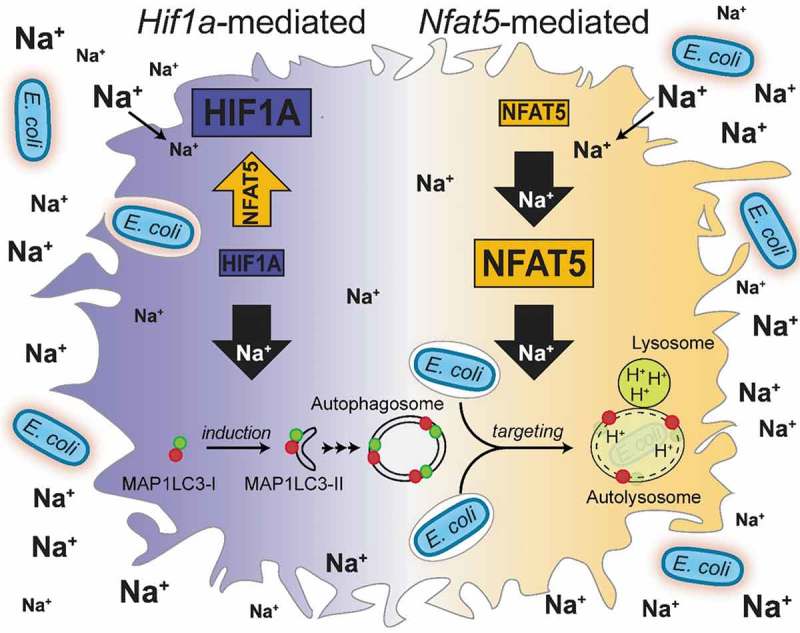
Infection and inflammation are able to induce diet-independent Na+-accumulation without commensurate water retention in afflicted tissues, which favors the pro-inflammatory activation of mouse macrophages and augments their antibacterial and antiparasitic activity. While Na+-boosted host defense against the protozoan parasite Leishmania major is mediated by increased expression of the leishmanicidal NOS2 (nitric oxide synthase 2, inducible), the molecular mechanisms underpinning this enhanced antibacterial defense of mouse macrophages with high Na+ (HS) exposure are unknown. Here, we provide evidence that HS-increased antibacterial activity against E. coli was neither dependent on NOS2 nor on the phagocyte oxidase. In contrast, HS-augmented antibacterial defense hinged on HIF1A (hypoxia inducible factor 1, alpha subunit)-dependent increased autophagy, and NFAT5 (nuclear factor of activated T cells 5)-dependent targeting of intracellular E. coli to acidic autolysosomal compartments. Overall, these findings suggest that the autolysosomal compartment is a novel target of Na+-modulated cell autonomous innate immunity. Abbreviations: ACT: actins; AKT: AKT serine/threonine kinase 1; ATG2A: autophagy related 2A; ATG4C: autophagy related 4C, cysteine peptidase; ATG7: autophagy related 7; ATG12: autophagy related 12; BECN1: beclin 1; BMDM: bone marrow-derived macrophages; BNIP3: BCL2/adenovirus E1B interacting protein 3; CFU: colony forming units; CM-H2DCFDA: 5-(and-6)-chloromethyl-2',7'-dichlorodihydrofluorescein diacetate, acetyl ester; CTSB: cathepsin B; CYBB: cytochrome b-245 beta chain; DAPI: 4,6-diamidino-2-phenylindole; DMOG: dimethyloxallyl glycine; DPI: diphenyleneiodonium chloride; E. coli: Escherichia coli; FDR: false discovery rate; GFP: green fluorescent protein; GSEA: gene set enrichment analysis; GO: gene ontology; HIF1A: hypoxia inducible factor 1, alpha subunit; HUGO: human genome organization; HS: high salt (+ 40 mM of NaCl to standard cell culture conditions); HSP90: heat shock 90 kDa proteins; LDH: lactate dehydrogenase; LPS: lipopolysaccharide; Lyz2/LysM: lysozyme 2; NFAT5/TonEBP: nuclear factor of activated T cells 5; MΦ: macrophages; MAP1LC3/LC3: microtubule associated protein 1 light chain 3; MFI: mean fluorescence intensity; MIC: minimum inhibitory concentration; MOI: multiplicity of infection; MTOR: mechanistic target of rapamycin kinase; NaCl: sodium chloride; NES: normalized enrichment score; n.s.: not significant; NO: nitric oxide; NOS2/iNOS: nitric oxide synthase 2, inducible; NS: normal salt; PCR: polymerase chain reaction; PGK1: phosphoglycerate kinase 1; PHOX: phagocyte oxidase; RFP: red fluorescent protein; RNA: ribonucleic acid; ROS: reactive oxygen species; sCFP3A: super cyan fluorescent protein 3A; SBFI: sodium-binding benzofuran isophthalate; SLC2A1/GLUT1: solute carrier family 2 (facilitated glucose transporter), member 1; SQSTM1/p62: sequestosome 1; ULK1: unc-51 like kinase 1; v-ATPase: vacuolar-type H+-ATPase; WT: wild type.

Keywords: Autophagy; cell-autonomous immunity; macrophage; salt; sodium.


Figures

Figure 1.
Figure 1.
HS boosts antibacterial activity of MΦ against E. coli. (a) BMDM or RAW264.7 MΦ were infected with E. coli (MOI 100) under normal salt conditions (NS) and subjected to gentamicin protection assays (upper panel). Where indicated, cells were exposed to high salt conditions (HS; +40 mM NaCl) 2 h after infection. Confocal images: sfGFP-E. coli, green; Phalloidin, red; DAPI (DNA), blue. Scale bar: 10 µm. Intracellular E. coli load, colony-forming units (CFU) relative to mean CFU under NS conditions (means ± s.e.m; nBMDM = 23–24; nRAW264.7 = 10–11; Student’s t test ± Welch correction, * p < 0.05). (b) Cells treated as in (a) or with 20% DMSO (dimethyl sulfoxide). Relative LDH (Lactate dehydrogenase)-release was quantified (means ± s.e.m; n = 9–12; Kruskal-Wallis test with Dunn’s multiple comparison tests. * p < 0.05). (c) E. coli were grown in the absence of host cells in cell culture media under NS and HS conditions. At the indicated time points, CFU were determined (means ± s.e.m; n = 4–6). (d) Minimal inhibitory concentration of gentamicin against E. coli HB101 under NS and HS conditions (means ± s.e.m; n = 4). (e) BMDM were exposed to Latex beads at 37°C or at 4°C for ½ h under NS or HS and subjected to flow cytometry. Mean fluorescence intensities (MFI) were recorded (means ± s.e.m; n = 8; Student’s t test; * p < 0.05). (f) As in (a), but directly after infection MΦ were incubated under NS or HS for 2 h (upper panel). Confocal images: sfGFP-E. coli, green; Phalloidin, red; DAPI (DNA), blue. Scale bar: 10 µm. Intracellular E. coli load, CFU relative to mean CFU under NS conditions (means ± s.e.m; nBMDM = 18; nRAW264.7 = 29–31; Student’s t test ± Welch correction, * p < 0.05).
Figure 2.
Figure 2.
Osmotic stress induced by mannitol does not induce Na+ entry and impairs antibacterial activity. (a) Intracellular Na+ levels were assessed in SBFI-loaded and E. coli-infected RAW264.7 MΦ by ratiometric live cell imaging. The arrow indicates the addition of 40 mM NaCl (corresponding to an increase in osmolality of 80 mOsm/kg) to infected cells (means ± s.e.m; n = 6). (b) As in (a), but instead of NaCl, 80 mM mannitol (corresponding to an increase in osmolality of 80 mOsm/kg) was added where indicated (means ± s.e.m; n = 6). (c) BMDM were infected as in Figure 1(f), but with an additional condition using 80 mM mannitol (means ± s.e.m; n = 24; Kruskal-Wallis test with Dunn’s multiple comparison tests; * p < 0.05).
Figure 3.
Figure 3.
HS-boosted antibacterial activity of MΦ is independent of PHOX and NOS2. (a) As in Figure 1(f), but 6 h after infection, BMDM were stained with CM-H2DCFDA and subjected to flow cytometry. Left section, histogram. Orange area, unstained cells; Gray area, NS; Blue area, HS. Right section, means ± s.e.m; n = 16 −17; Mann Whitney test; * p < 0.05 (b) As Figure 1(f), but cybb-/- and littermate control (WT) BMDM were used. Intracellular E. coli in CFU relative to mean CFU under NS WT conditions (means ± s.e.m; n = 11–18; Student’s t test ± Welch correction; * p < 0.05) (c) BMDM were infected with E. coli at the indicated MOI, subjected to gentamicin protection assays and exposed to NS and HS conditions 2 h after infection ± DPI where indicated. 24 h after infection, nitrite levels were quantified (means ± s.e.m; n = 6–16; Student’s t test and Mann Whitney test; * p < 0.05). (d) As in (c), intracellular E. coli load 24 h after infection in CFU relative to mean CFU under the respective NS conditions (means ± s.e.m; n = 5–12; Student’s t test ± Welch correction; * p < 0.05).
Figure 4.
Figure 4.
HS increases autophagy in E. coli-infected MΦ. (a and b) GSEA for the HUGO autophagy gene set. Upper section, genes are placed in rank order based on differences in expression on the x-axis and the curve represents the running enrichment score across the dataset. Bottom section, violin plot indicating the frequency distribution of the genes within the HUGO gene set by rank. (a) GSEA using the dataset of Ip et al. [2] (b) GSEA of own Agilent microarray data of RAW264.7 MΦ stimulated with LPS ± 40 mM NaCl for 24 h. (c) Heatmap of gene expression from own Agilent array. Genes plotted are genes within the HUGO autophagy gene set and significantly differentially expressed (Benjamini Hochberg adjusted p value < 0.05) for the addition of Na+ to LPS (10 ng/mL) treated MΦ. (d) As in Figure 1(f), but Ulk1, Becn1, Atg2a, Atg4c and Atg7 mRNA levels were quantified (means ± s.e.m; n = 6; Student’s t test ± Welch correction; * p < 0.05). (e) As Figure 1(f), but GFP-MAP1LC3 expressing BMDM were used. GFP-MAP1LC3 puncta formation was assessed. Representative images of three experiments are displayed. Scale bar: 10 µm. (f) RAW264.7 MΦ were treated as in (d), but for ½ h ± pretreatment with 100 nM bafilomycin A1. A representative immunoblot of MAP1LC3B and HSP90 levels is displayed. (g) As in (d), Sqstm1 was determined on mRNA (means + s.e.m; n = 6; Student’s t test; * p < 0.05) and protein level. (h) As (f), but Cybb-/- and controls BMDM were used. (i) As in (d), but cells were subjected to transmission electron microscopy. Representative E. coli-containing vacuoles of two experiments are displayed.
Figure 5.
Figure 5.
HS facilitates autolysosomal targeting of E. coli. (a) As in Figure 1(f), but RFP-GFP-mLC3 RAW264.7 MΦ were used. RFP+GFP and RFP+GFP+-puncta were counted per cell. Confocal images: GFP, green; RFP, red. Scale bar: 10 µm. At least 287 MΦ from two independent experiments (bars: median scores; Mann-Whitney test; * p < 0.05). (b) As in (a), but sCFP3A-E. coli were used. Confocal images: GFP, green; RFP, red; sCFP3A-E. coli, blue. Scale bar: 10 µm. Rate of E. coli-sCFP3A/RFP+GFPcolocalization per cell. At least 118 MΦ from two independent experiments (bars: median scores; Mann-Whitney test; *p < 0.05). (c) RAW264.7 MΦ were infected with sfGFP-E. coli as in Figure 1(f), but stained with LysoTracker. Confocal images: sfGFP-E. coli, green; LysoTracker, red; DAPI (DNA), blue. Scale bar: 10 µm. Colocalization of sfGFP-E. coli and LysoTracker per MΦ. At least 166 MΦ from two independent experiments were analyzed (bars: median scores; Mann-Whitney test; * p < 0.05).
Figure 6.
Figure 6.
Autophagy and lysosomal acidification are required for high Na+-increased antibacterial activity. (a) As in Figure 1(a), but BMDM from atg7 cKO and littermate controls were used. Upper section, intracellular E. coli load in CFU relative to mean CFU under NS conditions (means ± s.e.m; n = 18–20; Student’s t test + Welch correction or Mann Whitney test, * p < 0.05). Lower section, Immunoblotting of ATG7 and ACT. (b) As in Figure 1(a), but RAW264.7 MΦ were pretreated with 100 nM bafilomycin A1. Intracellular E. coli load in CFU relative to mean CFU under NS conditions (means ± s.e.m; n = 11–12; Student’s t test or Mann Whitney test, * p < 0.05).
Figure 7.
Figure 7.
NFAT5 is required for HS-facilitated targeting of intracellular E. coli to autolysosomes. (a to d) As in Figure 1(f), but non-silencing siRNA (ns siRNA) and Nfat5-specific siRNA (Nfat5 siRNA)-treated RAW264.7 MΦ were used. (a) Nfat5 mRNA levels (means ± s.e.m; n = 6; Student’s t test or Mann-Whitney test, * p < 0.05). (b) Immunoblotting of NFAT5 and ACT. (c) As (a), but Atg7 mRNA levels (means ± s.e.m; n = 6; Student’s t test ± Welch correction). (d) As (a), but Ulk1, Becn1, Atg4c and Atg2a mRNA levels (means ± s.e.m; n = 6; Student’s t test ± Welch correction; * p < 0.05). (e) Immunoblotting and densitometry of MAP1LC3B/LC3 and ACT ½ h after infection (n = 6; paired Student’s t test or Wilcoxon signed rank test; *p < 0.05). (f) As in Figure 1(f), but ns siRNA- and Nfat5 siRNA-treated RFP-GFP-mLC3 RAW264.7 MΦ were used. RFP+ and RFP+GFP+-puncta were counted per cell. At least 290 cells from two independent experiments (bars: median scores; Kruskal Wallis test with Dunn’s Multiple Comparison Test, * p < 0.05). (g) As Figure 1(f), but RAW264.7 MΦ were used and stained with LysoTracker. Colocalization of sfGFP-E. coli and LysoTracker per cell. At least 101 cells from at least two independent experiments (bars: median scores; Kruskal Wallis test with Dunn’s Multiple Comparison Test, * p < 0.05). (h) As in Figure 1(a), but ns siRNA- and Nfat5 siRNA-treated RAW264.7 MΦ were used. Intracellular E. coli load in CFU relative to mean CFU under NS conditions (means ± s.e.m; n = 11–12; Student’s t test ± Welch correction, * p < 0.05).
Figure 8.
Figure 8.
Blunted AKT and MTOR activation does not account for HS-augmented antibacterial activity. (a) As in Figure 1(f), RAW264.7 MΦ were pretreated ± 1 µM Torin1 and infected ± HS. Cells were harvested ½ h post infection. Immunoblots of p-AKT, AKT, MAP1LC3B and ACT levels are displayed. (b) As in (a), but 2 h post infection, NFAT5 and ACT levels were assessed. (c) As in (b), but RFP-GFP-mLC3 RAW264.7 MΦ were used. A representative confocal image out of two experiments is shown. Scale bar = 10 µm. (d) As in (c), but sCFP3A-E. coli were used. Rate of E. coli-sCFP3A/RFP-colocalization per cell. At least 184 MΦ from two independent experiments (bars: median scores; Mann Whitney test; * p < 0.05). (e) As in (b), but intracellular E. coli load is displayed 2 h after infection in CFU relative to mean CFU under NS conditions (means ± s.e.m; n = 23–24; ANOVA with Bonferroni’s test; * p < 0.05).
Figure 9.
Figure 9.
The presence of HIF1A is required for HS-triggered autophagy induction and antibacterial activity. (a and b) GSEA for negative (a) and positive (b) regulators of autophagy. Upper section, genes are placed in rank order based on differential expression between the groups on the x-axis and the curve represents the running enrichment score across the dataset. Bottom section, violin plot indicating the frequency distribution of the genes within the respective GO of positive enrichment of autophagy regulators by rank. (c) Heatmap of gene expression from own Agilent array. Genes plotted are genes within the HUGO autophagy regulatory gene set, which are upregulated and significantly differentially expressed (Benjamini Hochberg adjusted p value < 0.05) with the addition of NaCl to LPS-treated MΦ. (d) Left and right section, as in Figure 1(f), but Hif1a and Bnip3 mRNA levels were quantified (means ± s.e.m; n = 6; Student’s t test or Mann Whitney test; * p < 0.05). Middle section, HIF1A and ACT protein levels. (e to g) As in Figure 1(f), but ns siRNA- and Hif1a-specific siRNA (Hif1a siRNA)-treated RAW264.7 MΦ were used. (e) Upper section: HIF1A and ACT protein levels 4 h after infection. Lower section: MAP1LC3B and HSP90 as Figure 4(f). (f) Instead of RAW264.7 MΦ, RFP-GFP-mLC3 RAW264.7 MΦ were used. Confocal images: GFP, green; RFP, red. Scale bar = 10 µm. Representative images out of two experiments are shown. (g) As in Figure 1(f), intracellular E. coli load, CFU relative to mean CFU under ns siRNA-treated NS conditions (means ± s.e.m; n = 12; Mann Whitney test; * p < 0.05) (h) As in Figure 1(f), but BMDM from hif1a cKO and littermate controls were used. Intracellular E. coli load in CFU relative to mean CFU under NS conditions is displayed (means ± s.e.m; n = 18; Student’s t test or Mann Whitney test; * p < 0.05).
Figure 10.
Figure 10.
Schematic of mechanisms involved in HS-increased antibacterial activity of MΦ.

References

    1. Jantsch J, Schatz V, Friedrich D, et al. Cutaneous Na+ storage strengthens the antimicrobial barrier function of the skin and boosts macrophage-driven host defense. Cell Metab. 2015;21:493–501. PMID:25738463. - PMC - PubMed
    1. Ip WK, Medzhitov R.. Macrophages monitor tissue osmolarity and induce inflammatory response through NLRP3 and NLRC4 inflammasome activation. Nat Commun. 2015;6:6931 PMID:25959047. - PMC - PubMed
    1. Hucke S, Eschborn M, Liebmann M, et al. Sodium chloride promotes pro-inflammatory macrophage polarization thereby aggravating CNS autoimmunity. J Autoimmun. 2016;67:90–101. PMID:26584738. - PubMed
    1. Zhang WC, Zheng XJ, Du LJ, et al. High salt primes a specific activation state of macrophages, M(Na). Cell Res. 2015;25:893–910. PMID:26206316. - PMC - PubMed
    1. Miyakawa H, Woo SK, Dahl SC, et al. Tonicity-responsive enhancer binding protein, a Rel-like protein that stimulates transcription in response to hypertonicity. Proc Natl Acad Sci U S A. 1999;96:2538–2542. PMID:ISI:000078956600131. - PMC - PubMed

Publication types

MeSH terms