. 2019 May 2;177(4):1050-1066.e14.
doi: 10.1016/j.cell.2019.03.011. Epub 2019 Apr 11.

Volumetric Ca2+ Imaging in the Mouse Brain Using Hybrid Multiplexed Sculpted Light Microscopy

Affiliations

Volumetric Ca2+ Imaging in the Mouse Brain Using Hybrid Multiplexed Sculpted Light Microscopy

Siegfried Weisenburger et al. Cell. .

Abstract

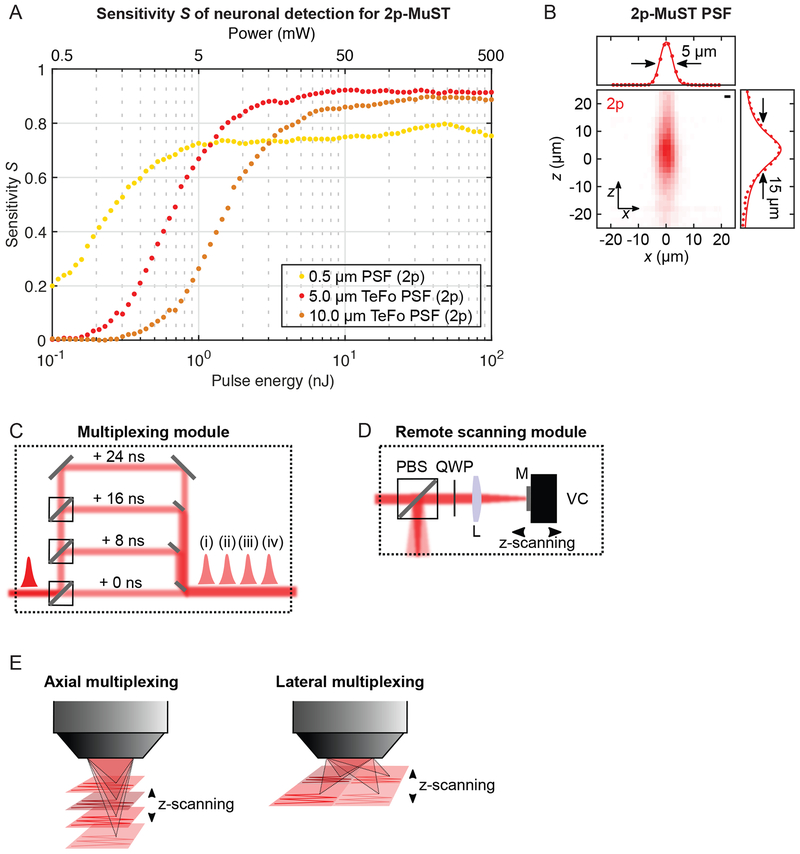
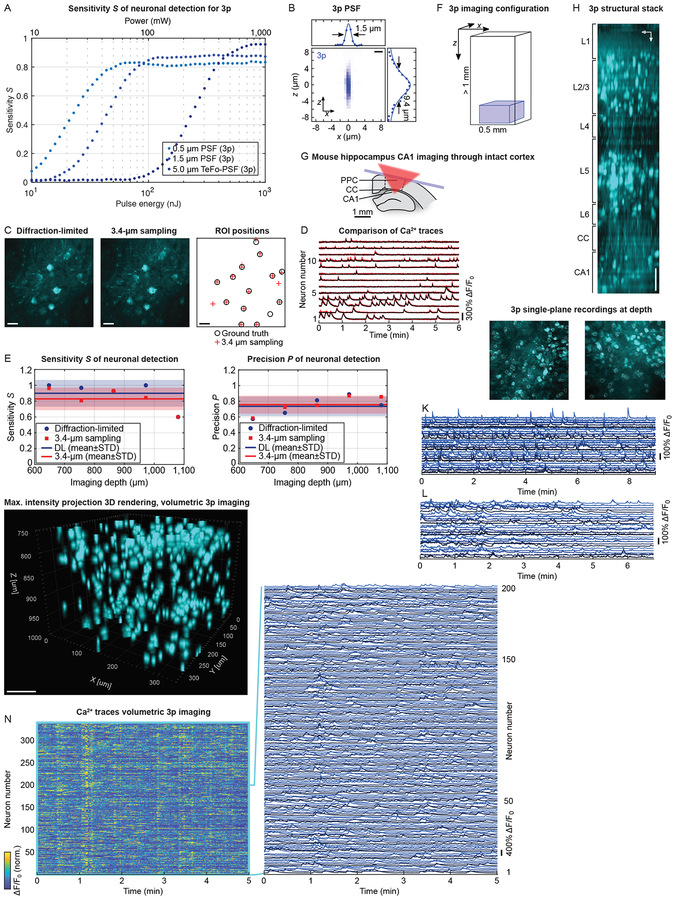
Calcium imaging using two-photon scanning microscopy has become an essential tool in neuroscience. However, in its typical implementation, the tradeoffs between fields of view, acquisition speeds, and depth restrictions in scattering brain tissue pose severe limitations. Here, using an integrated systems-wide optimization approach combined with multiple technical innovations, we introduce a new design paradigm for optical microscopy based on maximizing biological information while maintaining the fidelity of obtained neuron signals. Our modular design utilizes hybrid multi-photon acquisition and allows volumetric recording of neuroactivity at single-cell resolution within up to 1 × 1 × 1.22 mm volumes at up to 17 Hz in awake behaving mice. We establish the capabilities and potential of the different configurations of our imaging system at depth and across brain regions by applying it to in vivo recording of up to 12,000 neurons in mouse auditory cortex, posterior parietal cortex, and hippocampus.

Keywords: 2-photon; 3-photon; Ca(2+) imaging; circuit dynamics; cortical network; high-speed; light sculpting; microscopy; systems neuroscience; volumetric.


Conflict of interest statement

DECLARATIONS OF INTEREST

The authors declare no competing interests.

Figures

Fig. 1:
Fig. 1:. 2p-MuST microscope with remote scanning.
(A) Sensitivity S to evaluate power penalty in the microscope design for 2p excitation. Analysis for one-pulse-per-voxel acquisition, with DL (0.5μm, light orange), 5μm TeFo (red), and 10μm TeFo (orange) PSFs with 5μm sampling. Power values assume 5MHz repetition rate. (B) Experimental TeFo-PSF using a 0.5μm fluorescent bead. Scalebar: 2μm. (C) Multiplexing module creating four beamlets using PBS (polarizing beam splitters) and HWP (half wave plates), each delayed by 8ns respectively. (D) Remote scanning module with PBS (polarizing beam splitter), QWP (quarter wave plate) and mirror (M) mounted on a voice coil actuator (VC) modulating beam divergence for z-scanning. (E) Arrangement of TeFo-PSFs for the 4× axial and lateral multiplexing configuration of the 2p-MuST microscope.
Fig. 2:
Fig. 2:. High-speed volumetric 4×-axial 2p-MuST imaging of mouse PPC.
(A) Mouse brain region under test (PPC). (B) Configuration for 4×-axial 2p-MuST imaging. (C) Mirror holder chuck for 4× axial multiplexing. Scalebar: 5mm. (D) 3D rendering (MIP) of a 30min volumetric 4×-axial 2p-MuST recording in mouse PPC, 690×675×600μm FOV, 16.7Hz, cytosolic GCaMP6f. Scalebar: 100μm. See also Video S2. (E) Ca2+ traces of all 5,782 active neurons and zoom-in for 200 example neurons. (F) Treadmill velocity and behavioral state for subsequent analysis (locomotion: red). See also Video S1. (G) MIP of a 6min single-plane functional ground truth (2p DL) and simultaneous 2p-MuST recording at 390μm imaging depth, 165×165μm FOV, 10Hz, cytosolic GCaMP6f. See also Video S3. Right: Locations of the hand-annotated ground truth (black) and identified spatial components of the 2p-MuST recording (red). Scalebars: 20μm. (H) Ca2+ traces of all 14 active neurons from the 2p-MuST recording (red), matched to ground truth traces (black). (I) Experimental S and P scores of 2p-MuST (red) and DL recordings (blue) at varying imaging depths compared to human-annotated ground truth. Solid lines: mean; shaded area: SD (n=8 recordings).
Fig. 3:
Fig. 3:. High-speed volumetric 4×-lateral 2p-MuST imaging of mouse pAUD.
(A) Configuration for 4×-lateral 2p-MuST imaging. (B) Mouse brain region under test (pAUD). (C) 3D rendering (MIP) of a 20min volumetric 4×-lateral 2p-MuST recording in mouse pAUD, 1×1×0.6mm FOV, 5.1Hz, double-transgenic GCaMP6s. Scalebar: 100μm. See also Fig. S3, Video S4. (D) Pure tone (amplitude modulated) stimulus. (E) Examples of trial-averaged single-neuron post-stimulus responses to the pure tone stimuli. Dotted squares: best frequency response. Shaded area: SD (n=25–30 trials). (F) Frequency tuning curves for each neuron with high correlation to a pure tone stimulus. (G) Locations of the 2,743 neurons (out of 7,186 active) with high correlation to the pure tone stimulus. (H) Axial z-projection for the cortical layers 2/3a, and 3b/4. Black arrow: gradient of increasing best frequency. Anatomical coordinate system: L: lateral; R: rostral. Scalebar: 200μm. (I) Projection of a vertical slice along the black arrow and through the shaded area in panel H. Scalebar: 200μm. (J) Difference in best frequency as a function of axial position in panel I, and linear regression (red). F-statistics vs. constant model: p=0.167. Error bars: SD (n=1,014 neurons). (K) Best frequency as a function of position along the black arrow in panel H, and linear regression (red). F-statistics vs. constant model: ***p=1.27×10⁻⁵. Error bars: SD (n=1,014 neurons).
Fig. 4:
Fig. 4:. High-speed and volumetric 3p imaging at depth of mouse PPC and HPC through intact cortex.
(A) Sensitivity S (at median 3p imaging depth, 1mm) to evaluate power penalty in the microscope design for 3p. Analysis for one-pulse-per-voxel acquisition, and DL (0.5μm, turquoise), 1.5μm (blue), and 5μm TeFo-PSF (dark blue) with 3.4μm sampling. Power values assume 1MHz repetition rate. (B) Experimental 3p PSF using a 0.5μm fluorescent bead. Scalebar: 2μm. (C) MIP of a 6min single-plane functional ground truth (3p DL) and retrieved 3p recording with 3.4μm sampling in PPC at 800μm imaging depth, 170×170μm FOV, 78Hz, cytosolic GCaMP6f. Right: Locations of the hand-annotated ground truth (black) and of the spatial components for the 3p recording with 3.4μm sampling (red). Scalebars: 20μm. (D) Ca2+ traces of all 13 active neurons from the 3.4μm sampled 3p recording (red) matched to ground truth traces (black). (E) Experimental S and P scores of 3.4μm sampled 3p recordings (red) and DL 3p recordings (blue) at varying imaging depths compared to human-annotated ground truth. Solid lines: mean; shaded area: SD (n=5 recordings). (F) Configuration for high-speed and volumetric 3p imaging at depth. (G) HPC CA1 imaging through intact PPC and CC. (H) 3p structural stack showing neurons in PPC layers 1–6, CC and HPC CA1. Scalebar: 100μm. (I) MIP of a ~9min single-plane 3p recording in CA1 through intact cortex at 1.16mm depth, 340×340μm FOV, 78Hz, cytosolic GCaMP6s. Scalebar: 100μm. See also Video S5. (J) MIP of a ~7min single-plane 3p recording in CA1 through intact cortex at 1.22mm depth, 340×340μm FOV, 78Hz, cytosolic GCaMP6f. Scalebar: 100μm. (K) Example Ca2+ traces (out of 104 active) from the dataset in panel I. (L) Example Ca2+ traces (out of 72 active) from the dataset in panel J. (M) 3D rendering (MIP) of a 5min volumetric 3p recording in PPC layer 6b and HPC CA1 through intact cortex at 750–1,000μm depth, 340×340×250μm FOV, 3.9Hz, cytosolic GCaMP6f. Scalebar: 100μm. See also Video S6. (N) Ca2+ traces of all 346 active neurons and zoom-in for the dataset shown in panel M.
Fig. 5:
Fig. 5:. Volumetric HyMS microscopy of an entire cortical column in mouse PPC.
(A) HyMS microscope configuration. Red: 2p, blue: 3p excitation volume. (B) 3D rendering (MIP) of a 10min HyMS recording in PPC, 665×730×1,000μm FOV, 13.0Hz (4.3Hz: 3p sub-volume), cytosolic GCaMP6f (green: 2p, cyan: 3p). Scalebar: 100μm. (C) Ca2+ traces of all 4,121 (2p: 3,995 (green); 3p: 126 (blue)) active neurons and zoom-in of example traces. White rectangles: traces in panel E. (D) Treadmill velocity and assigned behavioral state for subsequent analysis (locomotion: red). (E) Zoom-in of activity traces marked in panel C during a locomotion episode showing activity onset. (F) Histogram of active neurons as a function of imaging depth. (G) Spearman correlation coefficient (R) matrix from all traces in panel C, grouped by layer 1–6 and agglomerative hierarchical clustering. Left side: Pearson’s correlation coefficient of each Ca2+ trace with the treadmill velocity in panel D. Black and white triangles: clusters discussed in the main text. (H) Number of PCs explaining 95% of the variance of the dataset in panel C for the behavioral states ‘during locomotion’ (blue) and ‘stationary periods’ (red). Error bars: SD (n=300 permutations).
Fig. 6:
Fig. 6:. Simultaneous volumetric HyMS microscopy of mouse HPC CA1 and DG.
(A) Mouse brain with implanted conical cannula on top of HPC and aspirated cortex. (B) 3D rendering (MIP) of a 15min HyMS recording in HPC, 665×730×800μm FOV, 13.0Hz (4.3Hz: 3p sub-volume), cytosolic GCaMP6f (green: 2p, cyan: 3p). Scalebar: 100μm. (C) Ca2+ traces of all 1,465 (2p: 1,415 (green); 3p: 50 (blue)) active neurons and zoom-in of example traces. White rectangles: traces in panel E. (D) Spearman correlation coefficient (R) matrix from all traces in panel C, grouped by HPC region and agglomerative hierarchical clustering. Left side: Pearson’s correlation coefficient of each Ca2+ trace with the treadmill velocity in panel D. Black triangles: clusters discussed in the main text. (E) Ca2+ traces in panel C sorted by lag time for a locomotion episode. Numbers: cell populations discussed in the main text. (F) Lag time histogram for all Ca2+ traces in panel C. (G) Histogram of active neurons for the cell populations in panel E as a function of imaging depth.
Fig. 7:
Fig. 7:. Simultaneous volumetric imaging of mouse PPC layers 1–5 and HPC CA1 using HyMS microscopy.
(A) HyMS microscope configuration. Red: 2p, blue: 3p excitation volume. (B) 3D rendering (MIP) of a 10min HyMS recording in PPC and underlying HPC CA1, 720×665×1,100μm total volume (recorded from 100–700μm and 950–1,100μm depth), 13.8Hz (4.6Hz: 3p sub-volume), cytosolic GCaMP6f (green: 2p, cyan: 3p). Scalebar: 100μm. See also Video S7. (C) Ca2+ traces of all 2,395 (2p: 2,268 (green); 3p: 127 (blue)) active neurons and zoom-in of example traces. White rectangles: traces in panel E. (D) Treadmill velocity of the recording in panel C and behavioral state for subsequent analysis (locomotion: red). (E) Zoom-in of the activity traces marked in panel C during a locomotion episode showing activity onset. (F) Spearman correlation coefficient (R) matrix from all traces in panel C, grouped by brain region (PPC layer and HPC CA1) and agglomerative hierarchical clustering. Left side: Pearson’s correlation coefficient of each Ca2+ trace with the treadmill velocity in panel D. Black and white polygons: clusters discussed in the main text. (G) I(X1;X2,…,Xn) for the timeseries in panel C (blue) and ‘Shuffled’ (red), and the behavioral states ‘during locomotion’ and ‘stationary periods’. Shaded area: SD (n=300 permutations). P-value: Wilcoxon rank-sum test (between Experiment and Shuffled).

References

    1. Ahmed OJ, and Mehta MR (2009). The hippocampal rate code: anatomy, physiology and theory. Trends Neurosci 32, 329–338. - PMC - PubMed
    1. Allen Institute for Brain Science (2018). Allen Brain Atlas: Mouse Brain. mouse.brain-map.org.
    1. Amir W, Carriles R, Hoover EE, Planchon TA, Durfee CG, and Squier JA (2007). Simultaneous imaging of multiple focal planes using a two-photon scanning microscope. Opt Lett 32, 1731–1733. - PubMed
    1. Andrasfalvy BK, Zemelman BV, Tang J, and Vaziri A (2010). Two-photon single-cell optogenetic control of neuronal activity by sculpted light. PNAS 107, 11981–11986. - PMC - PubMed
    1. Barrett AB, and Seth AK (2011). Practical Measures of Integrated Information for Time-Series Data. PLoS Comput Biol 7, e1001052. - PMC - PubMed

Publication types