. 2019 May 2;177(4):852-864.e14.
doi: 10.1016/j.cell.2019.03.009. Epub 2019 Apr 11.

Promoter-Intrinsic and Local Chromatin Features Determine Gene Repression in LADs

Affiliations

Promoter-Intrinsic and Local Chromatin Features Determine Gene Repression in LADs

Christ Leemans et al. Cell. .

Abstract

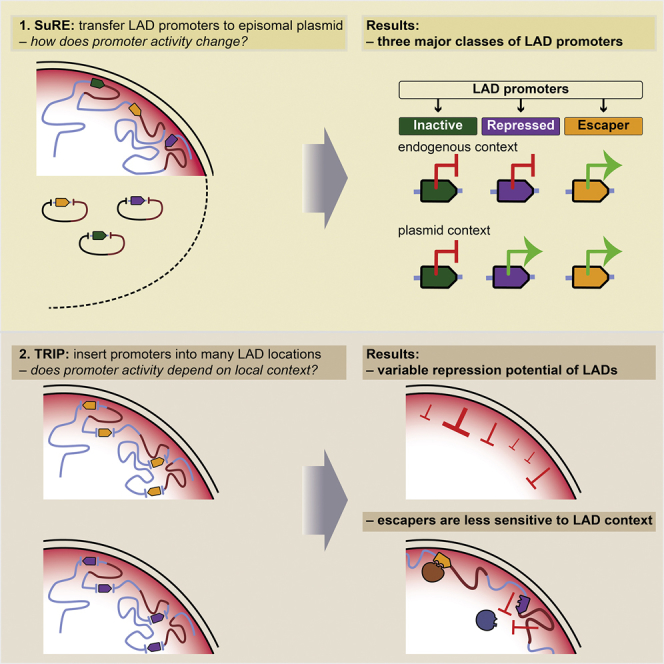
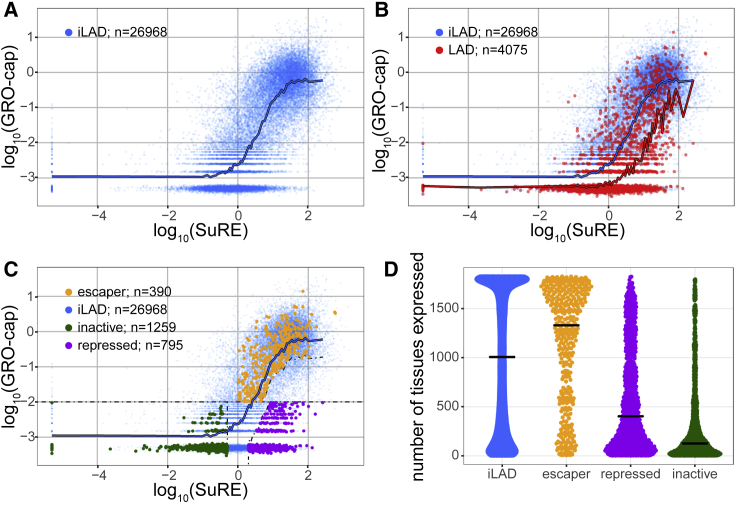
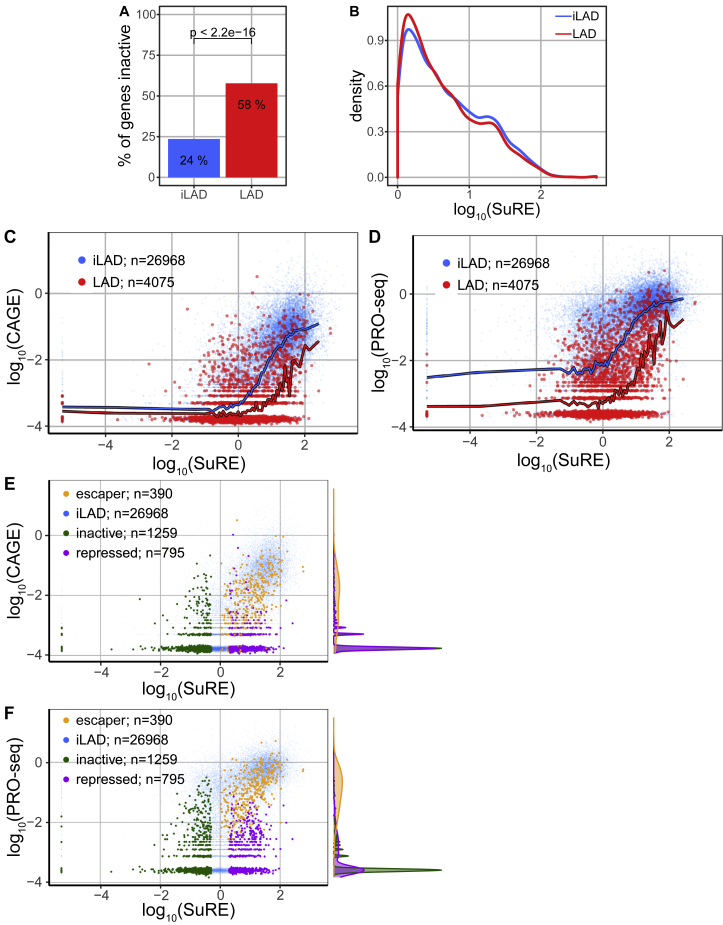
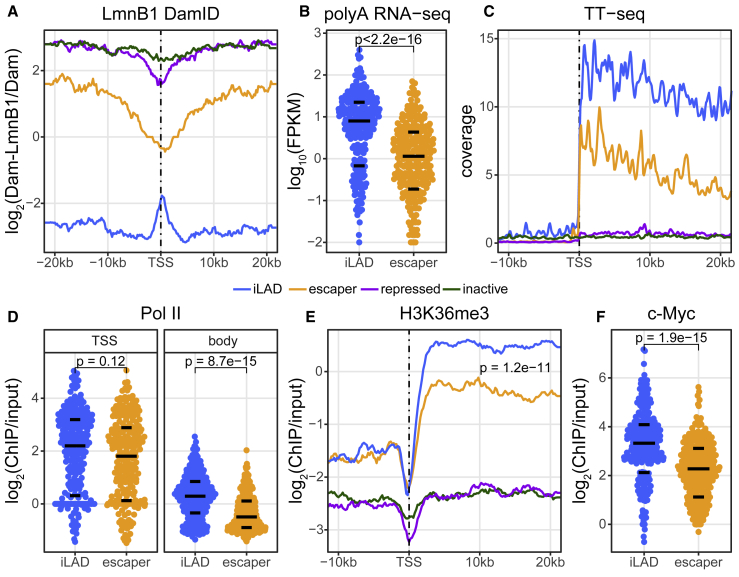
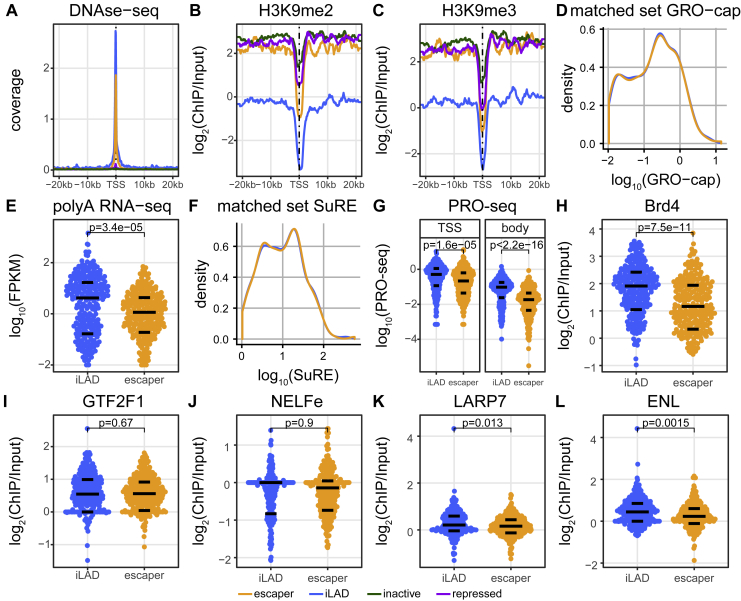
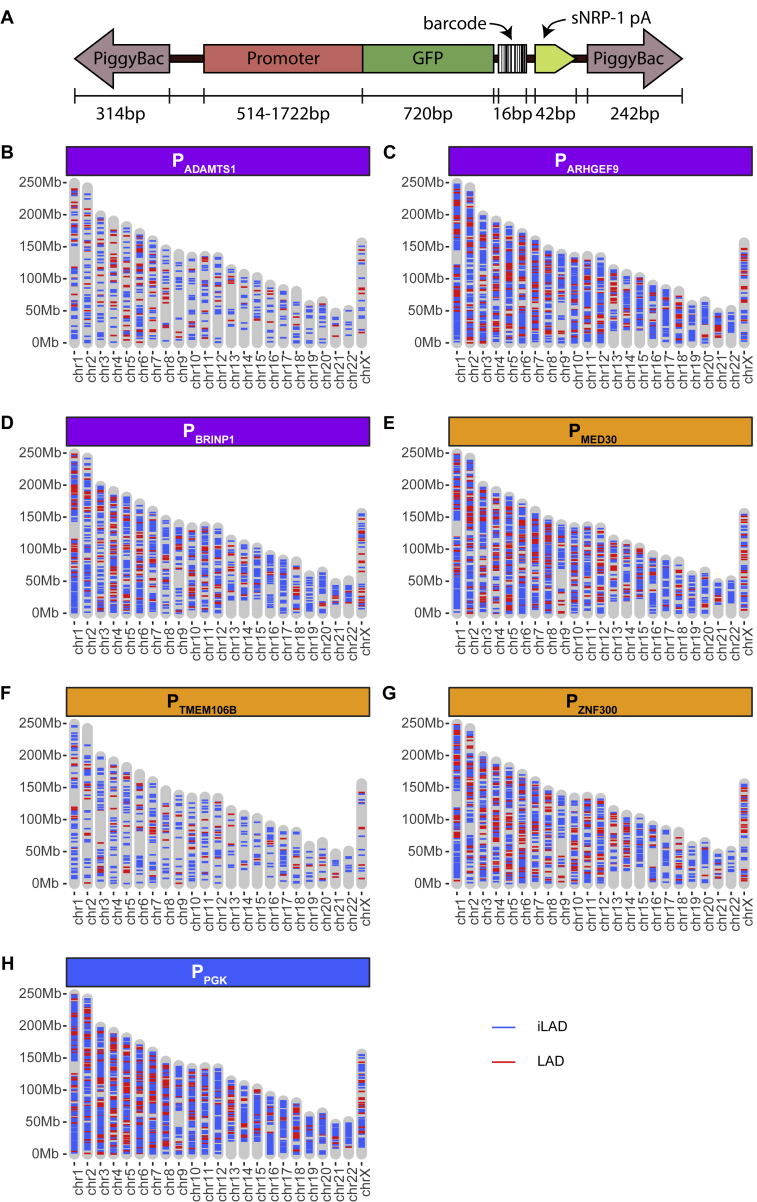
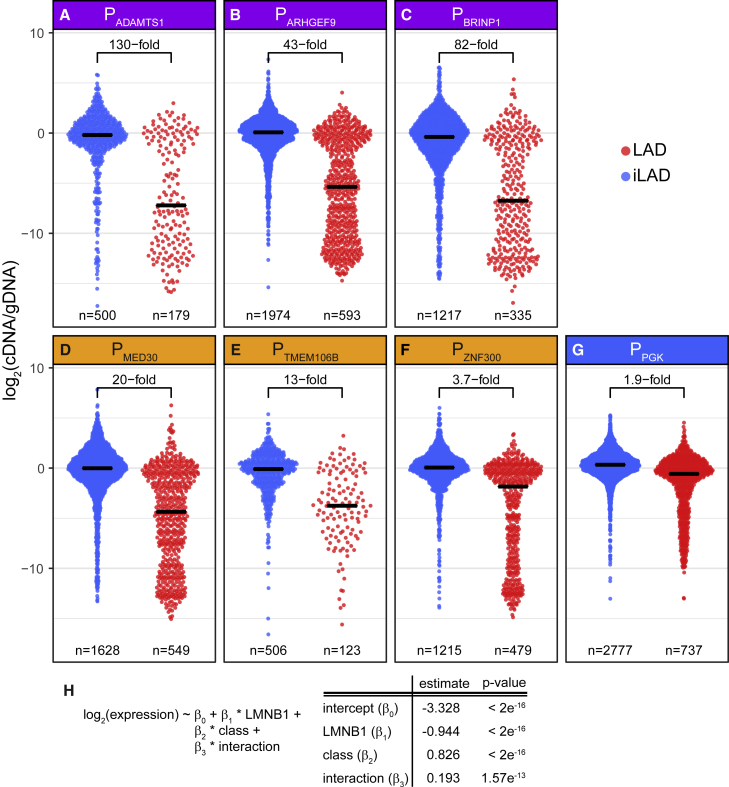
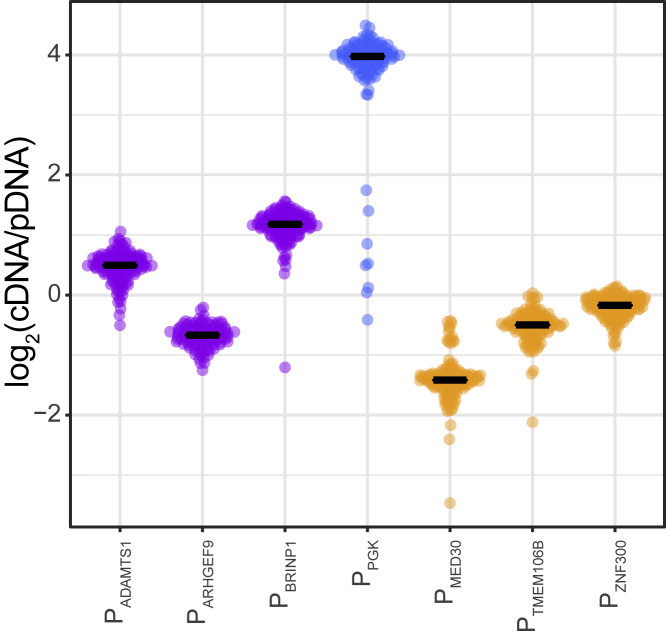
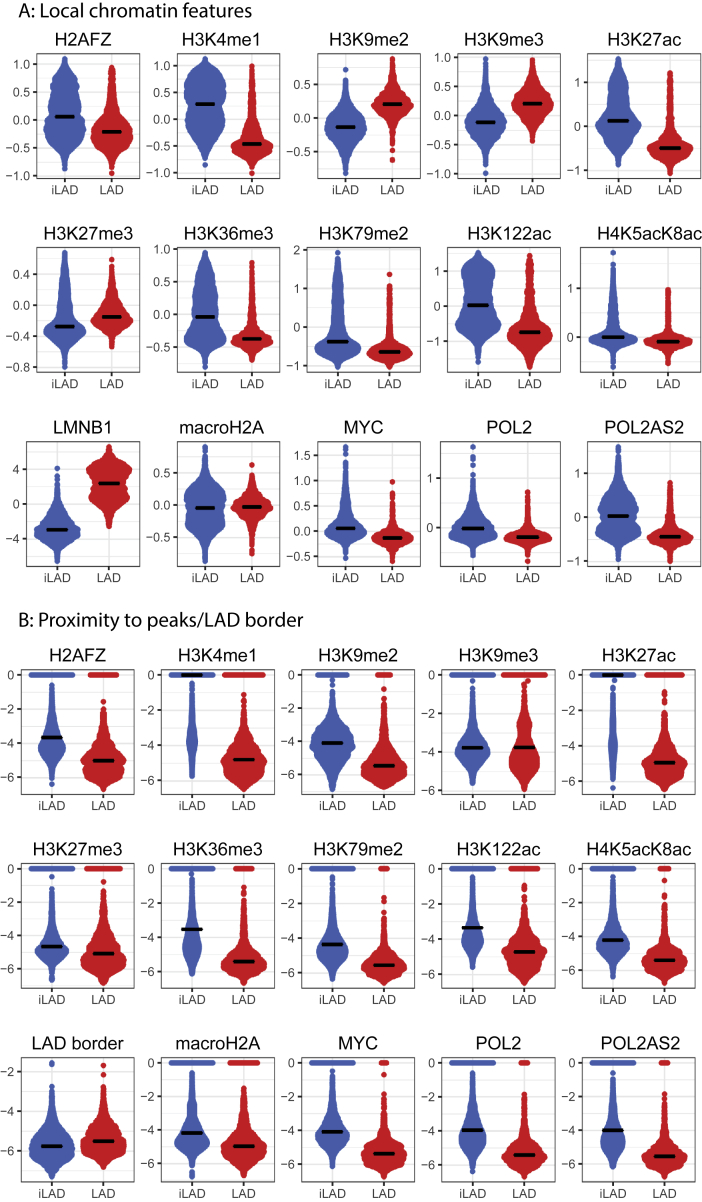
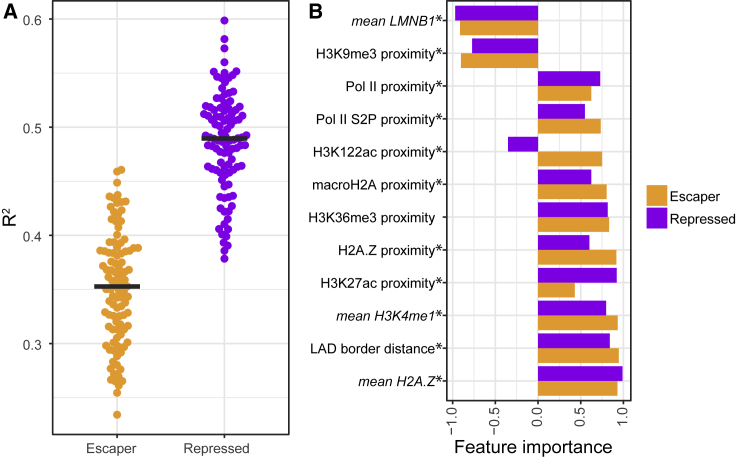
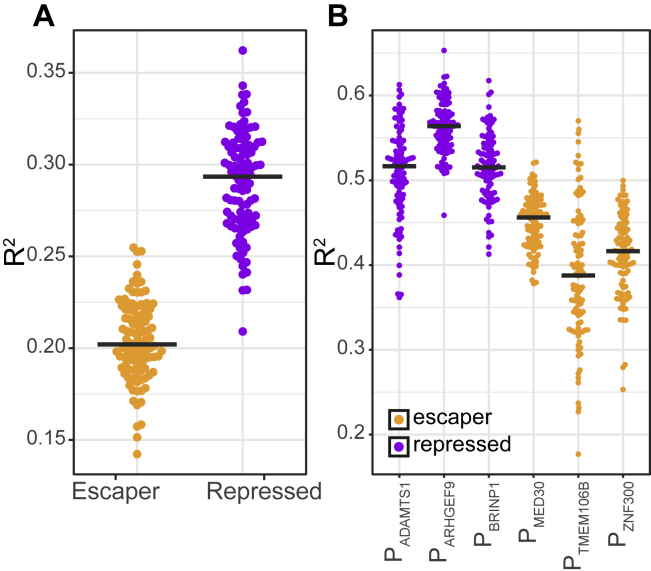
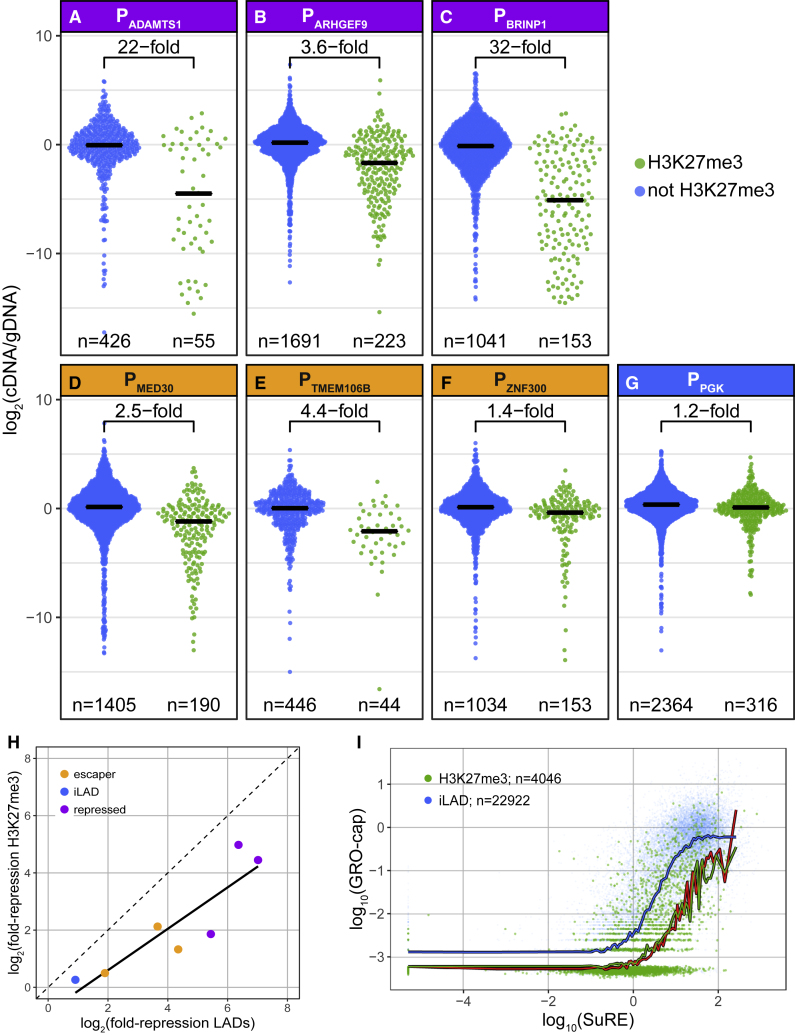
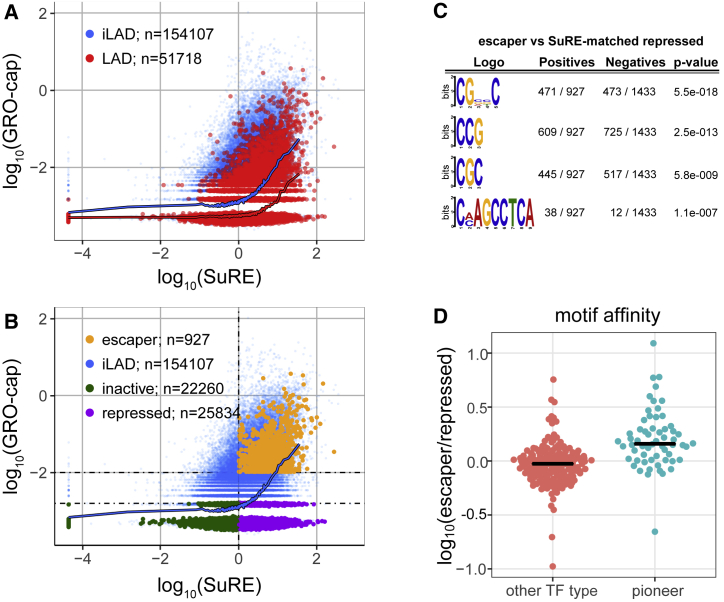
It is largely unclear whether genes that are naturally embedded in lamina-associated domains (LADs) are inactive due to their chromatin environment or whether LADs are merely secondary to the lack of transcription. We show that hundreds of human promoters become active when moved from their native LAD position to a neutral context in the same cells, indicating that LADs form a repressive environment. Another set of promoters inside LADs is able to "escape" repression, although their transcription elongation is attenuated. By inserting reporters into thousands of genomic locations, we demonstrate that escaper promoters are intrinsically less sensitive to LAD repression. This is not simply explained by promoter strength but by the interplay between promoter sequence and local chromatin features that vary strongly across LADs. Enhancers also differ in their sensitivity to LAD chromatin. This work provides a general framework for the systematic understanding of gene regulation by repressive chromatin.

Keywords: GRO-cap; SuRE; chromatin; lamina-associated domains; massive parallel reporter assay; promoters; repression; thousands of reporters integrated in parallel.


Figures

None
Graphical abstract
Figure 1
Figure 1
Promoters Respond Differently to Their LAD Environment (A) Relation between promoter activity in the native context (GRO-cap) and in episomal plasmid context (SuRE) for all inter-LAD (iLAD) promoters (blue dots). Blue line shows sliding window average with a bin size of 501 promoters along the SuRE expression axis. GRO-cap data are from Core et al. (2014); SuRE data are from van Arensbergen et al. (2017). (B) Comparison of all promoters in LADs (red) and iLAD regions (blue). Red line shows sliding window average of LAD promoters, similar to blue line in (A). (C) Same as in (B) but with three classes of LAD promoters highlighted in green, purple, and yellow. Dotted lines depict cutoff lines used for the definitions (see STAR Methods). (D) Promoter classes differ in their tissue expression distributions. Plot shows the number of tissues and cell types (out of 1,829) in which promoter activity was detected by FANTOM study (Forrest et al., 2014). Each dot represents a promoter in either iLADs (blue) or one of the three LAD promoter classes (yellow, purple, and green). See also Figure S1 and Data S1.
Figure S1
Figure S1
Promoters with SuRE Activity Inactive in Endogenous Context, Related to Figure 1 (A) Percentage of promoters active in episomal plasmid context (log10(SuRE) > 0) with no measurable activity in native context (log10(GRO-cap) < −3), for LAD promoters and a subset of iLAD promoters matched on SuRE activity. (B) Distributions of expression levels in episomal plasmid context (log10(SuRE)) of matched promoter sets used in (A). (C) Comparison between endogenous (log10(CAGE)) and episomal (log10(SuRE)) expression for all promoters in LADs (red) and iLAD regions (blue). Similar to Figure 1B, but with CAGE instead of GRO-cap. Blue and red lines are sliding window averages with a bin size of 501 promoters along the SuRE expression axis. (D) Same analysis as in Figures 1B and S1C, but with log10(PRO-seq) as a measure of endogenous expression. (E) Comparison between CAGE and SuRE for the three classes of LAD promoters as defined in Figure 1C. (F) Comparison between PRO-seq and SuRE for the three classes of LAD promoters as defined in Figure 1C.
Figure 2
Figure 2
Properties of Escaper Promoters and Their Genes in Native Context (A) Average NL interaction profile around each promoter class according to DamID-seq of Lamin B1. Note the local detachment of escaper promoters. Data are average of two independent experiments. Only genes were included that are at least 20 kb long, and for genes in iLADs, only those that do not have any other gene within 40 kb upstream of the TSS were used. (B) Total mRNA expression level of genes driven by escaper promoters compared to a set of genes driven by iLAD promoters with matching GRO-cap activity (blue; distribution of GRO-cap values in Figure S2D). mRNA-seq data are from Dunham et al. (2012). (C) Average TT-seq profile of matched promoter sets in (B) (Figure S2D) and the complete set of repressed and inactive promoters. Data are from Schwalb et al. (2016). (D) ChIP-seq signals of RNA polymerase II around the TSSs (−50 to +300 bp; left) and along the gene bodies (+300 bp from the TSS to +3,000 bp downstream of the transcription termination site) of genes driven by each promoter set as in (B) (Figure S2D). Data are from Dunham et al. (2012). (E) Average H3K36me3 signals along genes driven by each matched promoter set in (B) (Figure S2D) and the complete set of repressed and inactive promoters. p values are calculated for differences along gene body. Data are from Schmidl et al. (2015). (F) ChIP-seq signals of c-Myc protein (Dunham et al., 2012) at each promoter set as in (B) (Figure S2D). Black horizontal lines in (B), (D), and (E) depict 25th, 50th, and 75th percentiles. p values in (B), (D), (E), and (F) are from a Wilcoxon rank-sum test. See also Figure S2, Data S1, and Table S2.
Figure S2
Figure S2
Properties of Escaper Promoters and Their Genes in Native Context, Related to Figure 2 (A) Average DNase-seq profile of each promoter class. Data are from (Dunham et al., 2012). (B and C) Average H3K9me2 (B) and H3K9me3 (C) signals around each promoter class according to ChIP-seq. Data are from (Salzberg et al., 2017). (D) Distribution of GRO-cap signals of the matched sets of iLAD and escaper promoters used in Figures 2B–2F, S2A–S2C, and S2G–S2L. Promoters in iLADs were matched on GRO-cap activity of escaper promoters. (E) Same as Figure 2B, but with iLAD promoters matched on SuRE activity. (F) Distribution of SuRE values of the matched sets of iLAD and escaper promoters analyzed in (E). (G) PRO-seq signals at TSS and gene bodies of matched gene sets as in (D). (H–L) ChIP-seq signals of proteins that have been implicated in regulation of elongation, on matched promoter sets as in (D). Data in (H) are from (Tyler et al., 2017); in (I-L) from (Dunham et al., 2012).
Figure S3
Figure S3
TRIP Construct and Mapping of Integrations, Related to Figures 3, 5, and 6 (A) TRIP construct design. PiggyBac: terminal repeat regions of PiggyBac transposon; GFP: green fluorescent protein open reading frame; sNRP-1 pA: poly-A signal. (B–H) Locations of TRIP reporter integrations that could be uniquely mapped to the genome and assigned to a unique barcode, for each promoter. Red: integrations in LAD, blue: integrations in iLADs.
Figure 3
Figure 3
Effects of LAD Context on Expression of Integrated Reporters Driven by Various Promoters (A–G) Distributions of expression levels of barcoded reporters integrated in iLADs (blue) and LADs (red). Reporters were driven by the indicated LAD promoters from the repressed (purple, A–C) or escaper (yellow, D–F) class or by the iLAD-derived PGK promoter (blue, G). Horizontal black bars indicate medians; the fold difference between the medians in iLADs and LADs are indicated. n denotes the number of integrated reporters assayed. Data are averages of two independent experiments. (H) Summary of a linear regression model of the expression levels of the integrated reporters as function of the local Lamin B1 DamID signal, the promoter class (escaper or repressed), and the interaction between promoter class and local DamID signal. All three terms contribute significantly to the model. Only LAD integrations from (A)–(F) were used in the model. See also Figure S3, Data S2, and Table S1.
Figure 4
Figure 4
Precise Measurement of Promoter Activities in Episomal Plasmid Context Each indicated promoter was cloned in the same promoter-less reporter plasmid with about 100 different random barcodes. A pool of the resulting ∼700 plasmids was transiently transfected into K562 cells. Barcodes were counted in cDNA and plasmid DNA isolated from these cells after 2 days. The plot shows the distribution of expression levels of all barcodes sorted by promoter; horizontal lines depict medians. Data are average of at least two independent experiments.
Figure S4
Figure S4
Chromatin Features Used for Modeling TRIP Expression, Related to Figure 5 (A) Distributions of log2(signal/control) values (ChIP or DamID) for 5 kb regions centered on TRIP integration sites, for each feature used as input for the modeling in Figure 5. (B) Distributions of the proximities (log10(distance[bp]+1)) of TRIP integrations to the nearest peak or domain of each feature used as input for the modeling in Figure 5.
Figure 5
Figure 5
Modeling TRIP Expression Levels as Function of LAD Chromatin Features (A) R2 values of 100 lasso regression models of TRIP data for escaper and repressor promoters (see STAR Methods). Each dot represents a model. Black lines represent the median R2 values. (B) Feature importance analysis of the most predictive chromatin features. Feature importance (x axis) represents the fraction of bootstrap-lasso models (out of 1,000), in which a feature contributed significantly to the model performance. Negative and positive values of feature importance reflect negative and positive coefficient values, respectively. Asterisks mark significant (p < 0.001) differences between repressed and escaper promoters. Mean signal intensities of chromatin features in a window around the integration site (5 kb for ChIP; 10 kb for DamID) as well as the proximity to the nearest peak of the same features were taken into account. The distributions of input values of all features that were tested are shown in Figure S4. Only data from integrations inside LADs of the three repressed and three escaper promoters were used. See also Figures S3, S4, and S5, Data S2, and Table S2.
Figure S5
Figure S5
Modeling TRIP Expression Levels as Function of Chromatin Features, Related to Figure 5 (A) Distribution of R2 values of 100 lasso regression models of TRIP data for escaper and repressed promoters using integrations in iLADs only. Black lines represent the median R2 values. (B) Distribution of R2 values of 100 lasso regression models of TRIP data for individual promoters using all available integrations (both LAD and iLAD). Black lines represent the median R2 values.
Figure 6
Figure 6
Effects of H3K27me3 Domain Context on Promoter Activity (A–G) Distribution of expression levels of barcoded reporters in iLAD regions that overlap with H3K27me3 domains (green), or not (blue). Data are from the same experiments as in Figures 3A–3G, with promoters of the repressed (purple; A–C) or escaper (yellow; D–F) class, or the iLAD-derived PGK promoter (blue; G). Horizontal black bars indicate medians; the fold-difference between the medians inside and outside of H3K27me3 regions is indicated for each promoter. n denotes the number of integrated reporters assayed. Data are averages of two independent experiments. (H) Correlation between repressive effect of LADs (fold difference between LAD and iLAD median expression; Figures 3A–3G) and H3K27me3 domains (fold difference between H3K27me3 domain and non-H3K27me3 domain median expression; Figures 6A–6G) for the seven promoters tested by TRIP. (I) SuRE versus GRO-cap analysis as in Figure 1B for iLAD promoters located in H3K27me3 domains (green) compared to iLAD promoters not located in H3K27me3 domains (blue). Red curve shows LAD promoter trend line as in Figure 1B. See also Figure S3 and Data S2.
Figure 7
Figure 7
LAD Repression of Enhancer RNA Production; Effect of Pioneer TF Binding Sites (A) Comparison of enhancers in LADs (red) and iLADs (blue), similar to Figure 1B. Each dot represents a previously annotated enhancer (Fishilevich et al., 2017). (B) Same as in (A), with three classes of LAD enhancers highlighted in green, purple, and yellow. Dotted lines depict cutoff lines used for the definitions (see STAR Methods). (C) Sequence logos of enriched motifs in escaper enhancers compared to a set of repressed enhancers matched on SuRE activity. Motifs were identified by DREME (Bailey, 2011). (D) Fold difference in median predicted affinity of enhancers for TFs. Each dot represents one TF that is detectably expressed in K562, separated into pioneer and non-pioneer TFs according to Ehsani et al. (2016). Predicted affinity of each TF for each enhancer was calculated using the AffinityProfile from the REDUCE Suite (Roven and Bussemaker, 2003). See also Data S3.

References

    1. Abugessaisa I., Noguchi S., Hasegawa A., Harshbarger J., Kondo A., Lizio M., Severin J., Carninci P., Kawaji H., Kasukawa T. FANTOM5 CAGE profiles of human and mouse reprocessed for GRCh38 and GRCm38 genome assemblies. Sci. Data. 2017;4:170107. - PMC - PubMed
    1. Akhtar W., de Jong J., Pindyurin A.V., Pagie L., Meuleman W., de Ridder J., Berns A., Wessels L.F.A., van Lohuizen M., van Steensel B. Chromatin position effects assayed by thousands of reporters integrated in parallel. Cell. 2013;154:914–927. - PubMed
    1. Akhtar W., Pindyurin A.V., de Jong J., Pagie L., Ten Hoeve J., Berns A., Wessels L.F.A., van Steensel B., van Lohuizen M. Using TRIP for genome-wide position effect analysis in cultured cells. Nat. Protoc. 2014;9:1255–1281. - PubMed
    1. Allshire R.C., Madhani H.D. Ten principles of heterochromatin formation and function. Nat. Rev. Mol. Cell Biol. 2018;19:229–244. - PMC - PubMed
    1. Amendola M., Venneri M.A., Biffi A., Vigna E., Naldini L. Coordinate dual-gene transgenesis by lentiviral vectors carrying synthetic bidirectional promoters. Nat. Biotechnol. 2005;23:108–116. - PubMed

Publication types