Clinical Trial
. 2019 May 16;177(5):1330-1345.e18.
doi: 10.1016/j.cell.2019.03.005. Epub 2019 Apr 11.

A Single-Cell Atlas of the Tumor and Immune Ecosystem of Human Breast Cancer

Affiliations
Clinical Trial

A Single-Cell Atlas of the Tumor and Immune Ecosystem of Human Breast Cancer

Johanna Wagner et al. Cell. .

Abstract

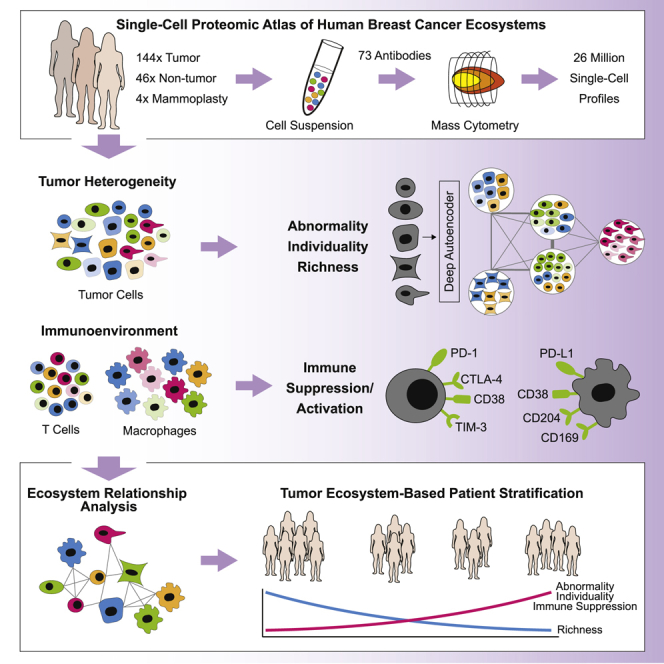
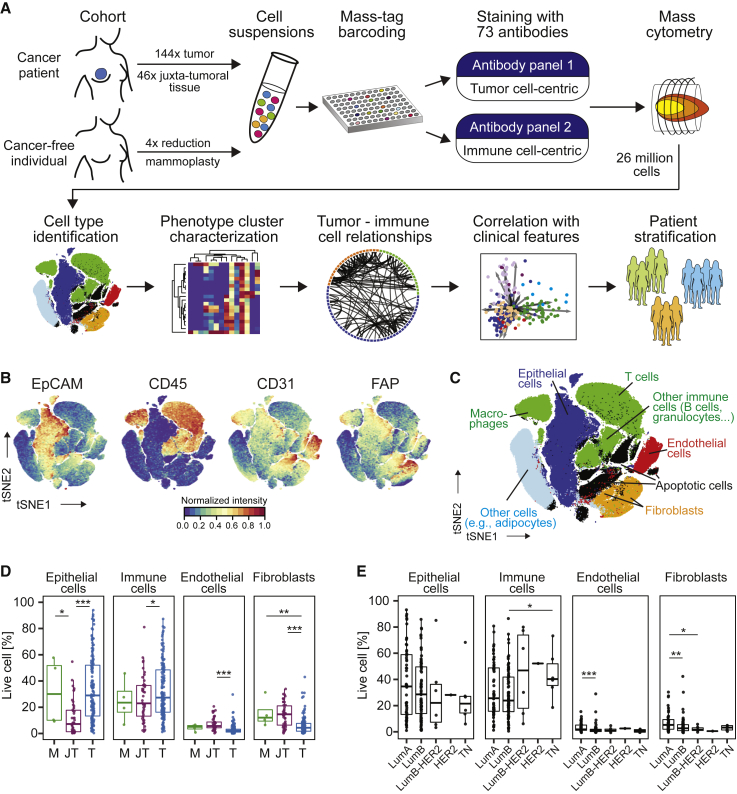
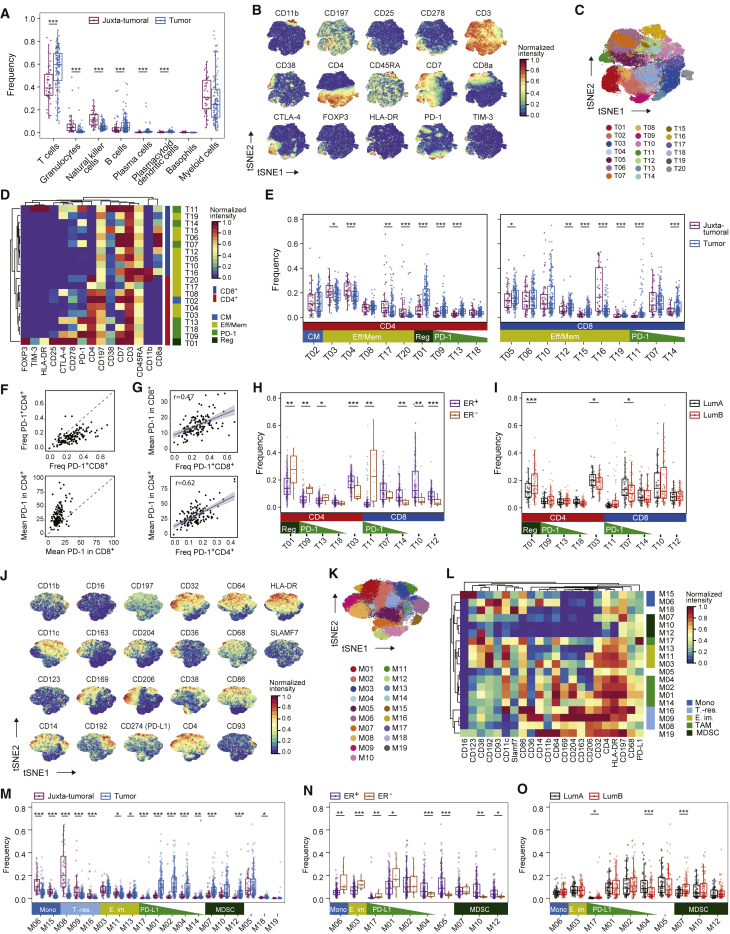
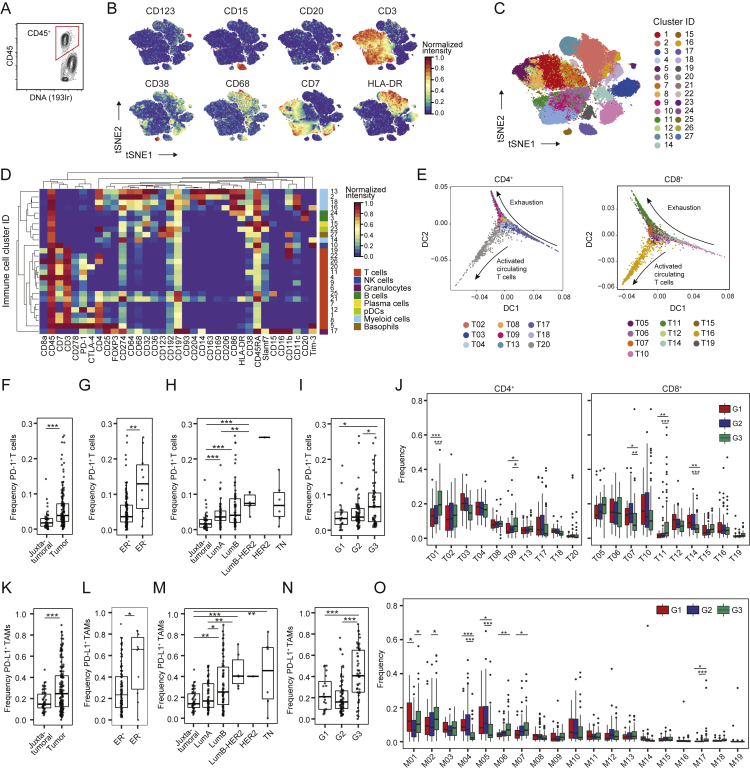
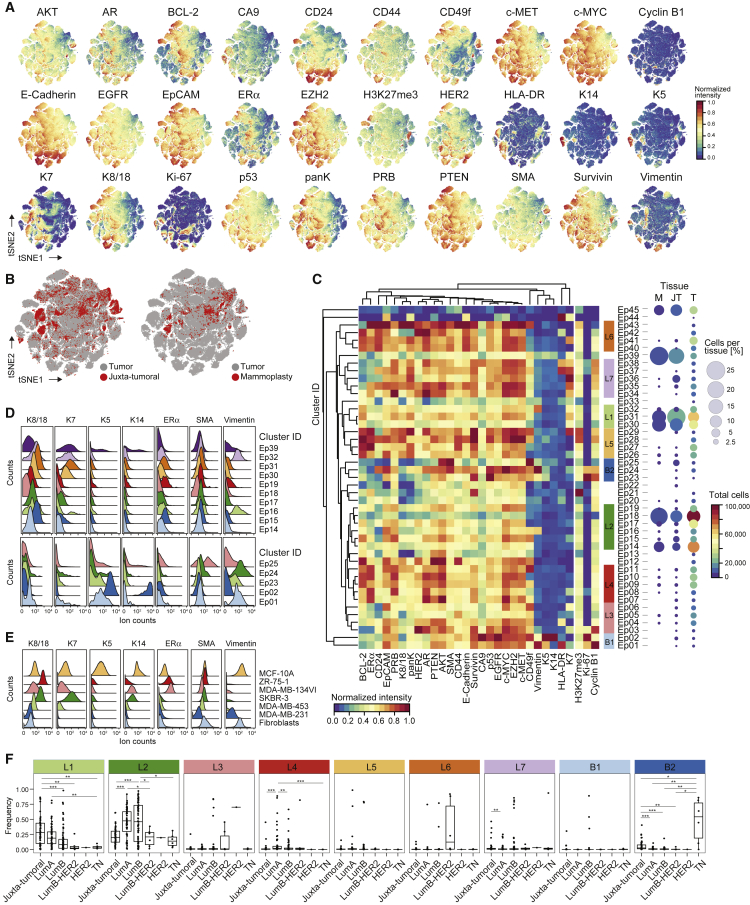
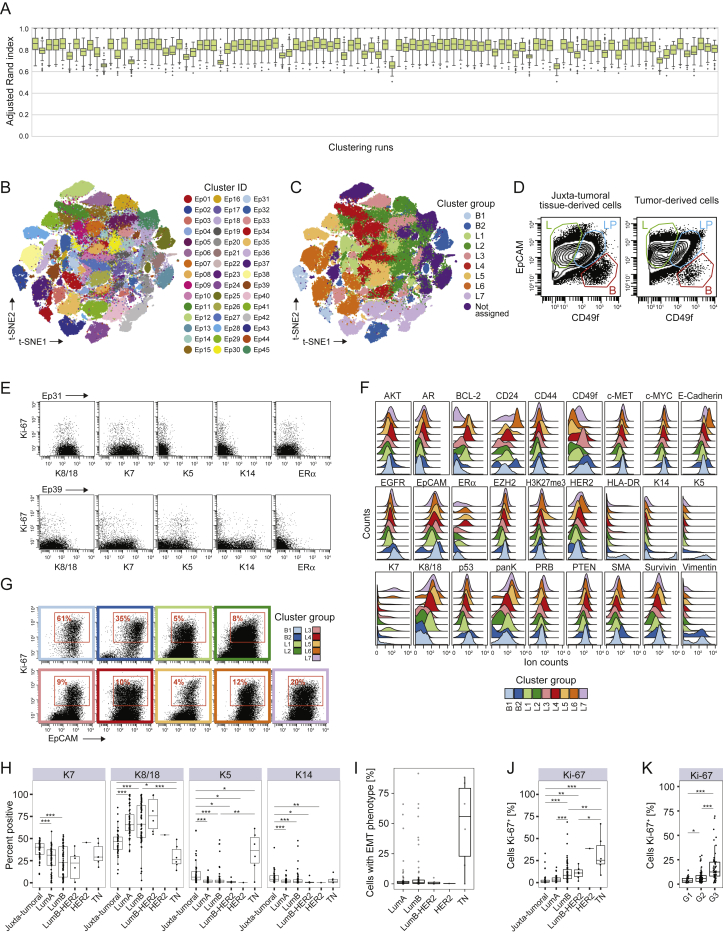
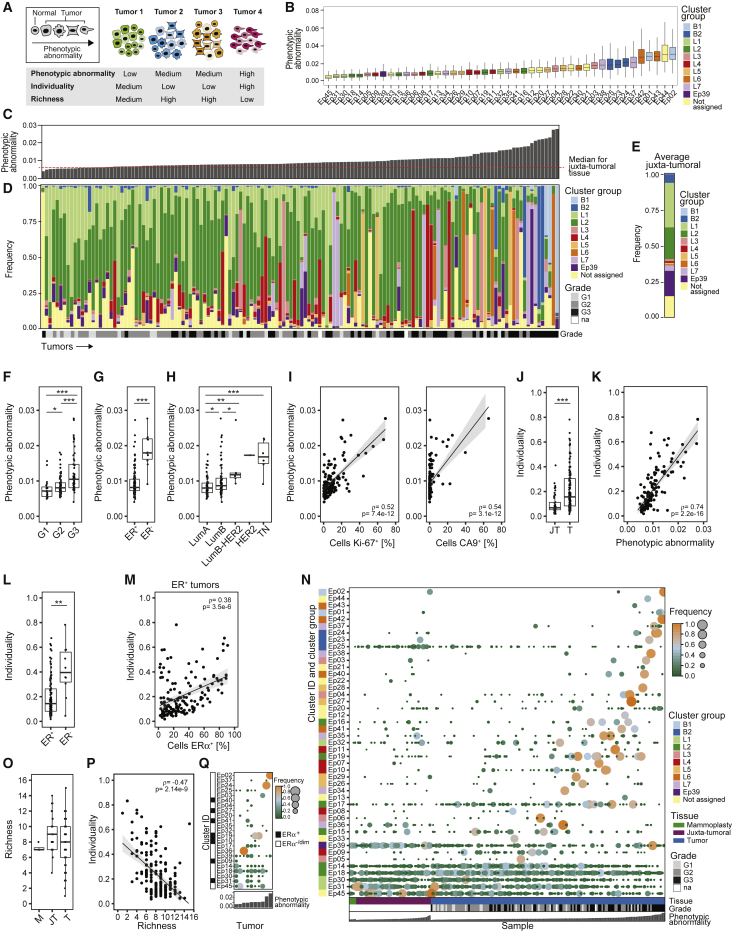
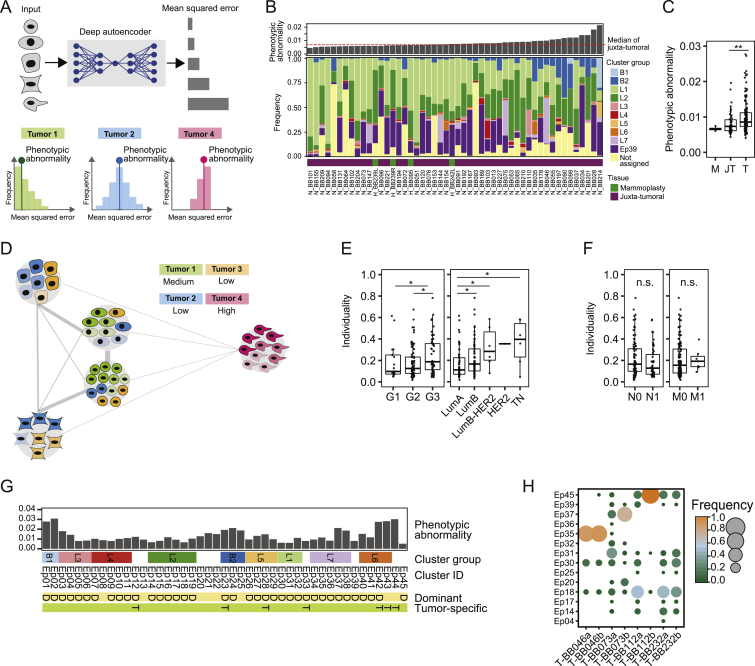
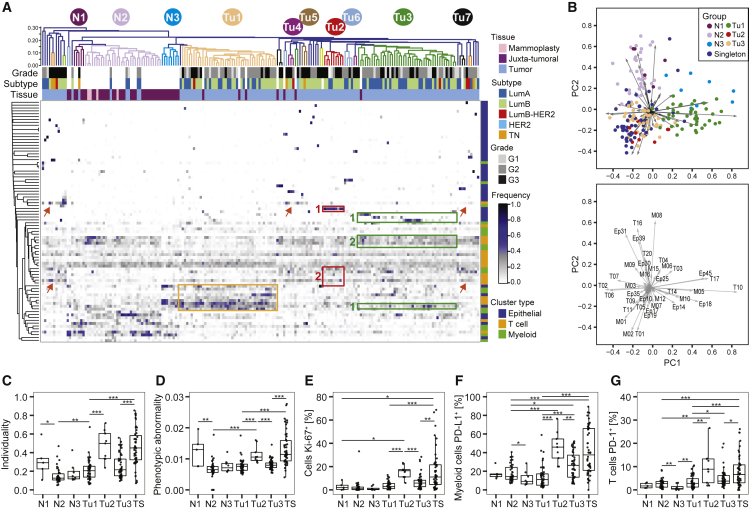
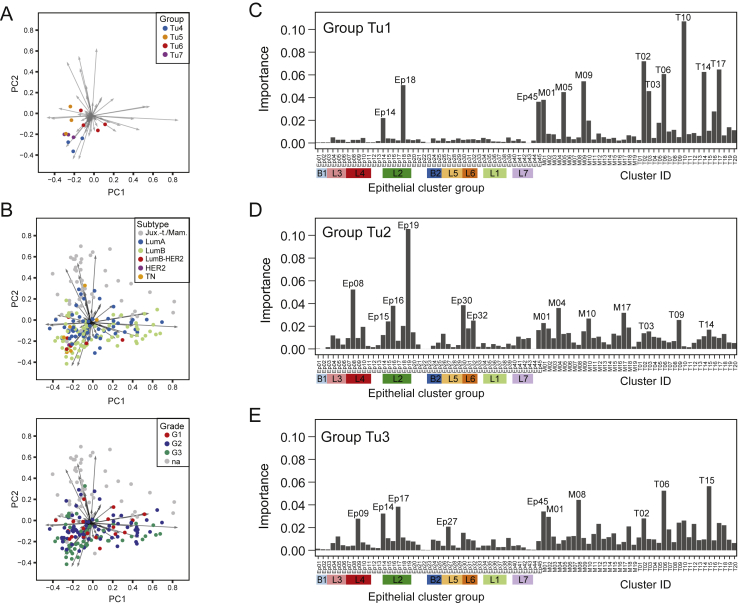
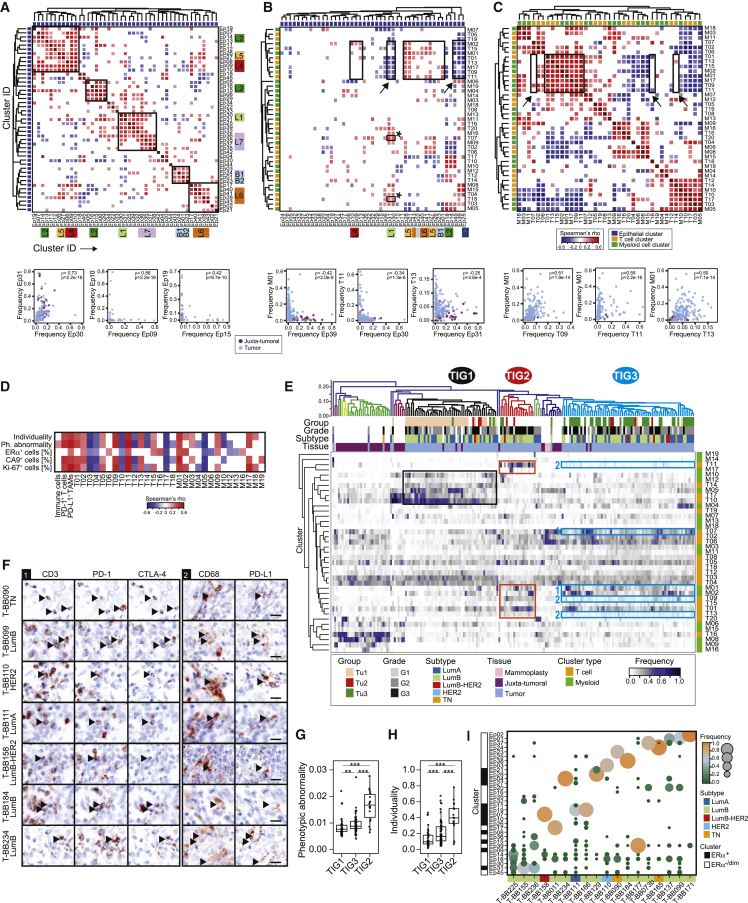
Breast cancer is a heterogeneous disease. Tumor cells and associated healthy cells form ecosystems that determine disease progression and response to therapy. To characterize features of breast cancer ecosystems and their associations with clinical data, we analyzed 144 human breast tumor and 50 non-tumor tissue samples using mass cytometry. The expression of 73 proteins in 26 million cells was evaluated using tumor and immune cell-centric antibody panels. Tumors displayed individuality in tumor cell composition, including phenotypic abnormalities and phenotype dominance. Relationship analyses between tumor and immune cells revealed characteristics of ecosystems related to immunosuppression and poor prognosis. High frequencies of PD-L1+ tumor-associated macrophages and exhausted T cells were found in high-grade ER+ and ER- tumors. This large-scale, single-cell atlas deepens our understanding of breast tumor ecosystems and suggests that ecosystem-based patient classification will facilitate identification of individuals for precision medicine approaches targeting the tumor and its immunoenvironment.

Keywords: T cell; breast cancer; immunosuppression; macrophage; mass cytometry; single-cell analysis; tumor ecosystem; tumor heterogeneity.


Figures

None
Graphical abstract
Figure 1
Figure 1
A Single-Cell Proteomic Atlas of Breast Cancer Ecosystems (A) Experimental approach. (B) t-SNE plots of EpCAM, CD45, CD31, and FAP expression in 58,000 cells from all samples using a 0 to 1 normalization. (C) t-SNE as in (B), colored by cell type. (D and E) Frequencies of live epithelial cells, immune cells, endothelial cells, and fibroblasts for (D) mammoplasty (M), juxta-tumoral (JT), and tumor (T) samples and (E) tumor subtypes. Wilcoxon rank-sum test was used for statistical analysis. p < 0.05, ∗∗p < 0.01, ∗∗∗p < 0.001. See also Figure S1.
Figure S1
Figure S1
Cell Type Identification for a Single-Cell Atlas of Breast Cancer, Related to Figure 1 (A) Antibody staining strategy. (B) Viable cell frequencies of mammoplasty (M), juxta-tumoral (JT), and tumor (T) samples. (C) Gating strategy used to isolate live, non-apoptotic cells without gadolinium background staining. (D) Correlation of the intensity of measured markers in cell lines between barcoding plates. (E) Correlation of live cell and immune cell frequency of the same tumor samples between staining panels. (F and G) Correlations between principal components and F) marker abundances and G) possible experimental confounders. (H) Histograms showing the expression of ERα, PRB, and HER2 in breast cancer cell lines, single tumors, and cells from all tumors combined. (I and J) Comparison of the percentages of receptor-positive cells in tumors to pathological receptor status. (K) Gate for Ki-67+ cells. (L) Spearman correlation of the percentages of Ki-67+ cells determined by immunohistochemistry versus mass cytometry. (M) Heatmap showing normalized marker expression for the cell phenotype PhenoGraph clusters. (N) t-SNE plot colored by cluster. (O) Gating strategy to identify fibroblast subsets based on FAP and SMA. (P) Fibroblast subset frequencies in mammoplasty (M), juxta-tumoral (JT), and tumor (T) tissues (left) and by tumor subtype (right).
Figure 2
Figure 2
The Breast Cancer Immune Landscape (A) Frequencies of selected immune cell types in juxta-tumoral and tumor samples. (B) t-SNE plots of the normalized marker expression of 40,000 T cells from all samples. (C) t-SNE of T cells colored by PhenoGraph cluster. (D) Heatmap of normalized T cell marker expression for 20 T cell clusters. CM, central memory; Eff/Mem, effector and memory; Reg, regulatory; PD-1, PD-1+. (E) Boxplots showing the frequencies of the CD4+ (left) and CD8+ T cell clusters (right) in juxta-tumoral and tumor samples. (F) PD-1+ T cell frequency (top) and mean PD-1 expression (bottom) among tumor-derived CD4+ and CD8+ T cells. (G) Comparison of the PD-1+ T cell frequency and mean PD-1 expression for CD8+ (top) and CD4+ T cells (bottom). (H and I) Frequencies of selected T cell clusters in (H) ER+ and ER tumors and (I) luminal A and B tumors. (J) t-SNE plots of normalized marker expression of 40,000 myeloid cells from all samples. (K) t-SNE of myeloid cells colored by PhenoGraph cluster. (L) Heatmap of normalized myeloid marker expression for 19 myeloid clusters. Mono, monocyte; T.-res, tissue-resident; E. im., early immigrant; TAM, tumor-associated macrophage; MDSC, myeloid-derived suppressor cell. (M) Frequencies of the myeloid clusters in juxta-tumoral and tumor samples. (N and O) Frequencies of the indicated myeloid clusters in (N) ER+ and ER tumors and (O) luminal A and B tumors. Wilcoxon rank-sum test was used for statistical analysis. p < 0.05, ∗∗p < 0.01, ∗∗∗p < 0.001. See also Figure S2.
Figure S2
Figure S2
Immune Cell Phenotyping in Breast Tumor and Non-Tumor Tissue, Related to Figure 2 (A) Gate for immune cells. (B) t-SNE plots of normalized expression of markers used to identify the main immune cell types among 40,000 representative immune cells of all samples. (C) t-SNE plot of immune cells colored by cluster. (D) Heatmap of normalized marker expression for 27 clusters. NK cells, natural killer cells; pDCs, plasmacytoid dendritic cells. (E) Diffusion maps showing the CD4+ and CD8+ T cell clusters as a phenotypic continuum. T-regs were omitted. (F-I) PD-1+ T cell frequencies in F) juxta-tumoral and tumor samples, G) ER+ and ER- tumors, H) juxta-tumoral tissue and tumors by subtype, and I) tumors by grade. (J) T cell cluster frequencies in tumors by grade. (K-N) PD-L1+ TAM frequencies in K) juxta-tumoral and tumor samples, L) ER+ and ER- tumors, M) juxta-tumoral tissue and tumors by subtype, and N) tumors by grade. (O) Myeloid cluster frequencies in tumors by grade. Wilcoxon rank-sum test was used for statistical analysis. p < 0.05, ∗∗ p < 0.01, ∗∗∗ p < 0.001.
Figure 3
Figure 3
Tumor Cell Phenotypic Landscape in Breast Cancer (A) t-SNE plots of normalized marker expression of 180,000 epithelial cells from all samples. (B) t-SNE highlighting the distribution of cells from tumor, juxta-tumoral, and mammoplasty tissue. (C) Heatmap of normalized epithelial cell marker expression for 45 epithelial clusters (left) and percentage and total number of cells from mammoplasty (M), juxta-tumoral (JT), and tumor (T) tissue for each cluster (right). (D and E) Histograms of the expression of epithelial lineage markers in (D) cells derived from juxta-tumoral tissue and (E) cell lines. (F) Frequencies of cells of individual cluster groups by tumor subtype. Wilcoxon rank-sum test was used for statistical analysis. p < 0.05, ∗∗p < 0.01, ∗∗∗p < 0.001. See also Figure S3.
Figure S3
Figure S3
In-Depth Analysis of Breast Tumor Cell Phenotypes, Related to Figure 3 (A) Adjusted Rand index (ARI) values for 100 independent PhenoGraph runs using k = 100. Each boxplot corresponds to the distribution of the ARI between each run and all other runs. (B and C) t-SNE plots of epithelial cells colored by B) cluster and C) cluster group as defined by hierarchical clustering. (D) Biaxial plots showing luminal progenitor (LP, blue), luminal differentiated (L, green), and basal cells (B, red). (E) Expression of K8, K18, K7, K5, K14, ERα, and Ki-67 in clusters Ep31 (top) and Ep39 (bottom) of juxta-tumoral tissue-derived cells. (F) Histograms showing the expression of epithelial markers in tumor-derived cells by cluster group. (G) Expression of Ki-67 and EpCAM in tumor-derived cells by cluster group. (H) Percentages of K14+, K5+, K7+, K8+, and K18+ cells in juxta-tumoral and tumor samples by subtype. (I) Percentage of cells with EMT phenotype in tumors by subtype. (J and K) Percentage of Ki-67+ cells in juxta-tumoral and tumor samples by J) subtype and K) grade. Wilcoxon rank-sum test was used for statistical analysis. p < 0.05, ∗∗ p < 0.01, ∗∗∗ p < 0.001.
Figure 4
Figure 4
Molecular Phenotypic Abnormalities and Tumor Individuality Are Linked to Features of Poor Prognosis (A) Phenotypic abnormality, individuality, and richness shown schematically using hypothetical phenotypes (shape) and tumors (color). (B) Phenotypic abnormality scores of all epithelial clusters. (C) Phenotypic abnormality scores of tumors and the median score of juxta-tumoral samples. (D and E) Stacked histograms of (D) frequencies of cells per epithelial cluster group per tumor ordered by increasing phenotypic abnormality and (E) the average frequencies for juxta-tumoral tissue. (F–H) Tumor phenotypic abnormality scores by (F) grade, (G) ER status, and (H) subtype. (I) Phenotypic abnormality scores versus the percentage of Ki-67+ and CA9+ cells for tumors. (J) Individuality scores for juxta-tumoral (JT) and tumor (T) tissue. (K) Individuality scores versus phenotypic abnormality scores for tumors. (L) Individuality scores for ER+ and ER tumors. (M) Individuality scores versus the percentage of ERα+ cells for ER+ tumors. (N) Heatmap of presence and proportion of the 45 epithelial clusters for all samples. (O) Richness scores for mammoplasty (M), juxta-tumoral (JT), and tumor (T) samples. (P) Individuality scores versus richness scores for tumors. (Q) Cluster frequency map for ten tumors that had not regressed despite neoadjuvant chemotherapy. Wilcoxon rank-sum test was used for statistical analysis. p < 0.05, ∗∗p < 0.01, ∗∗∗p < 0.001. See also Figure S4.
Figure S4
Figure S4
Phenotypic Abnormality and Individuality of Tumor and Non-tumor Tissue Samples, Related to Figure 4 (A) Computation of phenotypic abnormality scores using an autoencoder trained with juxta-tumoral tissue-derived “normal-like” cells. Tumor phenotypic abnormality represents the median Mean Squared Error of all cells of a tumor. (B) Barplot of the phenotypic abnormality scores of mammoplasty and juxta-tumoral tissues and stacked histogram of the frequencies of cells per epithelial cluster group per sample. (C) Phenotypic abnormality scores for mammoplasty (M), juxta-tumoral (JT), and tumor (T) samples. (D) Computation of tumor individuality scores using a k-nearest neighbor graph, where cells of all tumors are grouped based on their phenotype. (E) Tumor individuality scores by grade and subtype. (F) Tumor individuality scores by lymph node status and distant metastasis. (G) Diagram of epithelial clusters that are dominant (D, > 50% of all cells of a sample) or tumor specific (T). (H) Cluster frequency map showing tumors for which two areas of the same tumor were sampled. Wilcoxon rank-sum test was used for statistical analysis. p < 0.05, ∗∗ p < 0.01, ∗∗∗ p < 0.001.
Figure 5
Figure 5
Relationships in the Tumor Ecosystem Correlate with Features of Disease Progression (A) Heatmap of frequencies of epithelial, T cell, and myeloid PhenoGraph clusters in mammoplasty, juxta-tumoral, and tumor tissues. For tumors, the subtype and grade are indicated by color. Cosine distance and average linkage were used. (B) Biplots of first two principal components (PCs) of cluster frequencies. Dots represent samples colored by group (top). The arrow length and direction indicate the importance of the cluster to the PC (bottom). (C–G) Boxplots of (C) individuality and (D) phenotypic abnormality scores and frequencies of (E) Ki-67+ cells, (F) PD-L1+ macrophages, and (G) PD-1+ T cells by group. Wilcoxon rank-sum test was used for statistical analysis. p < 0.05, ∗∗p < 0.01, ∗∗∗p < 0.001. See also Figure S5.
Figure S5
Figure S5
The Importance of Tumor and Immune Cell Phenotypes for Tumor Grouping, Related to Figure 5 (A and B) Biaxial plot of the first two principal components of the analysis shown in Figure 5B. A) Dots represent tumor samples colored by group. B) Dots represent tumor samples colored by subtype (top) and grade (bottom). (C-E) The importance of epithelial, T cell, and myeloid clusters for predicting whether tumors belong to group C) Tu1, D) Tu2, or E) Tu3 using random forest classification.
Figure 6
Figure 6
Breast Tumors and Their Immunoenvironment Are Interwoven Entities (A–C) Spearman correlation analyses using the frequencies of (A) epithelial clusters, (B) T cell, myeloid, and epithelial clusters, and (C) T cell and myeloid clusters in all samples. Euclidean distance and average linkage were used (top). Also shown are frequencies of selected clusters in juxta-tumoral and tumor samples (bottom). (D) Spearman correlation analysis of T cell and myeloid cluster frequencies with phenotypic abnormality and individuality scores and frequencies of ERα+, CA9+, and Ki-67+ cells in tumors. (E) Heatmap of frequencies of T cell and myeloid clusters in all samples by hierarchical clustering using cosine distance and average linkage. For tumors, the subtype, grade, and three main groups, Tu1–Tu3, from Figure 5A are indicated by color. (F) Pseudo-bright-field images of immunofluorescence staining of the indicated tumor samples. Arrowheads indicate PD-1+CTLA-4+ T cells (left) or PD-L1+ TAMs (right). Scale bar, 25 μm. (G and H) Boxplots of (G) phenotypic abnormality and (H) individuality scores for tumors in tumor immune groups TIG1–TGI3. (I) Cluster frequency map for tumors in TIG2. Tumors and epithelial clusters were sorted by increasing phenotypic abnormality score. A cutoff of p ≤ 0.01 was used in (A)–(D). Wilcoxon rank-sum test was used for (G) and (H). p < 0.05, ∗∗p < 0.01, ∗∗∗p < 0.001. See also Figure S6.
Figure S6
Figure S6
In-Depth Analysis of Relationships in the Tumor Ecosystem, Related to Figure 6 (A) Frequencies of selected T cell clusters for juxta-tumoral and tumor samples. (B) Chord diagrams of the relationships between T cell, myeloid, and epithelial clusters in tumors and matched juxta-tumoral tissue for 41 patients (p ≤ 0.001). (C) Frequencies of selected clusters that differed in correlation between tumor and juxta-tumoral tissue. (D) Absolute number of correlations between clusters for juxta-tumoral (JT) and tumor (T) tissue and table of the fold change between JT and T tissue. (E) Frequency of T cell and TAM phenotypes associated with immunosuppression for TIG1-3. (F) Pseudo-brightfield images of EpCAM and pan cytokeratin on tumor tissue. Rectangles highlight the areas shown at higher magnification in Figure 6E. Scale bar, 50 μm. Spearman correlation and Wilcoxon rank-sum test were used for statistical analysis. p < 0.05, ∗∗ p < 0.01, ∗∗∗ p < 0.001.

References

    1. American Joint Committee on Cancer . In: AJCC Cancer Staging Manual. Eighth Edition. Amin M.B., Edge S., Greene F., Byrd D.R., Brookland R.K., Washington M.K., Gershenwald J.E., Compton C.C., Hess K.R., Sullivan D.C., Jessup J.M., Brierley J.D., Gaspar L.E., Schilsky R.L., Balch C.M., Winchester D.P., Asare E.A., Madera M., Gress D.M., Meyer L.R., editors. Springer International Publishing; 2017.
    1. Angelo M., Bendall S.C., Finck R., Hale M.B., Hitzman C., Borowsky A.D., Levenson R.M., Lowe J.B., Liu S.D., Zhao S. Multiplexed ion beam imaging of human breast tumors. Nat. Med. 2014;20:436–442. - PMC - PubMed
    1. Azizi E., Carr A.J., Plitas G., Cornish A.E., Konopacki C., Prabhakaran S., Nainys J., Wu K., Kiseliovas V., Setty M. Single-Cell Map of Diverse Immune Phenotypes in the Breast Tumor Microenvironment. Cell. 2018;174:1293–1308.e36. - PMC - PubMed
    1. Bandura D.R., Baranov V.I., Ornatsky O.I., Antonov A., Kinach R., Lou X., Pavlov S., Vorobiev S., Dick J.E., Tanner S.D. Mass cytometry: technique for real time single cell multitarget immunoassay based on inductively coupled plasma time-of-flight mass spectrometry. Anal. Chem. 2009;81:6813–6822. - PubMed
    1. Bendall S.C., Simonds E.F., Qiu P., Amir el-A.D., Krutzik P.O., Finck R., Bruggner R.V., Melamed R., Trejo A., Ornatsky O.I. Single-cell mass cytometry of differential immune and drug responses across a human hematopoietic continuum. Science. 2011;332:687–696. - PMC - PubMed

Publication types