. 2019 May 2;177(4):925-941.e17.
doi: 10.1016/j.cell.2019.03.007. Epub 2019 Apr 11.

Self-Organized Nuclear Positioning Synchronizes the Cell Cycle in Drosophila Embryos

Affiliations

Self-Organized Nuclear Positioning Synchronizes the Cell Cycle in Drosophila Embryos

Victoria E Deneke et al. Cell. .

Abstract

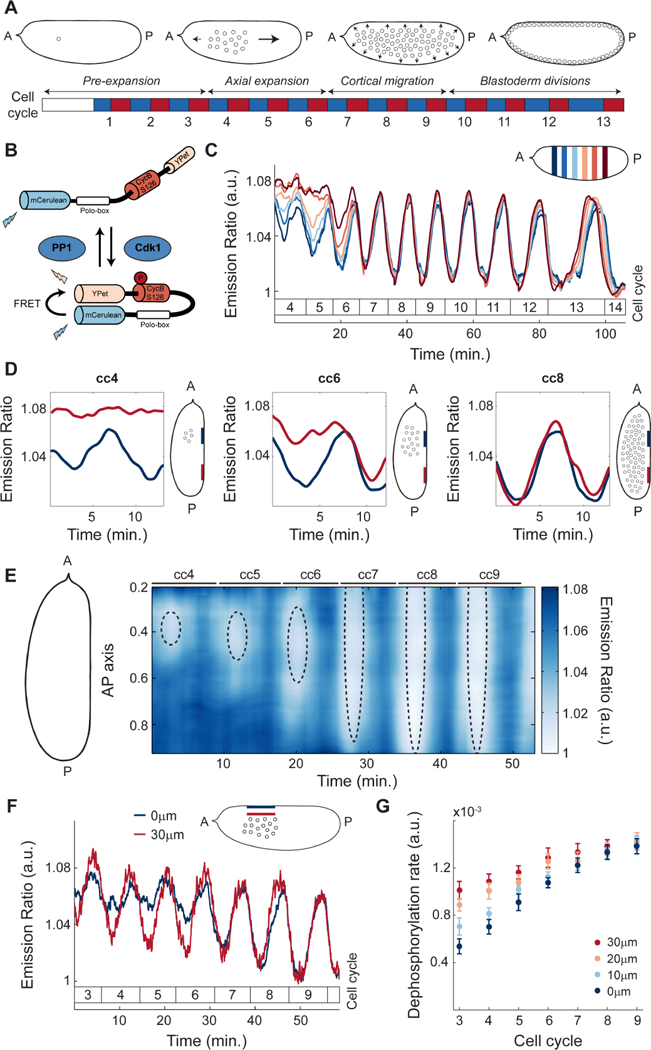
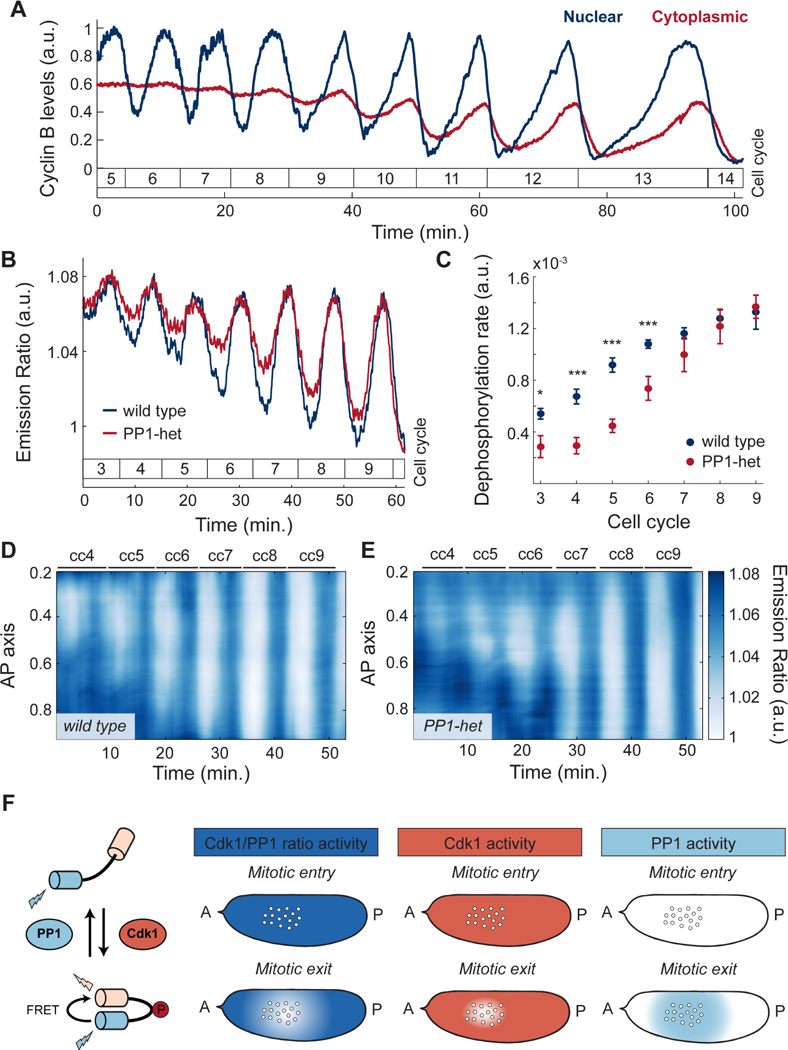
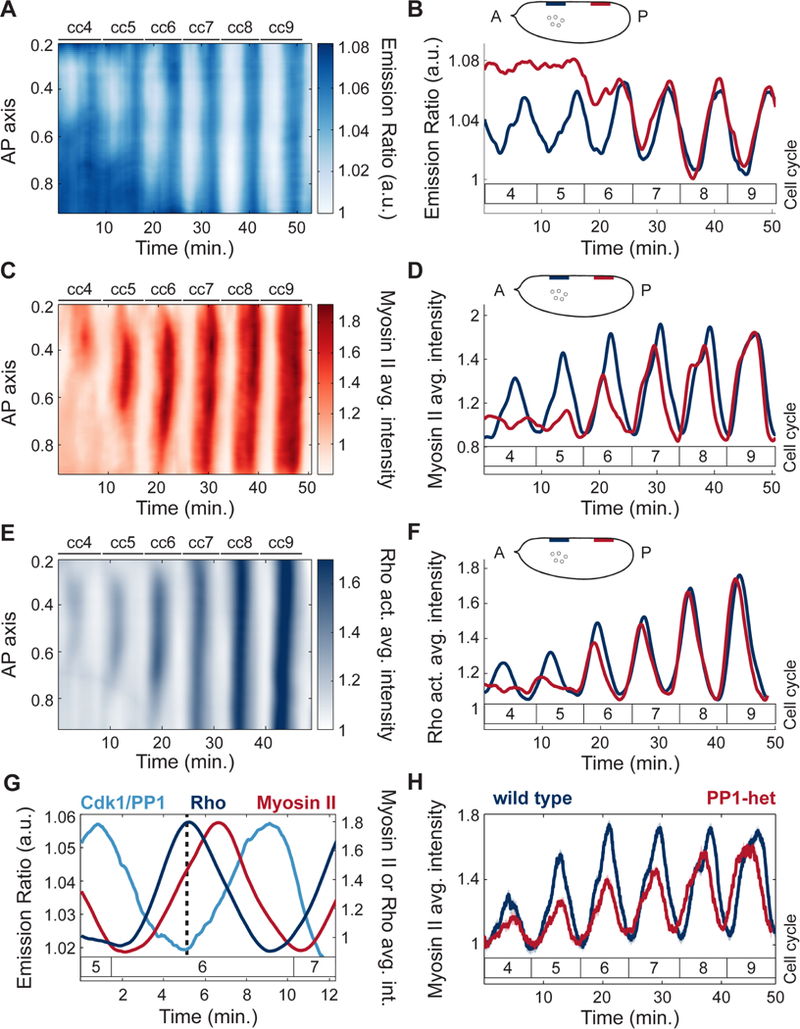
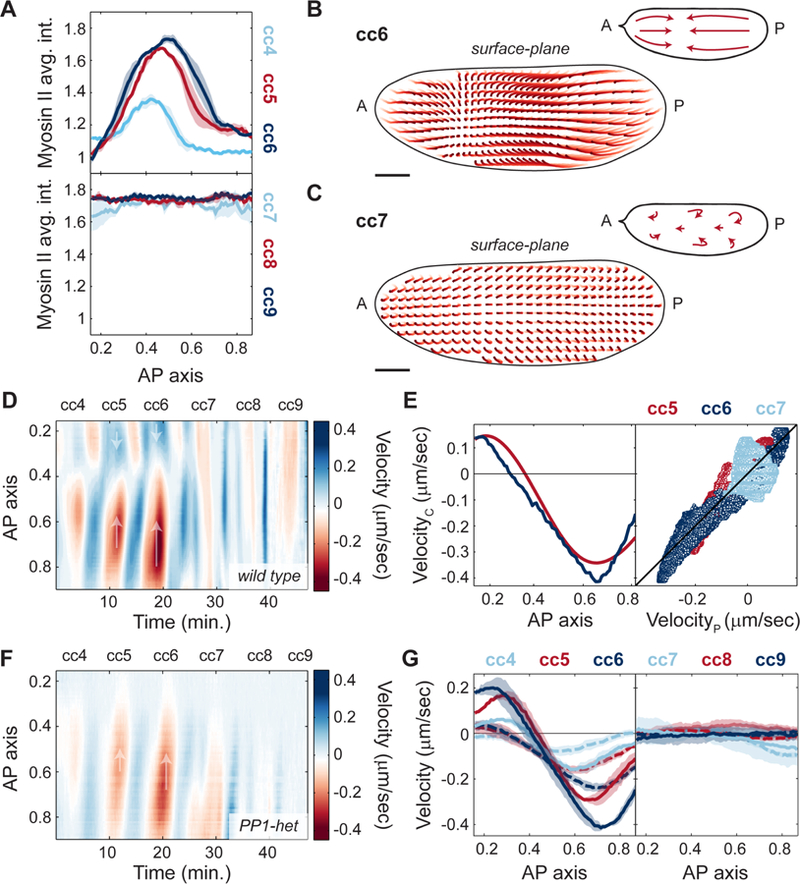
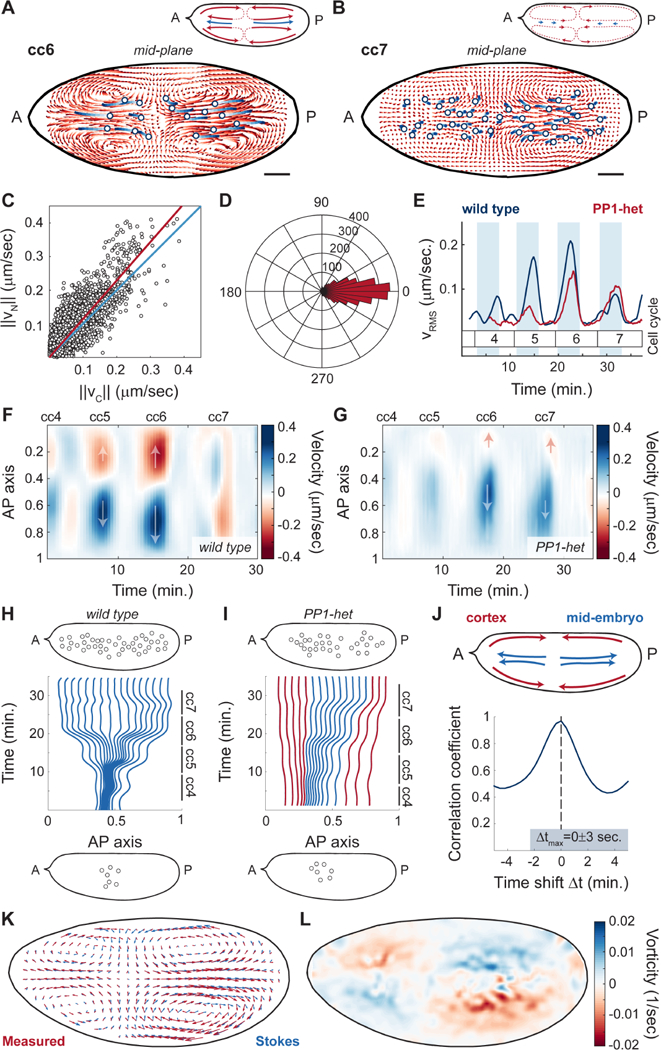
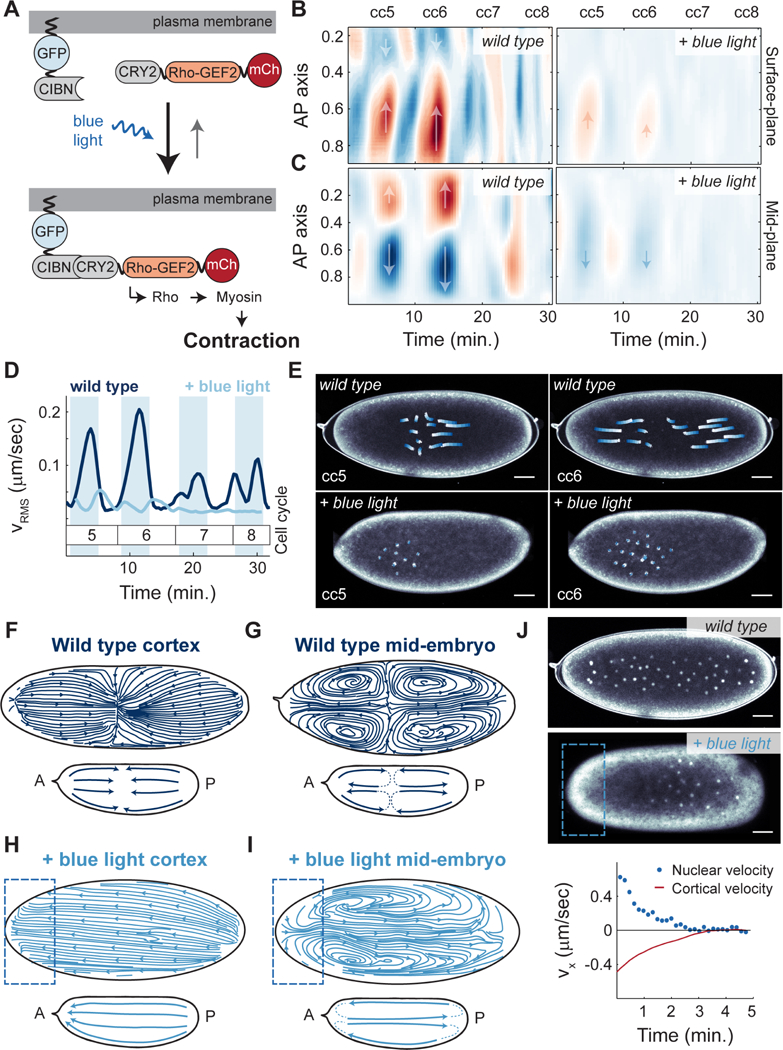
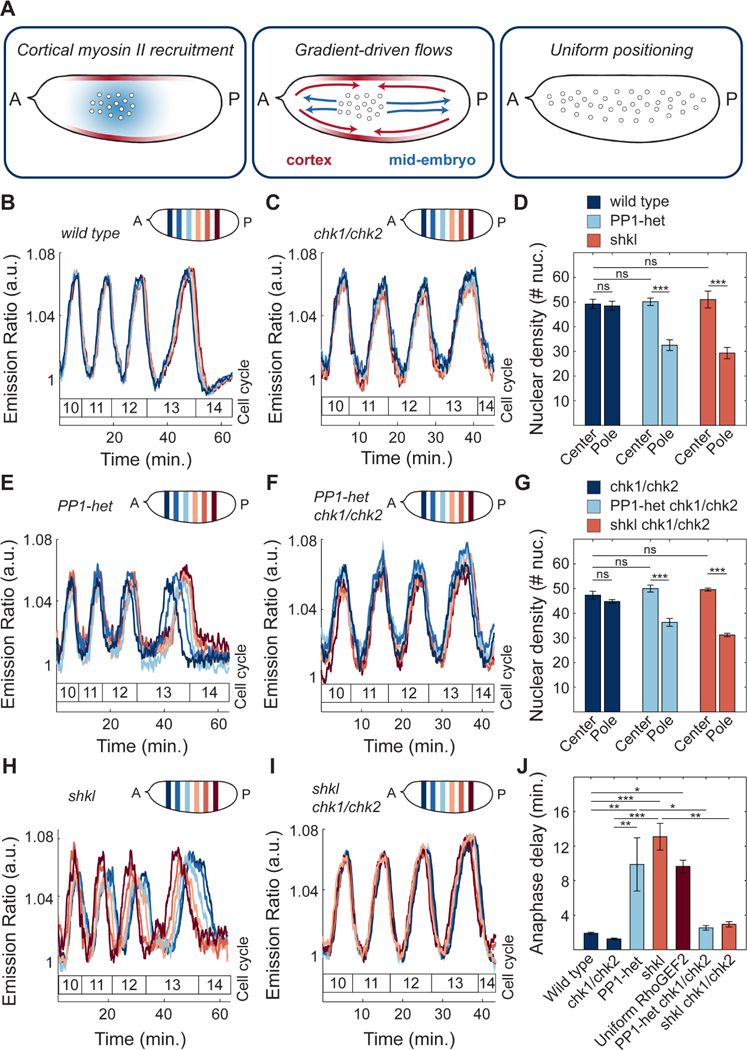
The synchronous cleavage divisions of early embryogenesis require coordination of the cell-cycle oscillator, the dynamics of the cytoskeleton, and the cytoplasm. Yet, it remains unclear how spatially restricted biochemical signals are integrated with physical properties of the embryo to generate collective dynamics. Here, we show that synchronization of the cell cycle in Drosophila embryos requires accurate nuclear positioning, which is regulated by the cell-cycle oscillator through cortical contractility and cytoplasmic flows. We demonstrate that biochemical oscillations are initiated by local Cdk1 inactivation and spread through the activity of phosphatase PP1 to generate cortical myosin II gradients. These gradients cause cortical and cytoplasmic flows that control proper nuclear positioning. Perturbations of PP1 activity and optogenetic manipulations of cortical actomyosin disrupt nuclear spreading, resulting in loss of cell-cycle synchrony. We conclude that mitotic synchrony is established by a self-organized mechanism that integrates the cell-cycle oscillator and embryo mechanics.

Keywords: actomyosin network; cell cycle; collective dynamics; cortical contractility; cytoplasmic flows; embryonic development; nuclear positioning; optogenetics; self-organization; synchronization.


Conflict of interest statement

Declaration of Interests

The authors declare no competing interests.

Figures

Figure 1.
Figure 1.. Nuclei provide a spatial landmark for the oscillations of Cdk1 and PP1.
A) After fertilization, the Drosophila embryo undergoes 13 syncytial divisions characterized by four different stages of nuclear movement: pre-expansion (cc1–3), axial expansion (cc4–6), cortical migration (cc7–9), and blastoderm divisions (cc10–13). Embryo diagrams show mid-plane position of nuclear cloud during interphase of cell cycle 1, 6, 8 and 11, respectively. Blue boxes: S-phase; red boxes: mitosis. B) Diagram of Cdk1 to PP1 FRET sensor. C) Emission ratio of Cdk1/PP1 FRET sensor averaged in different regions of the surface of one embryo at cell cycles 4–14. Mitotic exit marks start of a new cycle. Inset, embryo outline with shaded boxes indicating the positions along the AP axis and at the surface of the embryo where the signal was averaged. D) Cdk1 to PP1 activity ratio in anterior (navy) or posterior (red) regions at the surface of an embryo for cell cycles 4 (left), 6 (middle), and 8 (right). Embryo diagrams show mid-plane position of the nuclear cloud as well as regions at the surface (navy and red) where measurements were taken. E) Heat map of Cdk1 to PP1 activity as a function of time along the AP axis of an embryo for cell cycles 4–9. Black dotted ellipses: nuclear cloud border. F) Emission ratio of Cdk1/PP1 FRET sensor for cell cycles 3–9 at embryo surface (blue) and 30μm from the surface (red); p<10−102 test). G) Quantification of the dephosphorylation rate of Cdk1/PP1 FRET sensor in different axial planes for cell cycles 3–9. Error bars, sem; a.u., arbitrary units.
Figure 2.
Figure 2.. The dynamics of the cell cycle oscillator is characterized by a graded distribution of PP1 activity.
A) Quantification of cyclin-B levels in the cytoplasm near the embryo cortex (red) and around nuclei (blue). B) Emission ratio of Cdk1/PP1 FRET sensor at the surface of a wild type (blue) or a PP1-het (red) embryo; p<10−102 test). C) Quantification of the dephosphorylation rate of Cdk1/PP1 FRET sensor in wild type (blue) vs. PP1-het embryos (red). p<10−102 test). D-E) Heat map of Cdk1 to PP1 activity along the AP axis of an embryo for cell cycles 4–9 near the cortex of a wild type (D) and a PP1-het (E) embryo. F) Diagram summarizing the activity of Cdk1 and PP1 in the early embryo. First panel from left: Simplified diagram of Cdk1 to PP1 FRET sensor. Second panel from left: Measured Cdk1 to PP1 activity ratio during mitotic entry and mitotic exit. Third panel from left: Cdk1 (coral shaded region) activity is downregulated only in a small region around nuclei during mitotic exit. Fourth panel from left: PP1 activity (light blue shaded region) shows a graded, damped distribution from nuclei to cortex during mitotic exit. Error bars, sem; a.u., arbitrary units. *p < 0.05, **p < 0.001, ***p < 0.0001.
Figure 3.
Figure 3.. Local PP1 activity couples nuclear and cortical dynamics by regulating cortical myosin II recruitment.
A) Heat map of Cdk1 to PP1 activity as a function of time along the AP axis at the surface of a wild type embryo for cell cycles 4–9. B) Cdk1 to PP1 activity ratio in anterior (navy) or posterior (red) regions at the surface of an embryo for cell cycles 4–9. Inset, embryo outline with shaded boxes indicating the positions along the AP axis at the surface of the embryo where the signal was averaged (nuclear cloud at cell cycle 4 is depicted for reference). C) Heat map of myosin II levels as a function of time along the AP axis at the surface of a wild type embryo for cell cycles 4–9. D) Myosin II levels in anterior (navy) or posterior (red) regions at the surface of an embryo for cell cycles 4–9. Inset, same as in B. E) Heat map of Rho activity as a function of time along the AP axis at the surface of the embryo for cell cycles 4–9. F) Rho activity in anterior (navy) and posterior (red) regions at the surface of an embryo for cell cycles 4–9. G) Dynamics of Cdk1/PP1 FRET sensor, Rho activity, and myosin II levels averaged in regions surrounding nuclei at cell cycle 6. Dotted line: local Rho activity maximum and Cdk1/PP1 activity minimum. Delay between Rho activity and myosin level peak: 1.3 min. (p<10−6, t-test). H) Myosin II levels at surface averaged in regions surrounding nuclei for wild type (blue line) and PP1-het (red line) embryos at cell cycles 4–9. Shaded regions, sem; p<10−102 test); a.u., arbitrary units.
Figure 4.
Figure 4.. Myosin II gradients drive cortical contractions.
A) Myosin II intensity profiles across AP axis during maximum myosin II recruitment for cell cycles 4–6 (top) and cell cycles 7–9 (bottom). B-C) Cortical flow trajectories (light to dark red) for contraction phase of an embryo during cell cycle 6 (B) and cell cycle 7 (C). Insets, schematic of streamlines showing direction of cortical flows. D) Heat map of cortical flow velocity along the AP axis of an embryo for cell cycles 4–9. Arrows indicate the direction of movement along the AP axis. E) Left: Measured cortical velocity (blue line) for a cycle 6 embryo and predicted velocity (red line) from myosin II gradients. Right: Cortical velocity versus predicted velocity using a gradient-driven flow model for cell cycle 5 (red), 6 (navy blue) and 7 (light blue). Black line: least squares regression line (R2=0.82). F) Heat map of cortical flow velocity along the AP axis of a PP1-het embryo for cell cycles 4–9. Arrows as in D). G) Velocity profiles across AP axis during contraction phases of cell cycles 4–6 (left panel) and cell cycles 7–9 (right panel) for wild type (solid lines) and PP1-het embryos (dashed lines). For cell cycles 4–6, p<10−102 test); for cell cycles 7–9, not significant. Shaded regions, sem. Scale bars, 50μm.
Figure 5.
Figure 5.. Nuclear movements correlate with cytoplasmic flows.
A-B) Cytoplasmic flow trajectories (light to dark red) and nuclear trajectories (light to dark blue) during interphase of cell cycle 6 (A) and cell cycle 7 (B). Insets, schematic of streamlines showing direction of cortical and cytoplasmic flows (red) and nuclear movement (blue). Scale bars, 50μm. C) Modulus of nuclear versus cytoplasmic flow velocities for embryos in cell cycles 4–7. Blue line: identity line; red line: best fit. D) Histogram in polar coordinates of the angle between nuclear and cytoplasm velocities. E) Root mean square velocity across a wild type embryo (blue) and a PP1-het (red) embryo in cell cycles 4–7. Shaded blue regions: interphase. p<10−102 test). F-G) Heat map of cytoplasmic flow in a 50 μm region in the center of a wild type (F) and a PP1-het embryo (G) for cell cycles 4–7. Arrows indicate the direction of movement along the AP axis. H-I) Computationally reconstructed flow trajectories needed for uniform nuclear distribution at the end of cell cycle 7 in a wild type (H) and a PP1-het embryo (I). Blue lines represent trajectories that at cell cycle 4 initiate in the region where nuclei are present, while red lines represent trajectories outside of the nuclear cloud. Top and bottom insets: nuclear distribution in embryos at cell cycle 4 (bottom) and cell cycle 7 (top) from experimental data. J) Cross-correlation analysis of cortical flows and mid-embryo cytoplasmic flows. K) Comparison between the measured flow (red arrows) and the best-fitted Stokes’ flow (blue arrows). L) Heat map showing the vorticity field (ω = ∇ × v) of the measured flow.
Figure 6.
Figure 6.. Optogenetic control of Rho signaling shows that cytoplasmic flows and nuclear movements are mainly driven by cortical contractions.
A) Schematic view of the RhoGEF2 optogenetic tool. B) Heat map of cortical velocities in a wild type (top) and embryo expressing RhoGEF2 optogenetic system exposed to constant blue light (bottom) for cell cycles 5–8. Arrows indicate the direction of movement along the AP axis. C) Heat map of mid-embryo cytoplasmic velocities in a wild type (top) and embryo expressing RhoGEF2 optogenetic system exposed to constant blue light (bottom) for cell cycles 5–8. Arrows as in B). D) Root mean square cytoplasmic velocity of a wild type embryo (navy blue) and an optogenetic RhoGEF2 embryo exposed to blue light (light blue). Shaded blue regions: interphase. E) Nuclear trajectories (white to blue) for contraction phase of a wild type (top) or optogenetic RhoGEF2 embryo exposed to blue light (bottom) during cell cycle 5 (left) and cell cycle 6 (right). F-G) Streamlines showing direction of cortical (F) or cytoplasmic (G) flows in a wild type embryo during cell cycle 6. Inset, summary diagram of flows. H-I) Streamlines showing direction of cortical (H) or cytoplasmic (I) flows in an optogenetic RhoGEF2 embryo that was activated with blue light on the anterior pole. Inset, summary diagram of flows. J) Top two panels: Nuclear distribution for a wild type (top) and a pole-activated embryo (middle) at cell cycle 7 expressing PCNA-TagRFP to mark nuclei. Bottom panel: average cortical velocity during one contraction phase (red line) with corresponding nuclear velocity (blue points) of an optogenetic RhoGEF2 embryo activated on anterior pole. Scale bars, 50μm.
Figure 7.
Figure 7.. Proper nuclear positioning is required for synchronous cell cycles.
A) Model of nuclear spreading in early Drosophila embryos. Left embryo: local oscillations of PP1 activity (blue faded region) spread in a damped manner from the nuclear cloud and position myosin II at the cortex (red faded outline). Middle embryo: gradients of myosin II drive cortical contractions (red arrows) which result in mid-embryo cytoplasmic flows (blue arrows). Right embryo: Cytoplasmic flows push nuclei toward poles and distribute them along the AP axis. B-C) Emission ratio of Cdk1/PP1 FRET sensor averaged in different regions of the surface of a wild type (B) and chk1/chk2 (C) embryo at cell cycles 10–13. D) Nuclear density in a 50μm by 50μm region in center or pole region of a wild type, PP1-het and shkl embryo in cell cycle 13. E-F) Emission ratio of Cdk1/PP1 FRET sensor averaged in different regions of the surface of a PP1-het (E) and PP1-het chk1/chk2 (F) embryo at cell cycles 10–13. G) Nuclear density in a 50μm by 50μm region in center or pole region of a chk1/chk2, PP1-het chk1/chk2 and shkl chk1/chk2 embryo in cell cycle 13. H-I) Emission ratio of FRET sensor averaged in different regions of the surface of a shkl (H) and shkl chk1/chk2 (I) embryo at cell cycles 10–13. J) Quantification of delay between first nucleus to enter anaphase to last nucleus in cell cycle 13. Error bars, sem. *p < 0.05, **p < 0.001, ***p < 0.0001; a.u., arbitrary units.

Comment in

References

    1. Acheson DJ (1990). Elementary fluid dynamics (Clarendon Press; Oxford University Press; ).
    1. Baker J, Theurkauf WE, and Schubiger G (1993). Dynamic changes in microtubule configuration correlate with nuclear migration in the preblastoderm Drosophila embryo. J Cell Biol 122, 113–121. - PMC - PubMed
    1. Carroll NJ, Jensen KH, Parsa S, Holbrook NM, and Weitz DA (2014). Measurement of flow velocity and inference of liquid viscosity in a microfluidic channel by fluorescence photobleaching. Langmuir 30, 4868–4874. - PubMed
    1. Chang JB, and Ferrell JE Jr. (2013). Mitotic trigger waves and the spatial coordination of the Xenopus cell cycle. Nature 500, 603–607. - PMC - PubMed
    1. Charras GT, Yarrow JC, Horton MA, Mahadevan L, and Mitchison TJ (2005). Non-equilibration of hydrostatic pressure in blebbing cells. Nature 435, 365–369. - PMC - PubMed

Publication types

MeSH terms