. 2019 May 2;177(4):821-836.e16.
doi: 10.1016/j.cell.2019.03.001. Epub 2019 Apr 11.

A Compendium of Mutational Signatures of Environmental Agents

Affiliations

A Compendium of Mutational Signatures of Environmental Agents

Jill E Kucab et al. Cell. .

Abstract

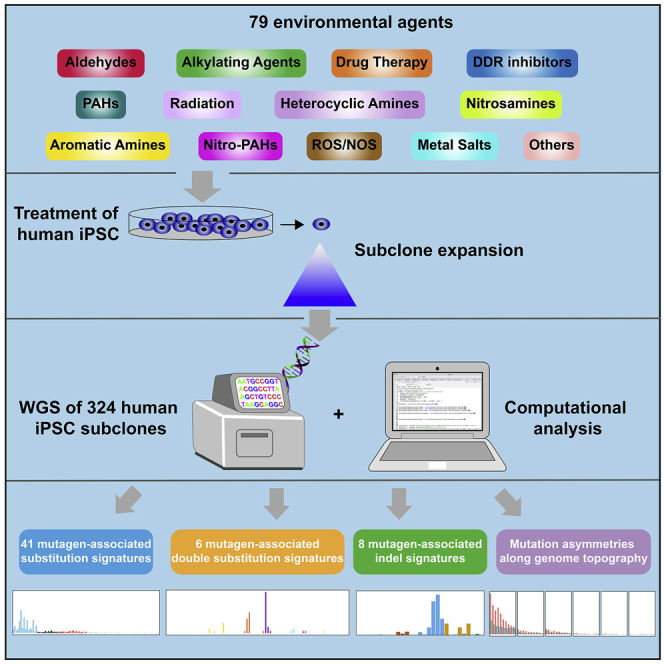
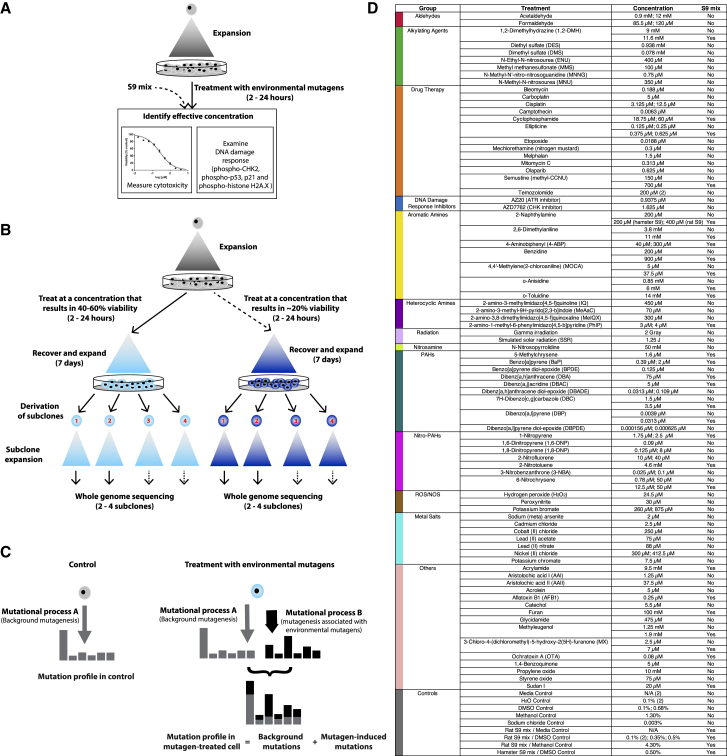
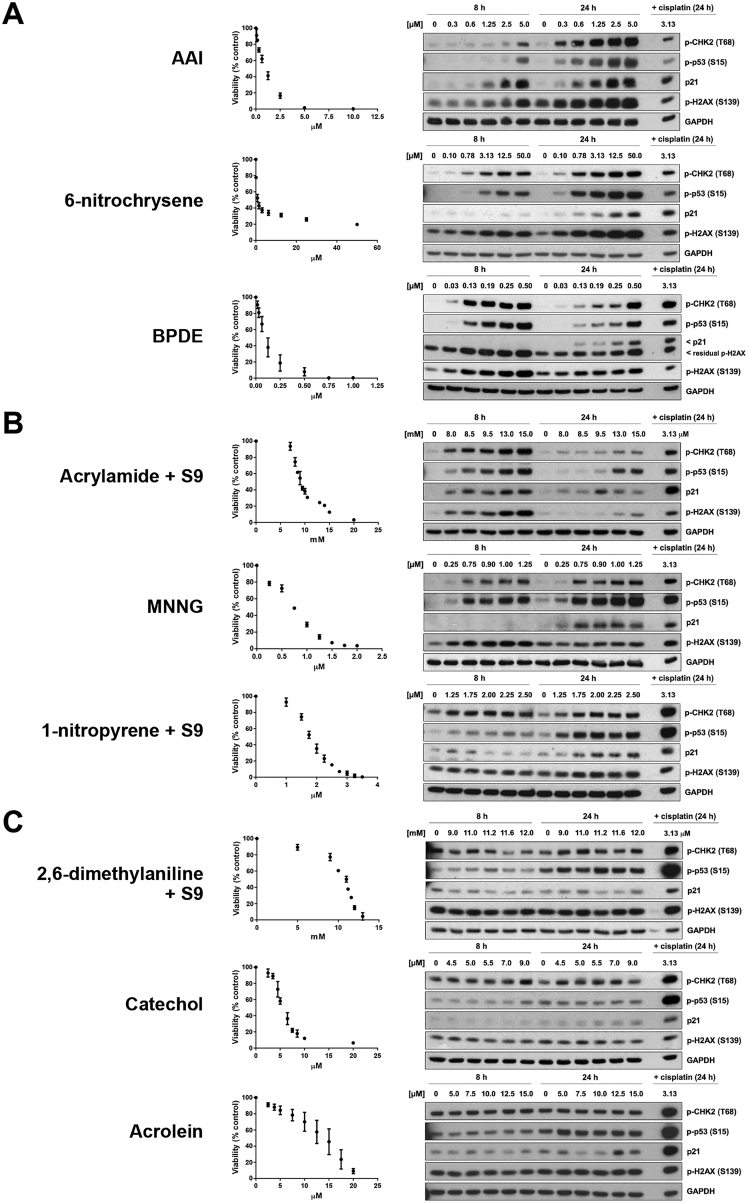
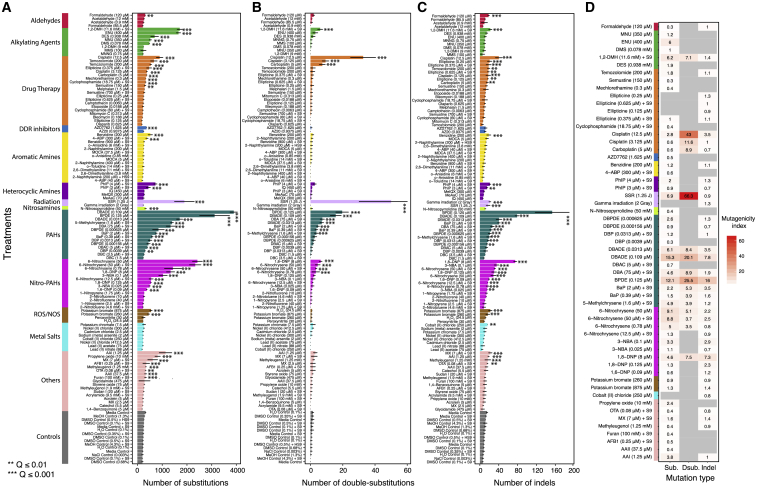
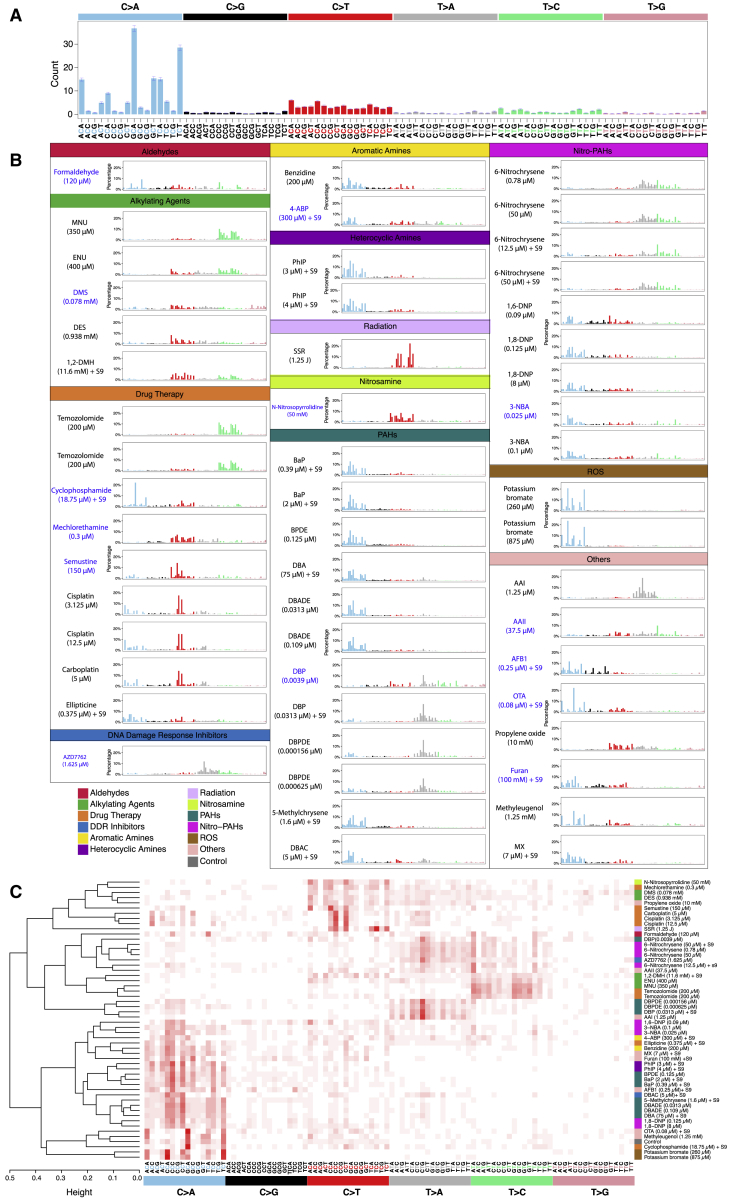
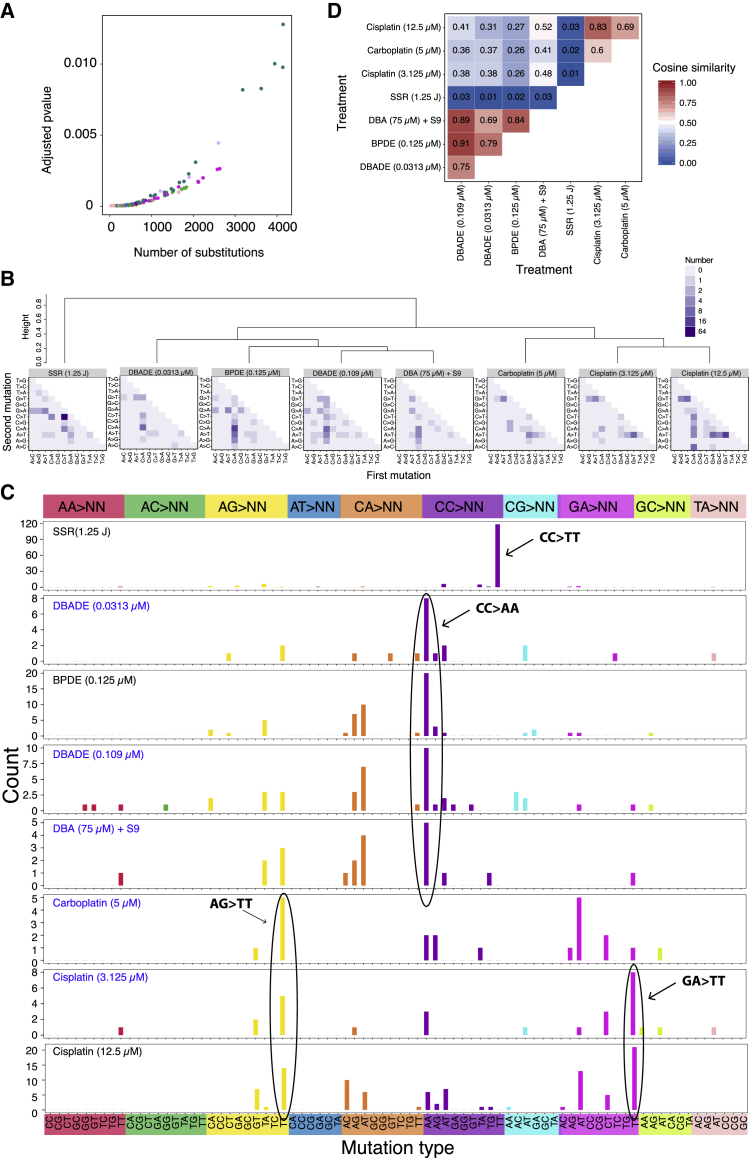
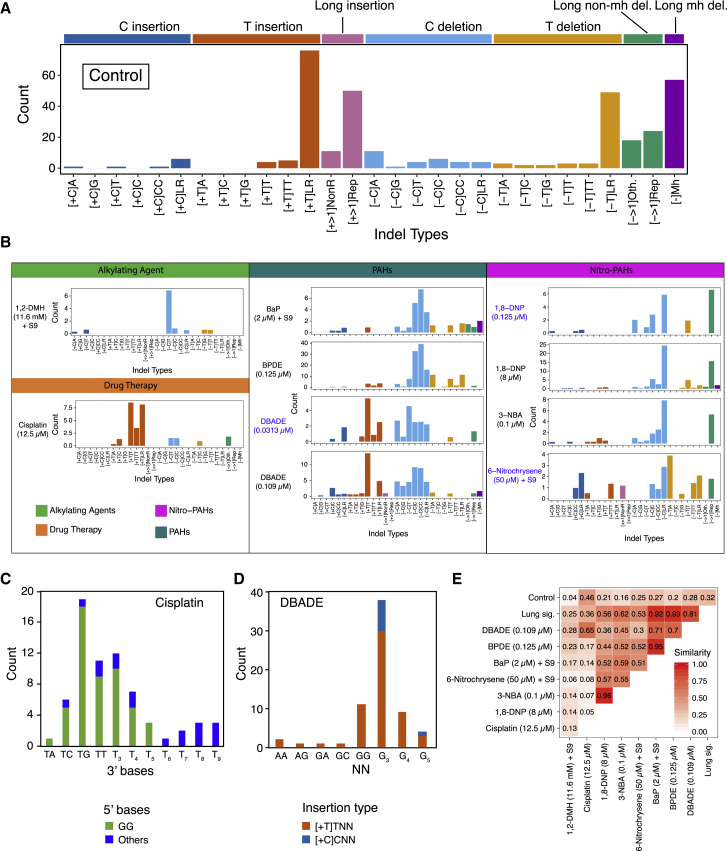
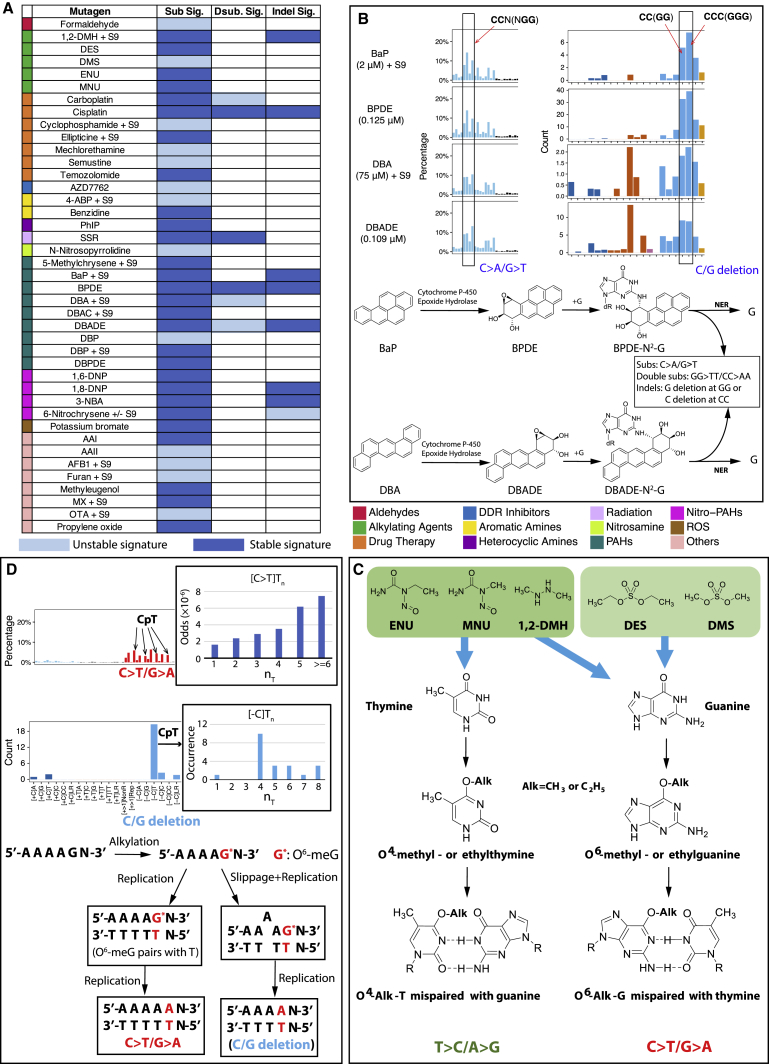
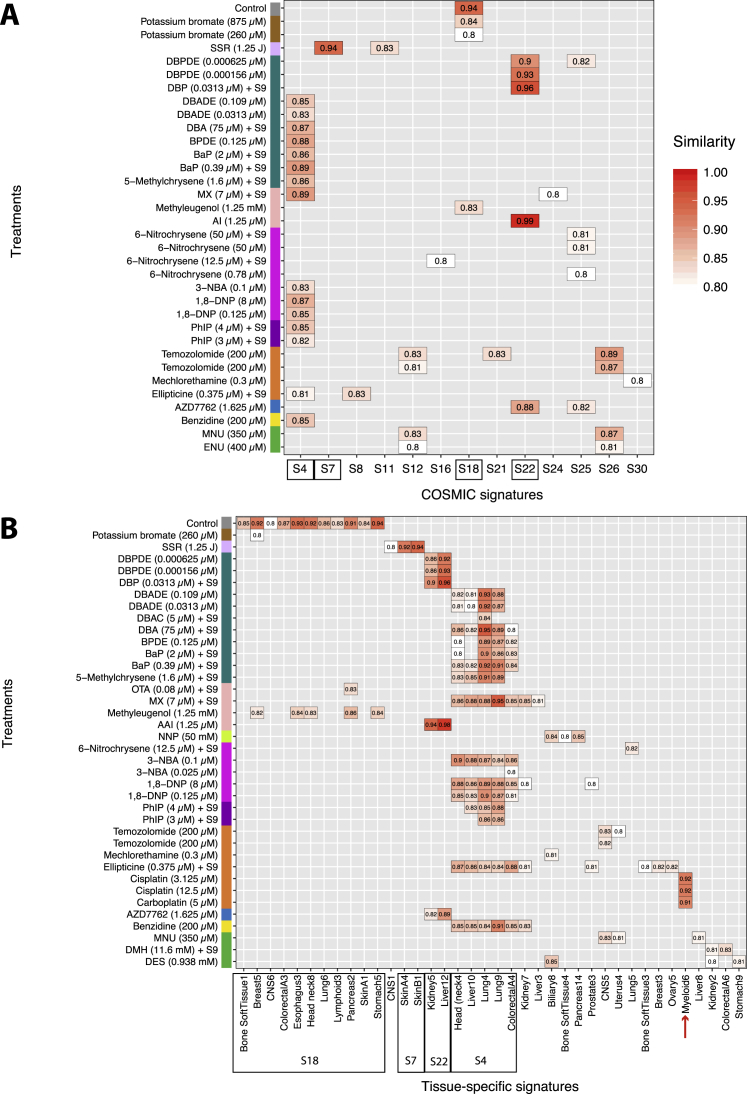
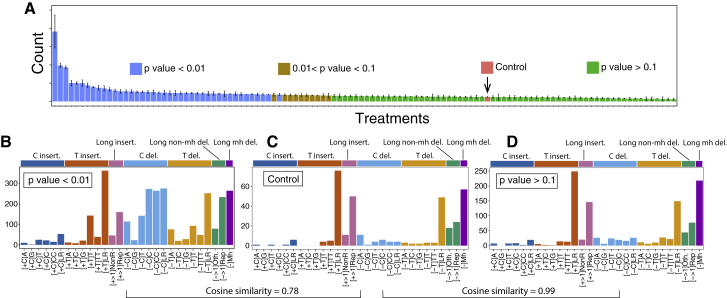
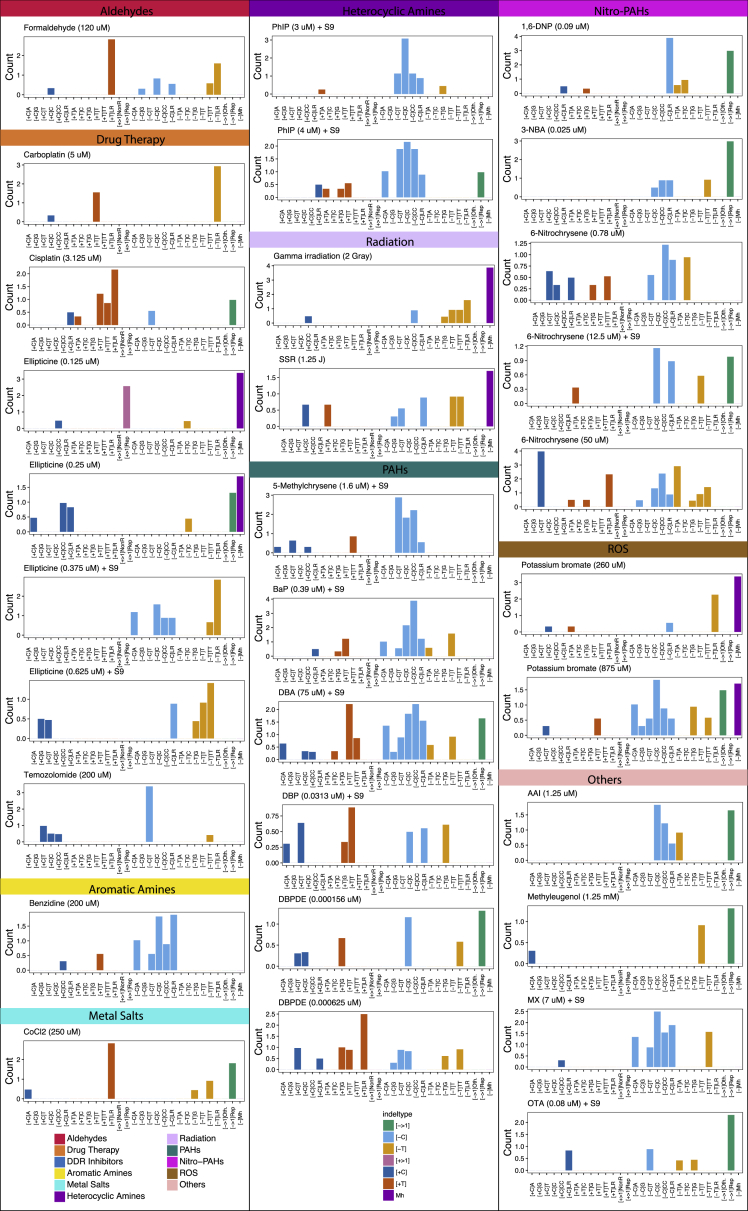
Whole-genome-sequencing (WGS) of human tumors has revealed distinct mutation patterns that hint at the causative origins of cancer. We examined mutational signatures in 324 WGS human-induced pluripotent stem cells exposed to 79 known or suspected environmental carcinogens. Forty-one yielded characteristic substitution mutational signatures. Some were similar to signatures found in human tumors. Additionally, six agents produced double-substitution signatures and eight produced indel signatures. Investigating mutation asymmetries across genome topography revealed fully functional mismatch and transcription-coupled repair pathways. DNA damage induced by environmental mutagens can be resolved by disparate repair and/or replicative pathways, resulting in an assortment of signature outcomes even for a single agent. This compendium of experimentally induced mutational signatures permits further exploration of roles of environmental agents in cancer etiology and underscores how human stem cell DNA is directly vulnerable to environmental agents. VIDEO ABSTRACT.

Keywords: DNA damage; Mutational signatures; carcinogens; environmental mutagens; mutagenesis.


Figures

None
Graphical abstract
Figure 1
Figure 1
Experimental Protocol and Mutagen Information (A) Assessment of cytotoxicity and DNA damage response to identify effective concentrations. (B) Experimental workflow. (C) Schematic showing how a mutagen-associated mutational process changes a mutational profile. (D) List of mutagens and their treatment conditions. See also Figure S1 and Table S1.
Figure S1
Figure S1
Cell Viability and DDR Induction following Treatment of Human iPSCs with Environmental Mutagens, Related to Figure 1, Table S1, and STAR Methods Included are examples of agents that (A) induced DDR and had an associated mutational signature, (B) induced DDR but did not have an associated mutational signature and (C) did not induce DDR and did not have an associated mutational signature. For viability assessment, cells were treated with the indicated concentrations of mutagen (or solvent control) for either 2 h (BPDE, DBADE and DBPDE), 3 h (when rat liver S9 mix was included) or 24 h. Viability was measured 72 h following initiation of treatment using the Deep Blue Cell Viability Kit. Mean values are shown as % of control ± SD of at least 3 replicate experiments. Protein expression of p-CHK2 (T68), p-p53 (S15), p21 and γ-H2AX (S139) was assessed by western blotting. GAPDH served as a loading control. Cells were treated as described above and lysed at 8 h or 24 h following initiation of treatment.
Figure S2
Figure S2
Using an IncuCyte to Follow Single-Cell-Derived Subclones, Related to STAR Methods (A) Screening images taken every 6 hours over 10-12 days. (B) Variant allele frequency of subclones, 15 randomly selected subclones are shown. To remove mutations present from potential polyclonal samples, a filter of VAF > = 0.2 was applied to substitutions and indels.
Figure 2
Figure 2
Mutation Frequencies (A–C) De novo mutation numbers identified for substitutions (A), double-substitutions (B), and indels (C). Asterisks indicate a significant increase in mutations over controls (STAR Methods). ∗∗q value ≤ 0.01; ∗∗∗q value ≤ 0.001 (permutation test). Data are for 2–4 independent subclone experiments. Bars represent mean ± SEM of subclone observations. (D) For treatments with a significant increase in mutations, mutagenicity index = (NtreatmentNcontrol)/Ncontrol, where Ntreatment is the average mutation number of treatment subclones and Ncontrol is the average mutation number of control subclones. See also Tables S2 and S3.
Figure 3
Figure 3
Substitution Signatures (A) Mutational profile of all controls. It is a 96-channel vector (6 types of substitution 4 types of 5′ base 4 types of 3′ base). Mean ± SEM of 35 subclones. This is also the background signature seen in all treatments. (B) Signatures identified from 53 treatments. Blue indicates a less stable signature (less consistent in subclones due to low numbers). (C) Hierarchical clustering of the 53 signatures. See also Figure S3 and Table S4.
Figure 4
Figure 4
Double-Substitution Signatures (A) Expected probability of formation of a double-substitution by two random substitutions. (B) Hierarchical clustering of eight aggregated double-substitution profiles (treatments with double-substitution number > 20). The first mutation represents 5′ base change, the second mutation represents 3′ base change. In total, there are 78 types of double-substitutions (STAR Methods). (C) Double-substitution profiles as bar plots. Blue indicates a less stable signature. (D) Cosine similarities between eight double-substitution signatures. See also Table S6.
Figure 5
Figure 5
Indel Signatures (A) Indel profile of controls. Due to low numbers, all control subclones are aggregated to obtain a more accurate indel profile (see Figure S4). (B) Profiles of eight mutagens (10 treatments). Blue indicates less stable signature. (C) High resolution profile of cisplatin (12.5 μM)-induced one-base T insertion in repetitive sequence, taking 5′ sequence context into account. (D) High resolution profile of DBADE-induced T and C insertions. (E) Cosine similarities between ten mutagen, smoking-associated lung, and control signatures. See also Figure S4 and S5.
Figure 6
Figure 6
Mechanisms of Mutagen-Associated Mutational Signatures (A) Summary of mutagen-associated signatures. Light blue indicates an unstable signature (subclone variation); dark blue indicates a stable signature. (B) Sequence context of BaP, BPDE, DBA and DBADE substitution and indel mutation patterns. Substitutions and indels are more likely to occur near CC (GG). Pathways to BaP, BPDE, DBA, and DBADE mutations are shown. (C) Progression to mutation by five alkylating agents. (D) Proposed mechanisms underpinning 1,2-DMH substitution and indel signatures. 1,2-DMH alkylates Gs particularly at ApG sites. An increasing number of 5′A bases increases the probability of G mutating. Lower diagram: how signatures can arise for 1,2-DMH: in the left-hand branch, O6-meG in a (polyA)pG sequence pairs with T leading to a G > A substitution; in the right-hand branch, slippage additionally occurs resulting in a loss of T.
Figure S3
Figure S3
Comparison of Mutational Signatures between Cancer (In Vivo) and Mutagen (In Vitro), Related to Figure 3 (A) Cosine similarity between 30 COSMIC substitution signatures (https://cancer.sanger.ac.uk/cosmic/signatures) and mutagen substitution signatures. (B) Cosine similarity between tissue-specific substitution signatures and mutagen substitution signatures.
Figure S4
Figure S4
Identification of Background Indel Signatures, Related to Figure 5 and STAR Methods (A–D) Comparing indel number obtained from mutagen treatments and controls, one can identify the treatments that do not generate indel signatures (p value > 0.1). The aggregated control indel profile (bottom left) shows high similarity (0.99) with the aggregated indel profile from treatments with p value > 0.1 (treatments that do not manifest indel signatures, bottom right).
Figure S5
Figure S5
Indel Profiles of Mutagen-Associated Treatments with p Value < 0.01, Related to Figure 5 There are 41 treatments with a significant increase in indel numbers (P value < 0.01). Ten of them shown in Figure 5B have SNR > = 2, average indel number per subclone > = 20 and stability > = 0.7. The other 31 treatments did not show clear signatures, because the increased number of indels in each subclone was relatively low e.g., less than 10 above the baseline, and the number of subclones of each treatment is low (2-4). By distributing less than 20-40 indels into 29 channels, one is hardly able to appreciate a signature. Although we do not have enough power to obtain full pictures of indel signatures for these 31 treatments, some characteristic features are appreciable. For example, treatment of 3.125 μM cisplatin has T insertion in poly T tracks, which is similar to treatment of 12.5 μM cisplatin. Treatments of PhIP with S9 at two concentrations all show distinct C deletions. Two radiation experiments, namely gamma irradiation and simulated solar radiation, both show increased microhomology-mediated deletions, indicating additional double-stranded DNA breaks may be induced by radiations. For PAHs, treatment with 5-methylchrysene (1.6 μM) +S9 induced additional C deletions; treatment with BaP (0.39 μM) +S9 has a similar profile to treatment with BaP (2 μM) +S9 and BPDE (0.125 μM) (Figure 5B); treatment with DBA (75 μM) +S9 shows both increased T insertion and C deletion, similar to treatments with DBADE (0.0313 μM and 0.109 μM). It seems that many mutagens from different groups are able to cause C deletions, such as potassium bromate (875 μM), AAI (1.25 μM), MX (7 μM) with S9, 1,6-DNP (0.09 μM), 3-NBA (0.025 μM) and 6-nitrochrysene, indicating the damage on guanine can often result in C:G pair deletion. Thus for the cohort described in this paragraph, indel signatures may well exist, but according to our conservative criteria we did not report these as signatures because the current study is underpowered to be able to do this.
Figure S6
Figure S6
Distribution of Normalized Mutation Density across the Replication Timing Domains, Related to Figure 7 The G2/S phase was separated into ten replication timing domains. The expected distribution of mutations in replication timing regions was obtained through simulation based on the signature profile and trinucleotide distribution. Red asterisk “” marks the mutagen treatments having observed distribution (green bars) different from simulated distribution (blue line).
Figure 7
Figure 7
Strand Asymmetries and Genomic Distributions of Mutagen Signatures (A) Transcriptional strand asymmetry of 53 mutagen substitution signatures in 6 channels. Asterisks indicate significant bias. q value ≤ 0.05; ∗∗q value ≤ 0.01; ∗∗∗q value ≤ 0.001. Pearson’s chi-square test with multiple test correction. (B) Transcriptional strand asymmetry across RTDs of four selected agents. (C) Schematic illustration on efficiency of DNA repair along RTD, contrasting mutagenesis during culture/expansion of cells in vitro mainly due to ROS (top) with mutagenesis caused by DBADE forming N2-G adducts (bottom). Guanine-associated DNA damage (red lines) is more likely to occur at GC-rich regions that tend to be enriched in early RTD. Hence, there is a negative gradient of an excess of damage in early RTDs for both of these forms of DNA damage, although high level of DBADE damage results in a steeper gradient. Fortunately, DNA repair is also often more efficient in early RTDs. BER and MMR contribute to the repair of guanine-associated damage caused by ROS (cyan line, top). Likewise, TC-NER is involved in the repair of DBADE-associated guanine adducts (blue and yellow lines, bottom). For the culture-related signature (top), BER and MMR must be operational and highly efficient particularly in the early RTD in order to achieve the distribution observed given by the difference between the red and cyan lines (gray zone). This results in a final distribution that has an excess of mutagenesis in late RTD in all subclones. For the DBADE signature, TC-NER must be fully operational because the gradient of substitutions is different between the transcribed (blue line) and non-transcribed strand (orange line), culminating in the mutational distributions across RTD shown in deep purple and light purple lines, respectively. The difference in substitution density between non-transcribed strand (deep purple line) and transcribed strand (light purple) is greater in early replication regions than in late ones. This is observed consistently for many PAHs and is also in cancer-derived signatures. See also Figures S6 and S7.
Figure S7
Figure S7
Histogram of Mutation Density on Transcribed (Red) and Non-transcribed (Cyan) Strands of Treatments Having q Value ≤ 0.01, Related to Figure 7 Bars and error represent mean ± SEM of subclone observations.

References

    1. Alexandrov L.B., Nik-Zainal S., Wedge D.C., Aparicio S.A.J.R., Behjati S., Biankin A.V., Bignell G.R., Bolli N., Borg A., Børresen-Dale A.-L., Australian Pancreatic Cancer Genome Initiative. ICGC Breast Cancer Consortium. ICGC MMML-Seq Consortium. ICGC PedBrain Signatures of mutational processes in human cancer. Nature. 2013;500:415–421. - PMC - PubMed
    1. Arlt V.M., Glatt H., Muckel E., Pabel U., Sorg B.L., Schmeiser H.H., Phillips D.H. Metabolic activation of the environmental contaminant 3-nitrobenzanthrone by human acetyltransferases and sulfotransferase. Carcinogenesis. 2002;23:1937–1945. - PubMed
    1. Behjati S., Huch M., van Boxtel R., Karthaus W., Wedge D.C., Tamuri A.U., Martincorena I., Petljak M., Alexandrov L.B., Gundem G. Genome sequencing of normal cells reveals developmental lineages and mutational processes. Nature. 2014;513:422–425. - PMC - PubMed
    1. Berger M.F., Mardis E.R. The emerging clinical relevance of genomics in cancer medicine. Nat. Rev. Clin. Oncol. 2018;15:353–365. - PMC - PubMed
    1. Boot A., Huang M.N., Ng A.W.T., Ho S.C., Lim J.Q., Kawakami Y., Chayama K., Teh B.T., Nakagawa H., Rozen S.G. In-depth characterization of the cisplatin mutational signature in human cell lines and in esophageal and liver tumors. Genome Res. 2018;28:654–665. - PMC - PubMed

Publication types

Substances