. 2019 Jun 20;26(6):885-891.e4.
doi: 10.1016/j.chembiol.2019.03.003. Epub 2019 Apr 11.

AKAP95 Organizes a Nuclear Microdomain to Control Local cAMP for Regulating Nuclear PKA

Affiliations

AKAP95 Organizes a Nuclear Microdomain to Control Local cAMP for Regulating Nuclear PKA

Terri Clister et al. Cell Chem Biol. .

Abstract

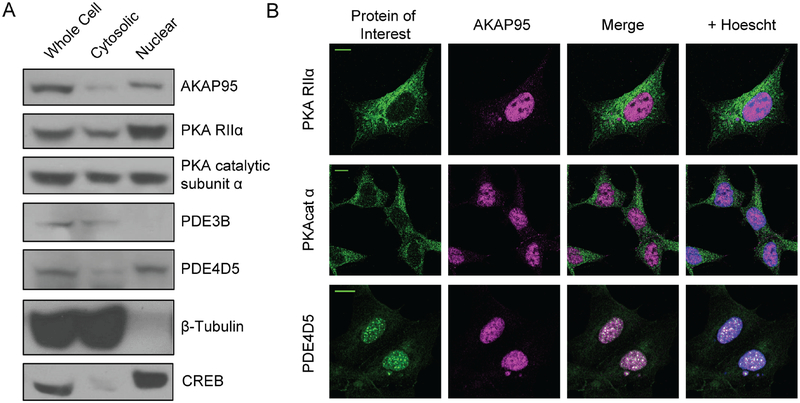
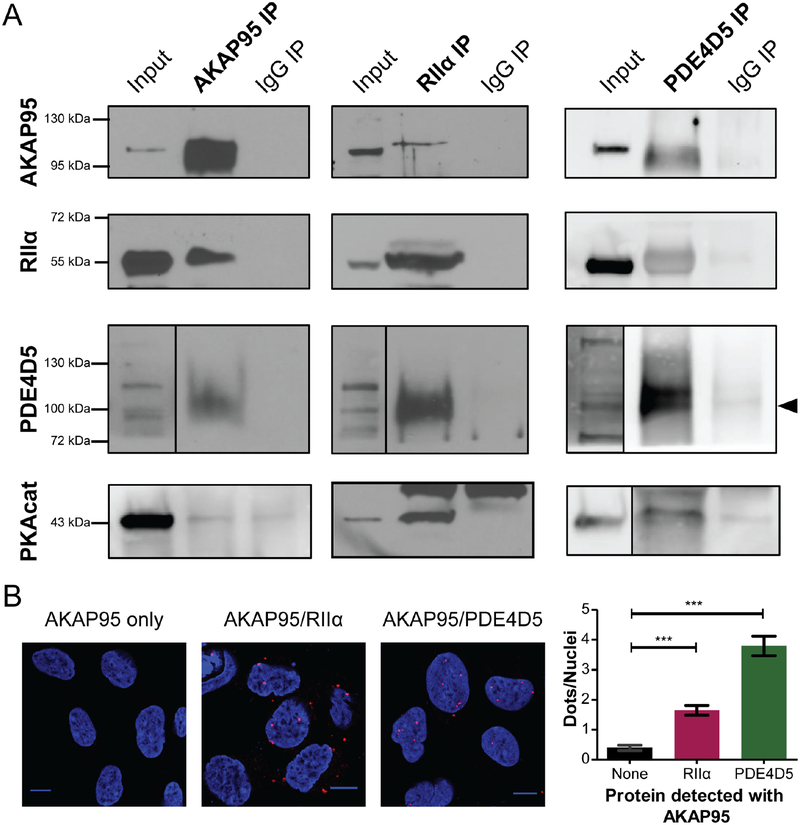
Contrary to the classic model of protein kinase A (PKA) residing outside of the nucleus, we identify a nuclear signaling complex that consists of AKAP95, PKA, and PDE4D5 and show that it forms a functional cyclic AMP (cAMP) signaling microdomain. Locally generated cAMP can accumulate within the vicinity of this complex; however, when cAMP is generated at the plasma membrane, PDE4 serves as a local sink and PDE3 as a barrier to prevent accumulation of cAMP within the microdomain as a means of controlling activation of tethered nuclear PKA.

Keywords: FRET biosensors; compartmentalization; imaging; spatiotemporal.


Conflict of interest statement

Competing financial interests

The authors declare no competing financial interests.

Figures

Figure 1:
Figure 1:. AKAP95, PKA, and PDE are present in the nucleus
a) Western blot images of whole-cell, non-nuclear, and nuclear HEK293T lysates reveal localization of AKAP95, PKARIIα, and PKAcat within the nucleus. PDE4D5 is also detected in nuclear fractions, though PDE3B is not. β-tubulin antibody staining shows a lack of cytosolic protein in the nuclear fraction, and probing for CREB provides a positive control for nuclear isolation. b) Representative images showing immunofluorescence staining of endogenous protein similarly detects the candidate proteins in the nucleus. Scale bars, 10 μm (See Supplemental Figure 1 for quantification of nuclear localization of PKAcat and PKA RIIα).
Figure 2:
Figure 2:. AKAP95 forms an endogenous complex with PKA and PDE
a) Co-immunoprecipitation of nuclear fractions of HEK293T cells show interactions between AKAP95, RIIα and PDE4D5. The left column shows the AKAP95 IP, including lanes for the nuclear lysate input, AKAP95 IP, and the control IP using normal IgG. PDE4D5 (indicated by arrow), RIIα, and PKAcat are detected in the AKAP95 pulldown. The other components are also detected in immunprecipitates of RIIα or PDE4D5, shown in the right columns (western blot images representative of 2 or 3 repeated experiments). b) Proximity Ligation Assay (PLA) was performed with AKAP95 (N = 53 cells) and either RIIα (N = 66 cells) or PDE4D5 (N = 79 cells). Representative images are shown with quantification of nuclear PLA signal (average ± SEM). *** signifies p<0.0001. (See also Supplemental Figure 1). The co-IP and PLA experiments indicate that RIIα, AKAP95, PDE4D5 form a complex within the nucleus of HEK293T cells.
Figure 3:
Figure 3:. The AKAP95 microdomain tightly regulates cAMP
a) Based on a previous computational model for nuclear PKA activity, a new model was developed to predict cAMP levels in the AKAP microdomain and nucleus when cAMP is generated at the plasma membrane in a dose-dependent manner using PM-sAC. b) The model suggests different cAMP responses in the nucleus (orange) and AKAP microdomain (black) upon low-dose (LD, 2.5 mM) and high-dose (HD, 15 mM) NaHCO3 stimulation of cAMP production by PM-sAC. c) Using the FKBP/FRB dimerization system to localize ICUE3 to AKAP95, the model predictions were directly tested under three different experimental conditions: cAMP generated by PM-sAC and detected by the cAMP biosensor ICUE3 targeted to either i.) the nucleus or ii.) the AKAP95 microdomain of HEK293T cells, or iii.) cAMP generated in the nucleus by sAC-NLS and detected by AKAP95-targeted ICUE3. (See Supplemental Figure 3 for representative images). d) ICUE3 emission ratio (cyan/yellow) responses in the nucleus (orange, N=39 cells) and in the AKAP95 microdomain (black, N=35 cells) stimulated by LD NaHCO3 (2.5 mM) followed by HD (15 mM) in HEK293T cells expressing PM-sAC. Shown is the average trace ± SEM. Comparison of the maximum responses to LD NaHCO3 shows a significant difference between the microdomain and nucleus (p<0.0001). e) ICUE3 emission ratio (cyan/yellow) responses in the AKAP95 microdomain stimulated by LD NaHCO3 (2.5 mM) followed by HD (15 mM) in HEK293T cells expressing PM-sAC (black, N=18 cells) or sAC-NLS (red, N=18 cells). The maximum response to LD NaHCO3 in the microdomain when cAMP is generated at the plasma membrane is significantly different compared with cAMP generated in the nucleus (inset, p<0.0001).
Figure 4:
Figure 4:. PDE4 and PDE3 have distinct roles in regulating cAMP around AKAP95
The effect of isoform-specific PDE inhibition was tested in the AKAP95 microdomain. Cells expressing AKAP95-targeted ICUE3 and PM-sAC were co-treated with PDE inhibitor and rapamycin (100 nM) and subsequently with NaHCO3 (LD, 2.5 mM; HD, 15 mM) to generate cAMP at the plasma membrane via PM-sAC. a) AKAP95-targeted ICUE3 emission ratio (cyan/yellow) responses when cells were treated with the PDE4 inhibitor rolipram (1 μM) (purple, N=29 cells), the PDE3 inhibitor milrinone (10 μM) (blue, N=19 cells), or without inhibitor treatment (black, N=39 cells). Cells were additionally treated with a low dose (LD, 2.5 mM) and subsequently a high dose (HD, 15 mM) of NaHCO3. b) The initial FRET response after inhibitor addition indicates basal PDE activity in the AKAP95 microdomain. The change in normalized ICUE3 emission ratio (cyan/yellow) is shown. There is a statistically significant response in cells treated with rolipram (p<0.0001) but not in cells treated with milrinone (p=0.1293). c) After low-dose NaHCO3 stimulation, a statistically significant response is observed in PDE4-inhibited cells (p<0.0001) and PDE3-inhibited cells (p=0.0002) compared to cells lacking inhibitor treatment. d) AKAP95-targeted ICUE3 emission ratio (cyan/yellow) responses in cells expressing dnPDE4D5 (purple, N=24 cells) or cells not expressing dominant negative PDE isoforms (black, N=35 cells). Cells were treated with LD (2.5 mM) followed by HD (15 mM) NaHCO3 to stimulate PM-sAC. e) LD PM-sAC stimulation induced statistically significant responses in cells expressing the dominant negative PDE4D5 compared to control cells (inset, p<0.0001).

References

    1. Akileswaran L, Taraska JW, Sayer JA, Gettemy JM, and Coghlan VM (2001). A-kinase-anchoring Protein AKAP95 Is Targeted to the Nuclear Matrix and Associates with p68 RNA Helicase. J. Biol. Chem 276, 17448–17454. - PubMed
    1. Arsenijevic T, Degraef C, Dumont JE, Roger PP, and Pirson I (2004). A novel partner for D-type cyclins: protein kinase A-anchoring protein AKAP95. Biochem. J 378, 673–679. - PMC - PubMed
    1. Arsenijevic T, Degraef C, Dumont JE, Roger PP, and Pirson I (2006). G1/S cyclins interact with regulatory subunit of PKA via A-kinase anchoring protein, AKAP95. Cell Cycle 5, 1217–1222. - PubMed
    1. Asirvatham AL, Galligan SG, Schillace RV, Davey MP, Vasta V, Beavo JA, and Carr DW (2004). A-Kinase Anchoring Proteins Interact with Phosphodiesterases in T Lymphocyte Cell Lines. J. Immunol - PubMed
    1. Banaszynski LA, Liu CW, and Wandless TJ (2005). Characterization of the FKBP-rapamycin-FRB ternary complex. J. Am. Chem. Soc 127, 4715–4721. - PubMed

Publication types