. 2019 Aug;248(4):421-437.
doi: 10.1002/path.5281. Epub 2019 Jun 18.

Tspan8 is expressed in breast cancer and regulates E-cadherin/catenin signalling and metastasis accompanied by increased circulating extracellular vesicles

Affiliations

Tspan8 is expressed in breast cancer and regulates E-cadherin/catenin signalling and metastasis accompanied by increased circulating extracellular vesicles

Maren Voglstaetter et al. J Pathol. 2019 Aug.

Abstract

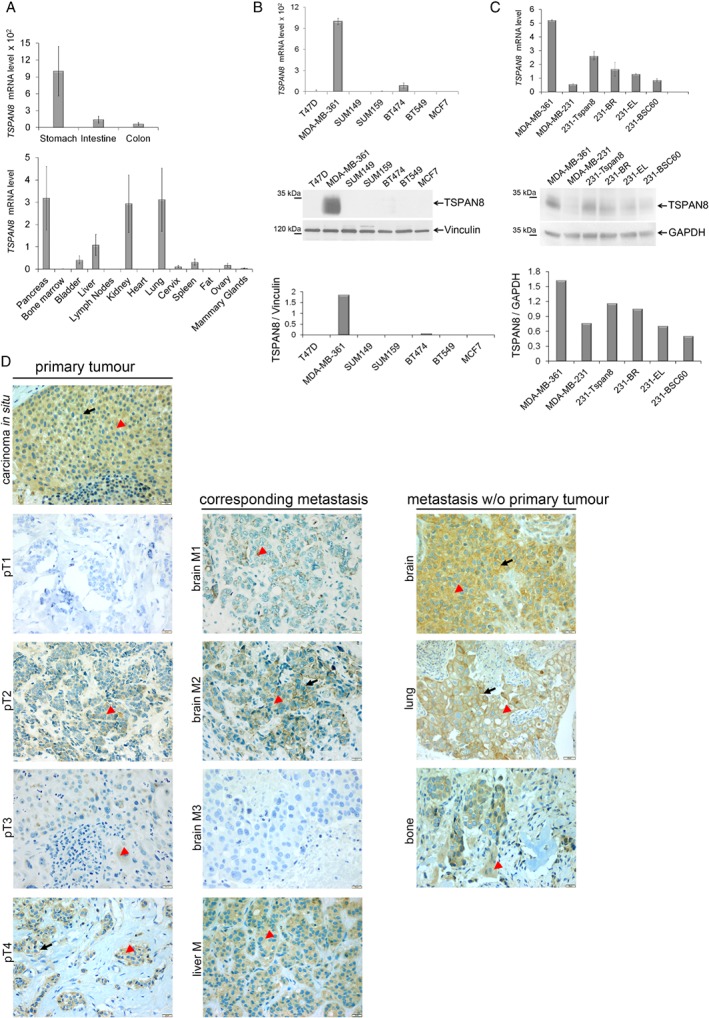
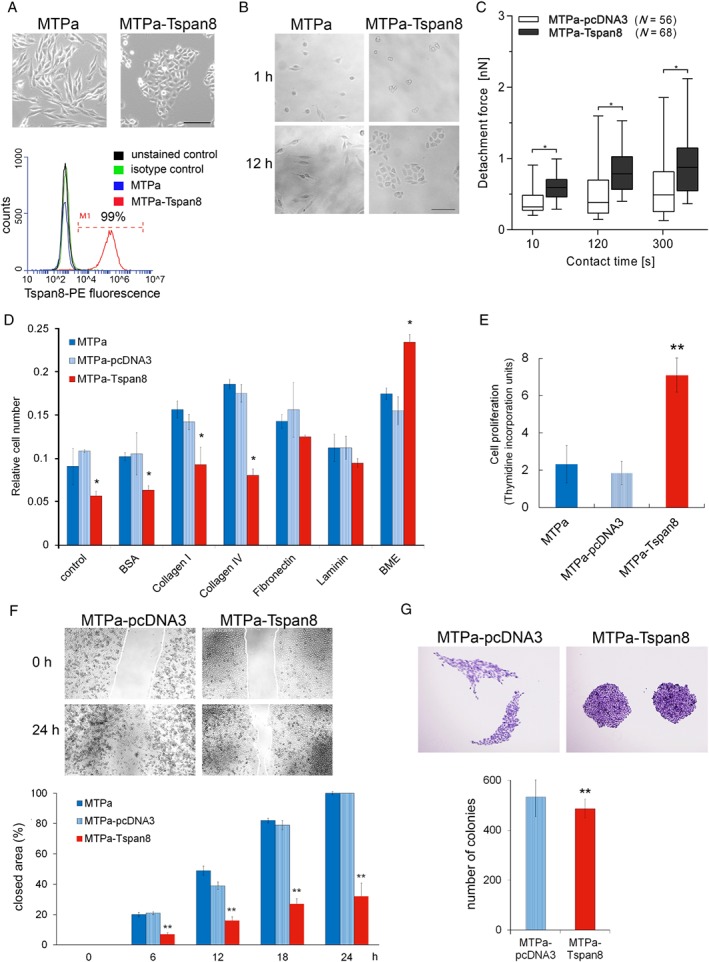
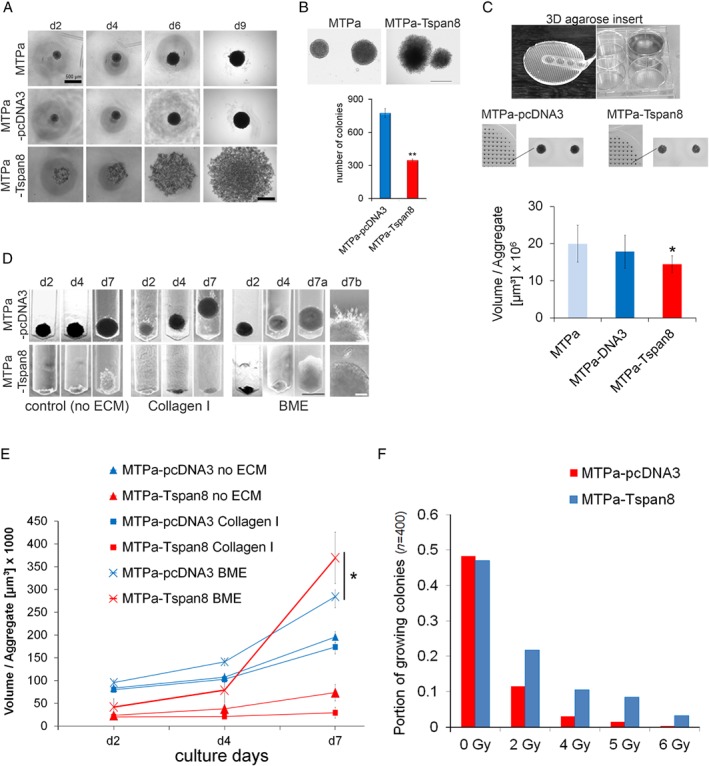
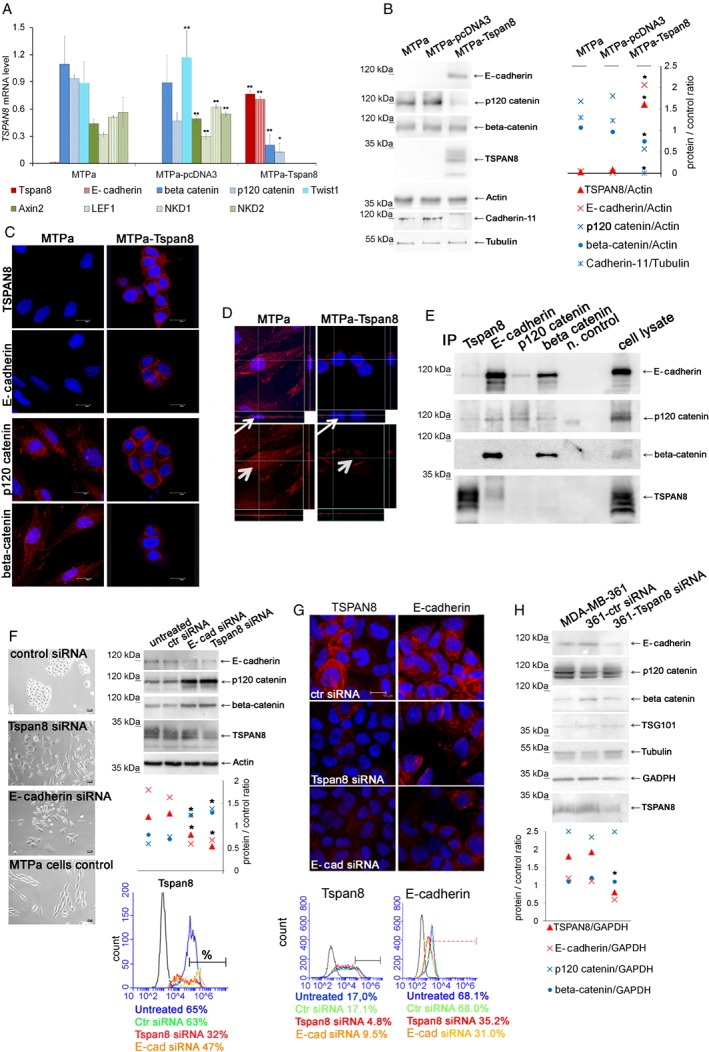
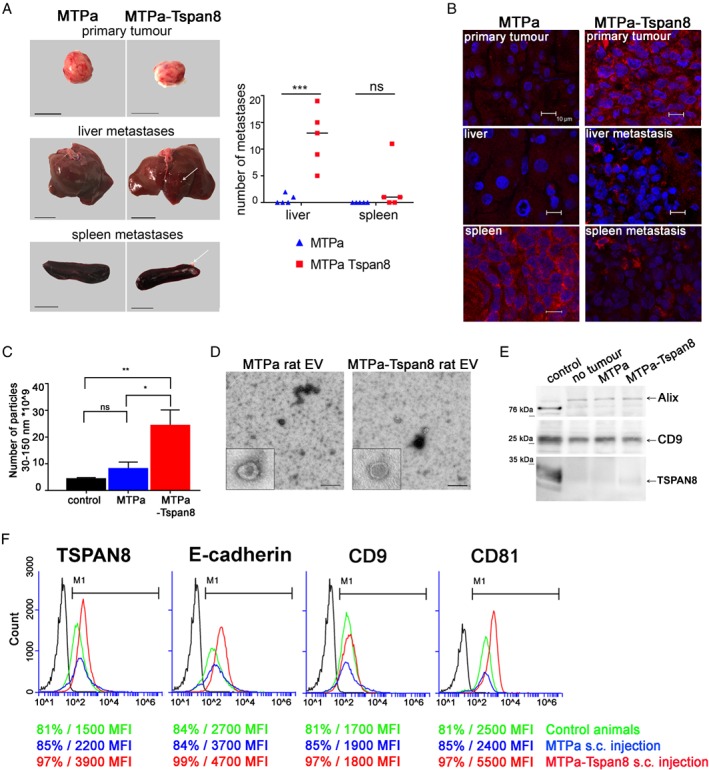
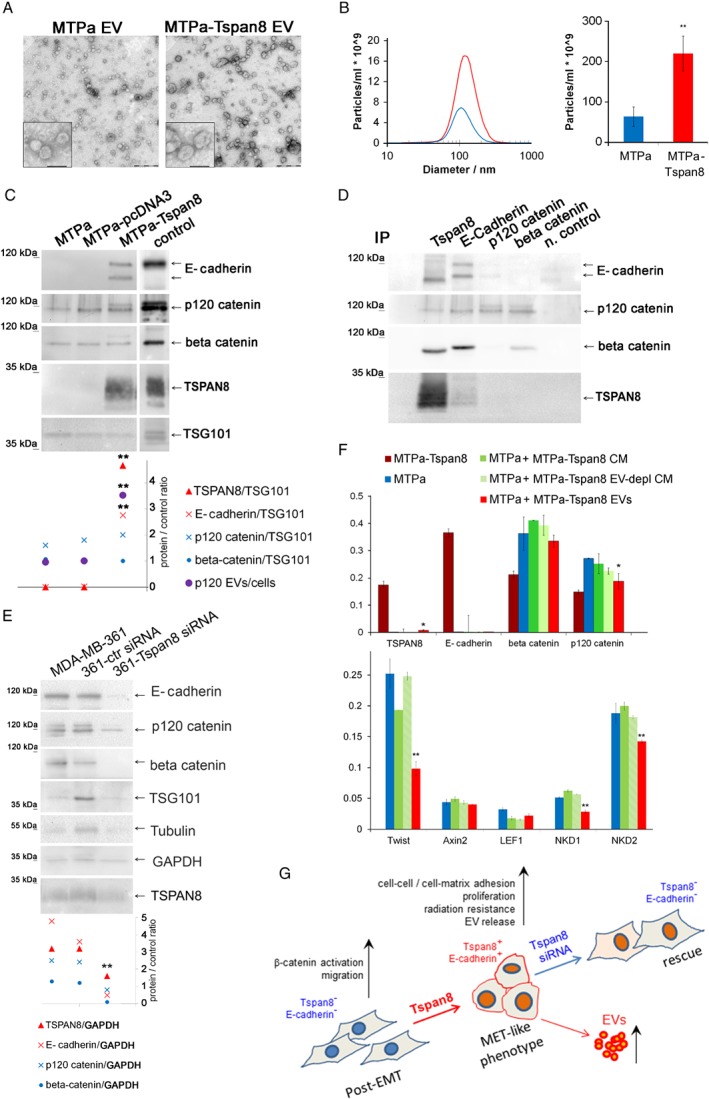
Tspan8 exhibits a functional role in many cancer types including pancreatic, colorectal, oesophagus carcinoma, and melanoma. We present a first study on the expression and function of Tspan8 in breast cancer. Tspan8 protein was present in the majority of human primary breast cancer lesions and metastases in the brain, bone, lung, and liver. In a syngeneic rat breast cancer model, Tspan8+ tumours formed multiple liver and spleen metastases, while Tspan8- tumours exhibited a significantly diminished ability to metastasise, indicating a role of Tspan8 in metastases. Addressing the underlying molecular mechanisms, we discovered that Tspan8 can mediate up-regulation of E-cadherin and down-regulation of Twist, p120-catenin, and β-catenin target genes accompanied by the change of cell phenotype, resembling the mesenchymal-epithelial transition. Furthermore, Tspan8+ cells exhibited enhanced cell-cell adhesion, diminished motility, and decreased sensitivity to irradiation. As a regulator of the content and function of extracellular vesicles (EVs), Tspan8 mediated a several-fold increase in EV number in cell culture and the circulation of tumour-bearing animals. We observed increased protein levels of E-cadherin and p120-catenin in these EVs; furthermore, Tspan8 and p120-catenin were co-immunoprecipitated, indicating that they may interact with each other. Altogether, our findings show the presence of Tspan8 in breast cancer primary lesion and metastases and indicate its role as a regulator of cell behaviour and EV release in breast cancer. © 2019 The Authors. The Journal of Pathology published by John Wiley & Sons Ltd on behalf of Pathological Society of Great Britain and Ireland.

Keywords: Tspan8; beta-catenin signalling pathway; breast cancer; extracellular vesicles; mesenchymal-epithelial transition; metastases; tetraspanins; three-dimensional cell culture.


Figures

Figure 1
Figure 1
Analysis of TSPAN8 expression in breast cancer cell lines and human tumours. (A) TSPAN8 mRNA expression was tested in different organs in mice using RT‐PCR. Highest expression was detected in the organs of the digestive system – stomach, intestine, and colon – which exhibited 100‐fold higher expression than in the other organs tested (see values on the y‐axis). (B) TSPAN8 expression was examined on RNA (upper panel) and protein levels (bottom panel) in seven breast cancer cell lines; GAPDH and vinculin were used as loading controls for RNA and proteins, respectively. TSPAN8 was strongly expressed only in the MDA‐MB‐361 cells derived from brain metastases. (C) MDA‐MB‐231 cell model, consisting of MDA‐MB‐231 parental cell line, 231‐BR brain‐seeking clone, and BSC60 bone‐seeking clone, was tested for TSPAN8 (upper panel) and TSPAN8 protein (bottom panel) expression. The 231‐Tspan8 cells – parental cell line stably transfected with Tspan8, and MDA‐MB‐361‐expressing endogenous Tspan8 were used as positive controls. Tspan8 revealed strongest expression in the 231‐BR cells. QPCR was performed in technical duplicates and biological triplicates; WB was repeated twice on independent preparations. (D) Immunohistochemistry of human samples for TSPAN8 was performed on paraffin blocks and representative specimens were chosen: on the upper panel, carcinoma in situ shows cytoplasmic localization of TSPAN8; four pairs of primary tumours (pT1, pT2, pT3, pT4) and corresponding metastases (brain M1, brain M2, brain M3, liver M4) originating from the same patient exhibit heterogeneous staining of TSPAN8 in primary tumours and in metastases. Right panel: a brain metastasis with strong membrane and cytoplasmic TSPAN8 staining, a lung metastasis with strong membrane and cytoplasmic staining, and a bone metastasis with cytoplasmic TSPAN8 staining are demonstrated. Arrowheads indicate cytoplasmic TSPAN8 and arrows membrane TSPAN8. Scale bar = 20 μm.
Figure 2
Figure 2
Tspan8 supports proliferation and cell–cell adhesion in breast cancer. (A) Upper panel: stable expression of Tspan8 in a rat breast cancer cell line MTPa leads to changes in cell morphology (scale bar = 200 μm). Bottom panel: Tspan8 surface expression was assessed using flow cytometry, which revealed 99% Tspan8+ cells. (B) Impact of Tspan8 on cell clustering was assessed. Cells were seeded at low density and monitored for 12 h. The experiment was repeated three times. (C) Cell–cell adhesion was tested using atomic force microscopy. Tspan8‐expressing cells exhibited significantly higher adhesion forces than cells transfected with a control pcDNA3 plasmid. The analysis on a single cell level revealed a high level of heterogeneity, showing strong variability of adhesive properties of single cells, resulting in high error bars calculated as a standard error by statistical analysis. (D) Cell–matrix adhesion was tested on different substrates using pre‐coated 24‐well plates. Tspan8 expression resulted in a significant reduction of cell–matrix adhesion when no additional coating was used and on the collagen I and IV matrixes; the BME coating resulted in a significant increase of cell–matrix adhesion of the MTPa‐Tspan8 cells. (E) To test cell proliferation, [3H]thymidine incorporation was measured. Tspan8 strongly supported cell proliferation. (F) Migration was tested using time‐lapse microscopy. Confluent cultures of the MTPa‐pcDNA3 and MTPa‐Tspan8 cells were used to produce a ‘wound’. Wound closure was observed for 24 h. Videos are available in supplementary material, Movies S1 and S2. Quantitative analysis of cell‐free areas performed using ImageJ Plugin (right panel) showed that Tspan8 strongly reduces cell migration over the ‘wound’ (scale bar = 1000 μm). The experiment was performed in biological duplicates and technical triplicates. p < 0.001 was considered as highly significant. (G) Colony‐forming ability was assessed by seeding 100 cells per 10 cm dish. While no significant difference in colony size was observed, Tspan8 mediated a slight but significant reduction of colony‐forming ability (scale bar = 500 μm).
Figure 3
Figure 3
Tspan8 supports proliferation in BME ECM and mediates radiation resistance in a 3D environment. (A) To characterise aggregate formation, 1000 cells per well were seeded in a 48‐well plate coated with 1.5% agarose gel and monitored for 9 days. MTPa cells formed tight cell aggregates, whereas the MTPa‐Tspan8 cells lost their ability for cell–cell contact and formed loose cell aggregates (scale bar = 200 μm). (B) Anchorage‐independent growth was tested using soft agar colony formation assay. MTPa‐Tspan8 cells formed about 300 colonies, whereas nearly 800 colonies were counted for MTPa‐pcDNA3 cells, showing a strong negative effect of Tspan8 on anchorage independence (scale bar = 500 μm). (C) A microwell array in six‐well plates (upper panel) was used to test cell proliferation under 3D conditions. For quantitative analysis, MTT staining (reflecting metabolic activity of the cells) was used (bottom panel). It showed a slight reduction of proliferation/metabolic activity of MTP‐Tspan8 cells compared with the MTPa‐pcDNA3 cells (scale bar = 1000 μm). (D) Cell invasion was tested in customised inserts (supplementary material, Figures S3 and S4) for 7 days without ECM (left panel), in collagen I (middle panel), and in BME (right panel, scale bar = 500 μm). (E) Quantitative analysis of cell invasion revealed that in BME, MTPa‐Tspan8 cells exhibit a significantly stronger proliferation than the parental MTPa‐pcDNA3 cells, showing an increased growth rate after day 4. (F) Gamma‐irradiation resistance of 3D cell aggregate was tested using 137Cs with 0.66 Gy/min on day 2 as described in supplementary material, Figure S5. A significantly higher number of the MTPa‐Tspan8 aggregates grew upon irradiation than the MTPa‐pcDNA3 aggregates. All experiments, if not otherwise mentioned, were repeated at least three independent times.
Figure 4
Figure 4
Tspan8 induces mesenchymal–epithelial transition. (A) Total RNA was harvested from MTPa, MTPa‐pcDNA3, and MTPa‐Tspan8 cells, and expression of mRNA coding for E‐cadherin, β‐catenin, p120‐catenin, Twist, and the β‐catenin target genes Axin2, LEF1, NKD1, and NKD2 was analysed by RT‐qPCR. GAPDH was used as a reference transcript. Overexpression of Tspan8 resulted in up‐regulation of E‐cadherin, highly significant down‐regulation of β‐catenin and p120‐catenin, and complete abrogation of Twist1, Axin2, LEF1, NKD1, and NKD2 expression. Technical duplicates and biological triplicates were analysed. (B) Cell lysates were prepared from MTPa, MTPa‐pcDNA3, and MTPa‐Tspan8 cells. WB analysis confirmed the presence of E‐cadherin. Densitometry analysis of protein signal intensity performed by ImageJ revealed significantly diminished levels of p120‐catenin and cadherin‐11 in the MTPa‐Tspan8 cells. No significant regulation of β‐catenin at the protein level was observed. The experiment was repeated five times. (C) Immunofluorescence analysis of the MTPa and MTPa‐Tspan8 cells. Cells were cultured for 24–48 h in chamber slides, fixed, and stained with the indicated antibodies. (D) Z‐stack of β‐catenin staining was generated for MTPa and MTPa‐Tspan8 cells. Red β‐catenin‐specific fluorescence was detected in the cytoplasm and in the nuclei of MTPa cells, but not of MTPa‐Tspan8 cells (small arrow in the Z‐stack and arrowhead in the x/y flat bottom image). Immunofluorescence was assessed four times independently. (E) Co‐immunoprecipitation was performed in the MTPa‐Tspan8 cell lysates using antibodies specific to Tspan8, E‐cadherin, p120‐catenin, and β‐catenin. As a negative control, cell lysates were incubated with the corresponding isotype control mouse IgG and protein G Sepharose. The experiment was performed three times. (F) Rescue of Tspan8‐induced MET was tested by Tspan8 and E‐cadherin knockdowns. Bright‐field images were taken 72 h after siRNA transfection of MTPa‐Tspan8 cells with siRNA. To assess knockdown, proteins were harvested 48 h post‐transfection, analysed by WB (right upper panel) and quantified using ImageJ (right middle panel). To assess surface expression, flow cytometry was performed 48 h after transfection (bottom panel). (G) Knockdown of Tspan8 and E‐cadherin was performed in MDA‐MB‐361 cells followed by immunofluorescence and flow cytometry. Heterogeneous Tspan8 staining was observed in cells transfected with control siRNA, and siRNAs specific for Tspan8‐ and E‐cadherin. The experiment was performed three times and representative images are shown. Changes in Tspan8 and E‐cadherin surface expression after siRNA were assessed by flow cytometry (bottom panel). The proportion of Tspan8 strongly‐positive cells was calculated. The experiment was repeated twice; representative diagrams are shown. (H) MDA‐MB‐361 cells were transfected with scramble‐siRNA and Tspan8‐siRNA; proteins were harvested 48 h post‐transfection and analysed by WB followed by densitometry analysis using ImageJ. Both Tspan8 and E‐cadherin were significantly down‐regulated, while neither β‐catenin nor p120‐catenin was affected (bottom panel).
Figure 5
Figure 5
Tspan8 supports metastases and mediates a significant increase in EV number in the circulation in vivo. (A) Orthotopic injection of rats was performed using 1 × 106 MTPa or MTPa‐Tspan8 cells per animal; cells were injected into the mammary fat pad (five animals per group). At day 18, animals were sacrificed and organs isolated. Representative images of primary tumours, liver, and spleen are shown. Pictures were taken and metastases counted using ImageJ. (B) Immunofluorescence was performed on frozen sections of primary tumours and liver and spleen specimens from both the animals harbouring MTPa‐ and those harbouring MTPa‐Tspan8 tumours. (C) EVs were collected from rat blood and measured by NTA. Significantly higher numbers of EV were detected in the blood of rats injected with MTPa‐Tspan8 cells. (D) Transmission electron microscopy of EV preparations revealed vesicular structures typical for EVs isolated from blood. (E) EVs were lysed and equal amounts of proteins were loaded for WB analysis and tested with CD9, Alix, and Tspan8 antibodies. No differences in CD9 and Alix protein amounts were observed in control animals and in animals harbouring MTPa or MTPa‐Tspan8 tumours. (F) Flow cytometry analysis of EVs. Tspan8, CD9, and CD81 were tested and the percentage of positive EVs and the MFI value were counted. Strong differences in the MFI values between the origin of EVs from control animals (green line) and the origin of EVs from MTPa (blue line) and MTPs‐Tspan8 (red line) animals were noticed, showing a strong increase in the MFI of Tspan8 and CD81 in EVs derived from MTPa‐Tspan8 animals. Flow cytometry was performed twice and representative images are shown.
Figure 6
Figure 6
Tspan8 mediates increased EV release in vitro and supports recruitment of E‐cadherin and catenins to EVs. (A) Transmission electron microscopy of EVs released by the MTPa and MTPa‐Tspan8 cells. Scale bar equals 500 nm in the large panel and 100 nm in the image with higher magnification. (B) NTA was done with each of the samples isolated and a representative image is shown. Statistical analysis of four independent measurements showed a highly significant increase in EV number (right panel). (C) EVs of MTPa, MTPa‐pcDNA3, and MTPa‐Tspan8 cells were lysed and WB was performed. Densitometry showed a significant increase in the amount of Tspan8, E‐cadherin, and p120‐catenin in EVs of MTPa‐Tspan8 cells; for p120‐catenin, a ratio of protein amount in EVs/protein amount in cells was calculated. (D) Co‐immunoprecipitation was performed in the MTPa‐Tspan8 EVs using antibodies specific to Tspan8, E‐cadherin, p120‐catenin, and β‐catenin. As a negative control, EV lysate was incubated with the corresponding isotype control mouse IgG and protein G Sepharose. The experiment was performed three times. (E) MDA‐MB‐361 cells were transfected either with control siRNA or with Tspan8‐siRNA; EVs were isolated 48 h post‐transfection and analysed by WB followed by densitometry analysis using ImageJ. GAPDH was used as a loading control. (F) Functional analysis with EVs released from the MTPa‐Tspan8 cells was performed. The MTPa cells were treated daily with MTPa‐Tspan8 EVs (5 μg/ml) for 5 days. As controls, MTPa cells were also treated with conditioned cell culture medium (MTPa‐Tspan8 CM) and with EV‐depleted cell culture medium (MTPa‐Tspan8 EV‐depl CM) in order to discriminate between EV‐specific and EV‐non‐specific effects. At day 6, the cells were lysed and RNA was isolated and analysed using RT‐qPCR. Expression of Tspan8, E‐cadherin, β‐catenin, p120‐catenin, Twist, and the β‐catenin target genes Axin2, LEF1, NKD1, and NKD2 was examined. Significant down‐regulation of p120‐catenin, Twist, NKD1, and NKD2, and up‐regulation of Tspan8 were observed, indicating that MTPa‐Tspan8 EVs may affect features of the MTPa parental cells.

References

    1. Kalluri R, Weinberg RA. The basics of epithelial–mesenchymal transition. J Clin Invest 2009; 119: 1420–1428. - PMC - PubMed
    1. Brabletz T. To differentiate or not – routes towards metastasis. Nat Rev Cancer 2012; 12: 425–436. - PubMed
    1. Fischer KR, Durrans A, Lee S, et al Epithelial‐to‐mesenchymal transition is not required for lung metastasis but contributes to chemoresistance. Nature 2015; 527: 472–476. - PMC - PubMed
    1. Zheng X, Carstens JL, Kim J, et al Epithelial‐to‐mesenchymal transition is dispensable for metastasis but induces chemoresistance in pancreatic cancer. Nature 2015; 527: 525–530. - PMC - PubMed
    1. Bill R, Christofori G. The relevance of EMT in breast cancer metastasis: correlation or causality? FEBS Lett 2015; 589: 1577–1587. - PubMed

Publication types

MeSH terms