. 2020 Feb;16(2):347-370.
doi: 10.1080/15548627.2019.1603545. Epub 2019 Apr 14.

Age-dependent accumulation of oligomeric SNCA/α-synuclein from impaired degradation in mutant LRRK2 knockin mouse model of Parkinson disease: role for therapeutic activation of chaperone-mediated autophagy (CMA)

Affiliations

Age-dependent accumulation of oligomeric SNCA/α-synuclein from impaired degradation in mutant LRRK2 knockin mouse model of Parkinson disease: role for therapeutic activation of chaperone-mediated autophagy (CMA)

Philip Wing-Lok Ho et al. Autophagy. 2020 Feb.

Abstract

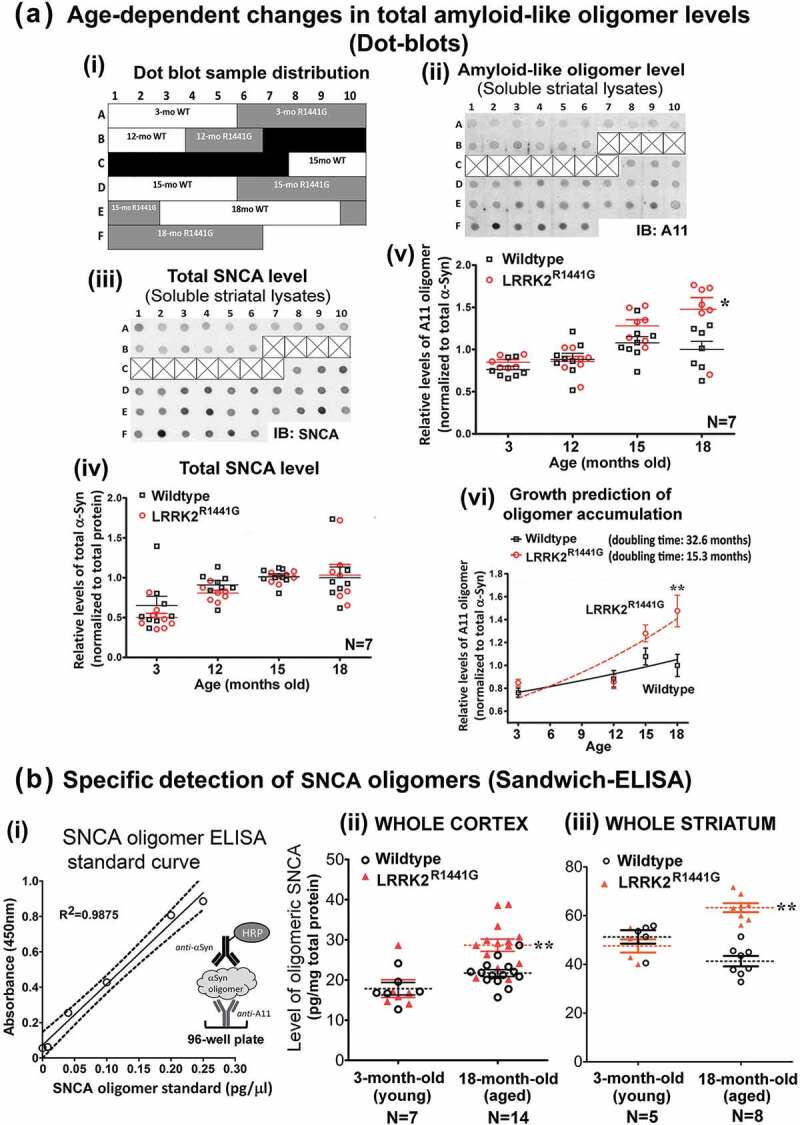
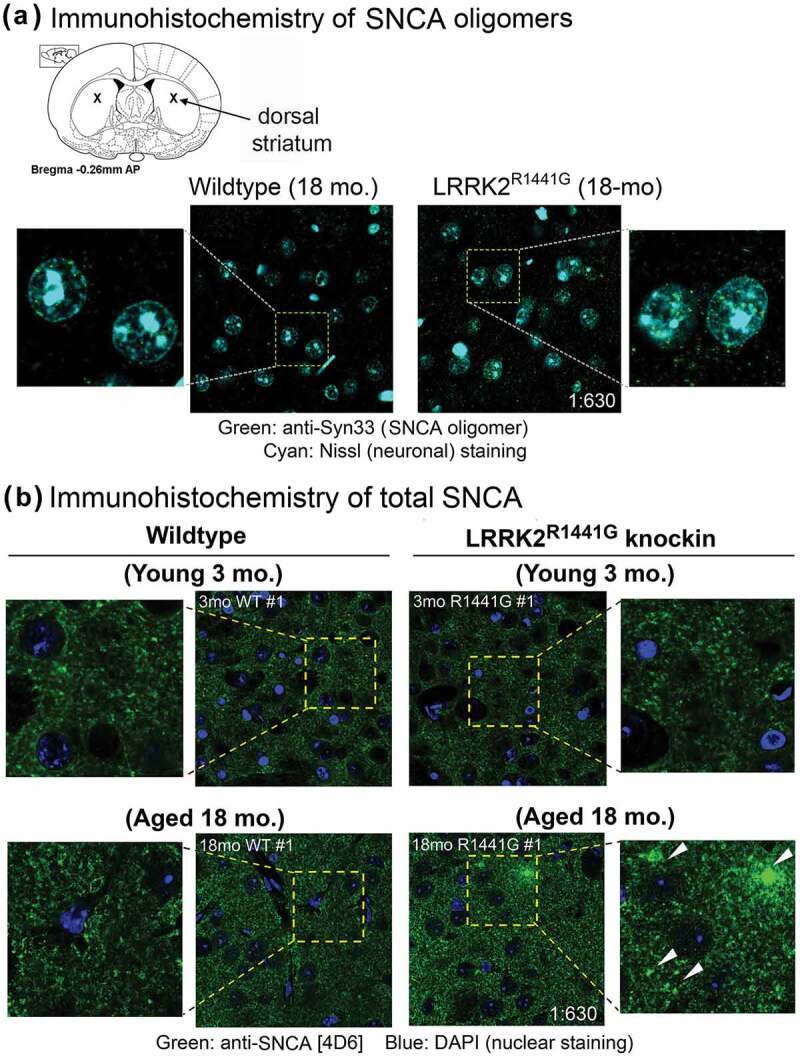
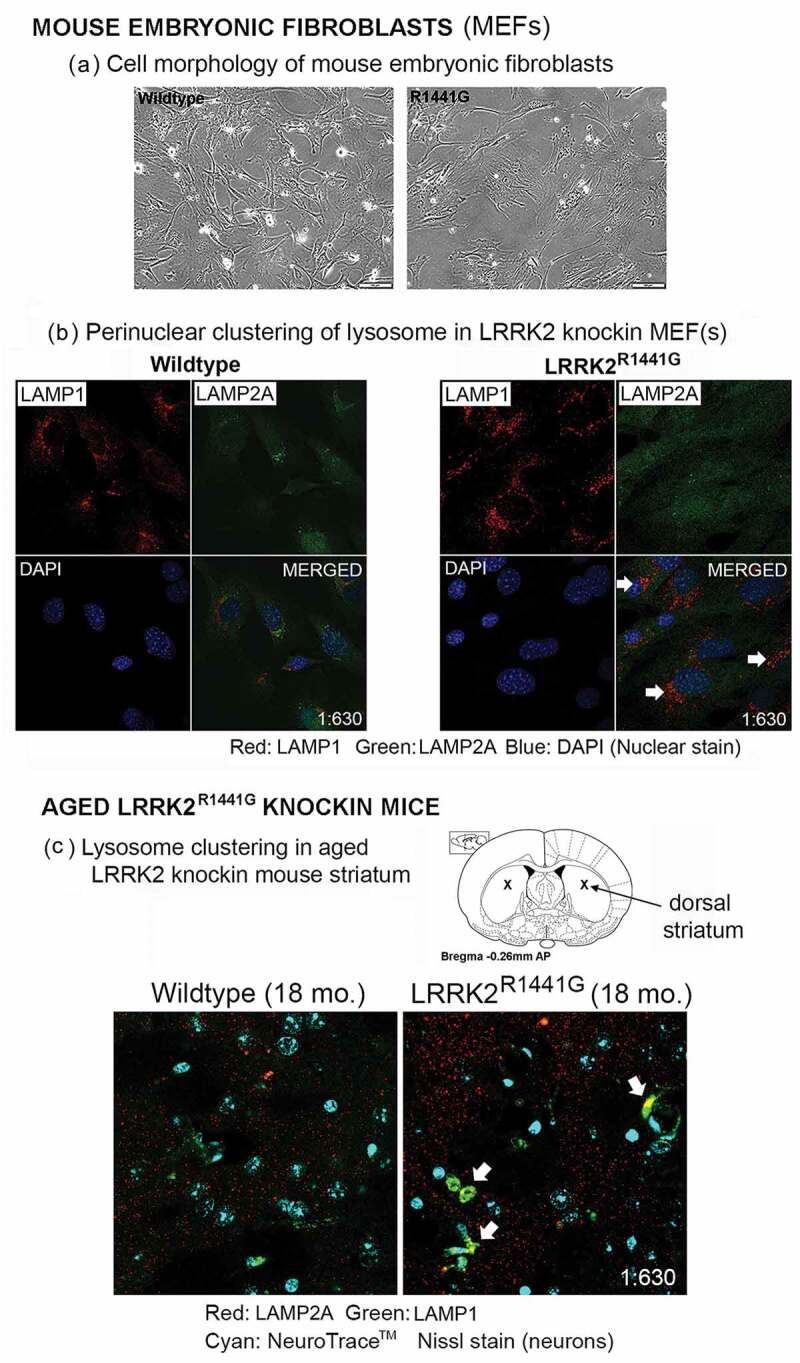
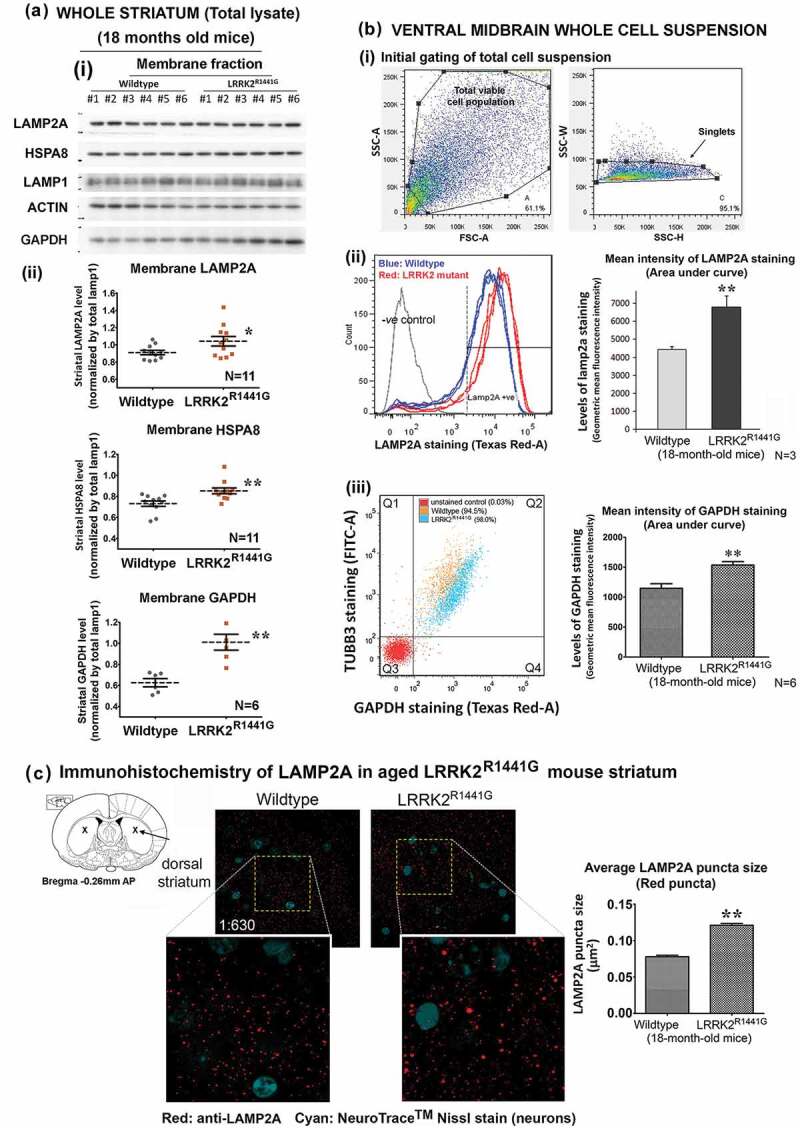
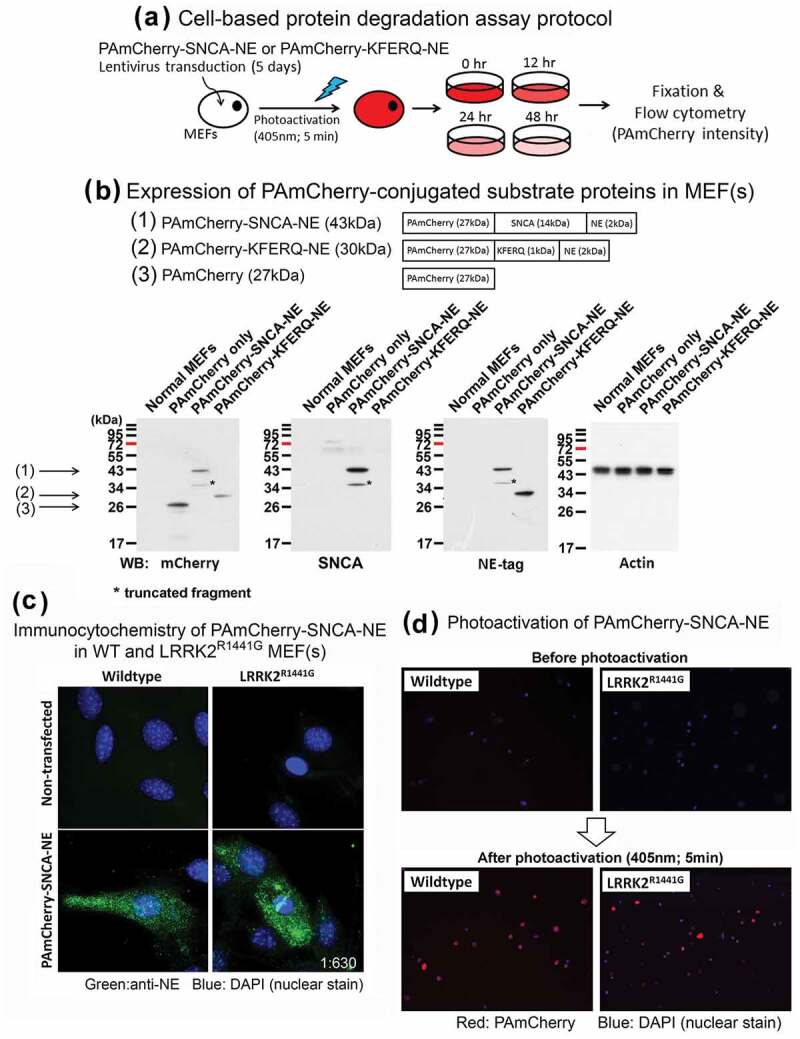
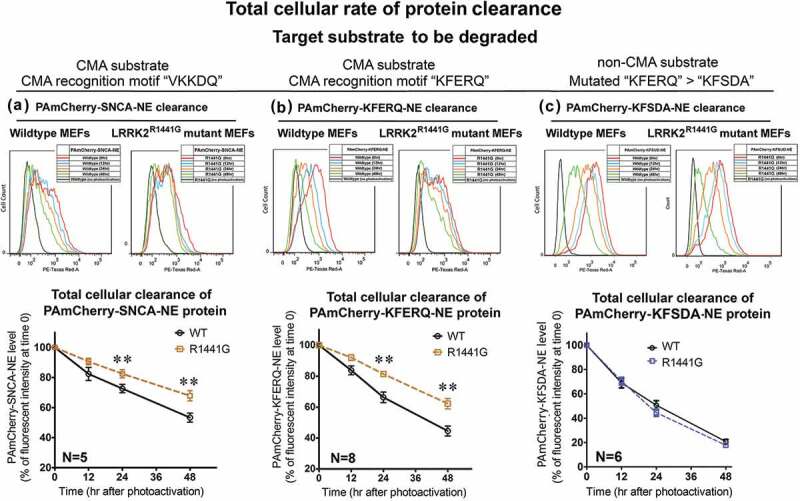
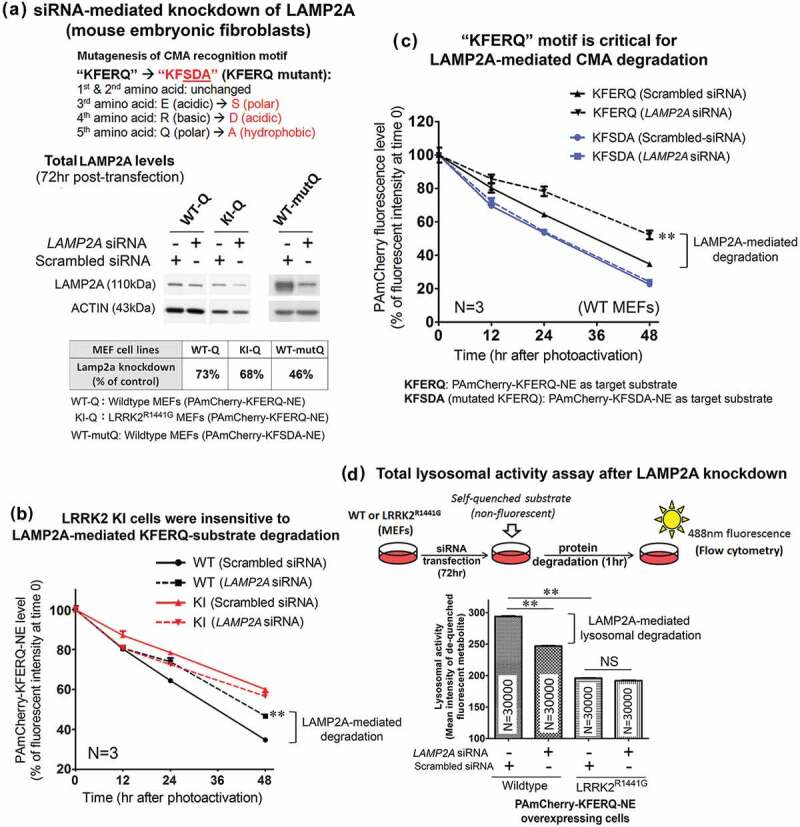
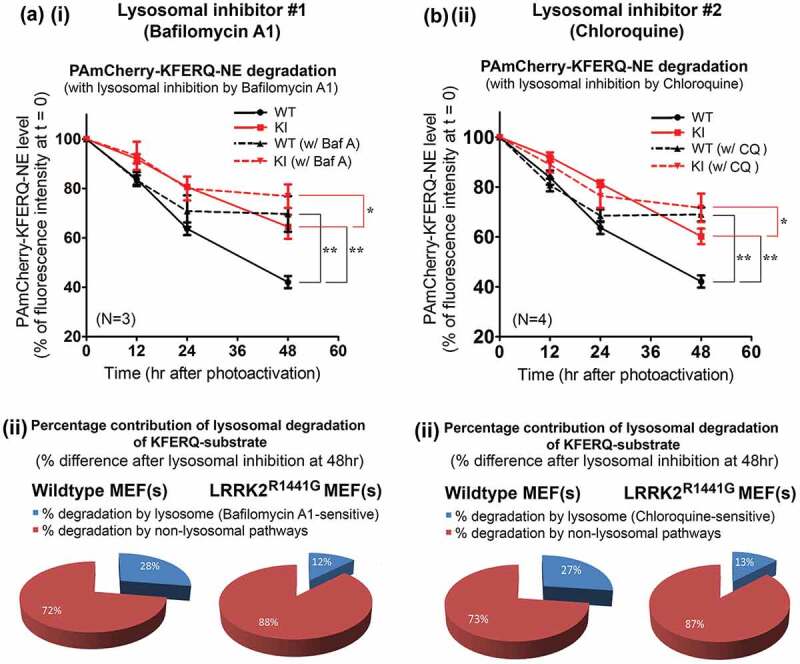
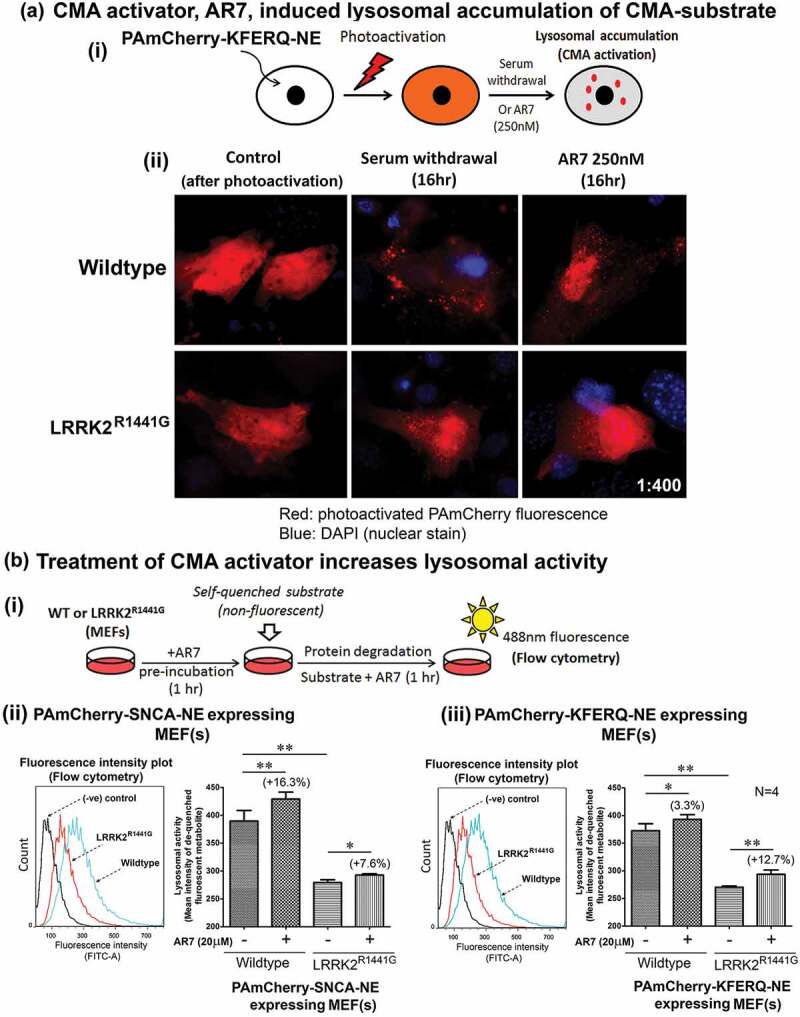
Parkinson disease (PD) is an age-related neurodegenerative disorder associated with misfolded SNCA/α-synuclein accumulation in brain. Impaired catabolism of SNCA potentiates formation of its toxic oligomers. LRRK2 (leucine-rich repeat kinase-2) mutations predispose to familial and sporadic PD. Mutant LRRK2 perturbs chaperone-mediated-autophagy (CMA) to degrade SNCA. We showed greater age-dependent accumulation of oligomeric SNCA in striatum and cortex of aged LRRK2R1441G knockin (KI) mice, compared to age-matched wildtype (WT) by 53% and 31%, respectively. Lysosomal clustering and accumulation of CMA-specific LAMP2A and HSPA8/HSC70 proteins were observed in aged mutant striatum along with increased GAPDH (CMA substrate) by immunohistochemistry of dorsal striatum and flow cytometry of ventral midbrain cells. Using our new reporter protein clearance assay, mutant mouse embryonic fibroblasts (MEFs) expressing either SNCA or CMA recognition 'KFERQ'-like motif conjugated with photoactivated-PAmCherry showed slower cellular clearance compared to WT by 28% and 34%, respectively. However, such difference was not observed after the 'KFERQ'-motif was mutated. LRRK2 mutant MEFs exhibited lower lysosomal degradation than WT indicating lysosomal dysfunction. LAMP2A-knockdown reduced total lysosomal activity and clearance of 'KFERQ'-substrate in WT but not in mutant MEFs, indicating impaired CMA in the latter. A CMA-specific activator, AR7, induced neuronal LAMP2A transcription and lysosomal activity in MEFs. AR7 also attenuated the progressive accumulation of both intracellular and extracellular SNCA oligomers in prolonged cultures of mutant cortical neurons (DIV21), indicating that oligomer accumulation can be suppressed by CMA activation. Activation of autophagic pathways to reduce aged-related accumulation of pathogenic SNCA oligomers is a viable disease-modifying therapeutic strategy for PD.Abbreviations: 3-MA: 3-methyladenine; AR7: 7-chloro-3-(4-methylphenyl)-2H-1,4-benzoxazine; CMA: chaperone-mediated autophagy; CQ: chloroquine; CSF: cerebrospinal fluid; DDM: n-dodecyl β-D-maltoside; DIV: days in vitro; ELISA: enzyme-linked immunosorbent assay; FACS: fluorescence-activated cell sorting; GAPDH: glyceraldehyde-3-phosphate dehydrogenase; GWAS: genome-wide association studies; HSPA8/HSC70: heat shock protein 8; KFERQ: CMA recognition pentapeptide; KI: knockin; LAMP1: lysosomal-associated membrane protein 1; LAMP2A: lysosomal-associated membrane protein 2A; LDH: lactate dehydrogenase; LRRK2: leucine-rich repeat kinase 2; MEF: mouse embryonic fibroblast; NDUFS4: NADH:ubiquinone oxidoreductase core subunit S4; NE: novel epitope; PD: Parkinson disease; RARA/RARα: retinoic acid receptor, alpha; SNCA: synuclein, alpha; TUBB3/TUJ1: tubulin, beta 3 class III; WT: wild-type.

Keywords: Alpha-synuclein; LRRK2; Parkinson disease; aging; chaperone-mediated autophagy; knockin mouse model; oligomers; protein aggregation; protein degradation; therapeutic strategy.


Figures

Figure 1.
Figure 1.
LRRK2R1441G KI mutation caused an age-dependent increase of SNCA oligomers in mouse brain striatum and cortex. (a) (i) Layout of example dot blots shown below, (ii) example of amyloid-like oligomer (‘A11’) dot blots, (iii) example of total SNCA dot blots, (iv) relative levels of total SNCA, (v) relative levels of amyloid-like oligomers in soluble striatal lysates extracted from LRRK2R1441G KI mice and their WT littermates at 3, 12, 15 and 18 months (N = 7). Each data point represents measurement of 1μg striatal lysate from each individual mouse. (vi) Predicted rate of increase of ‘A11’ oligomer levels with age in LRRK2 KI mice was significantly higher than that in WT mice as estimated by mathematical fitting of their corresponding growth curves. Predicted doubling time of oligomer formation in KI mice was 15.3 months (95% CI = 10.4 to 29.13), as compared with 32.6 months (95% CI = 18.39 to 143.9) for WT mice. (b) (i) SNCA oligomer ELISA standard curve. Levels of SNCA oligomer in (ii) striatal soluble lysates, and (iii) cortical soluble lysates from LRRK2R1441G KI mice and their age-matched WT controls determined by a sandwich-ELISA. Quantification of SNCA oligomer in samples was based on (i) a standard curve generated from purified recombinant SNCA oligomer standards (Figure S1). Data are expressed as mean ± S.E.M. Statistical significance at the level of *p < 0.05 and **p < 0.01, as compared to WT controls by post-hoc multiple comparison following two-way ANOVA.
Figure 2.
Figure 2.
Immunohistochemistry to SNCA oligomers and granules in aged WT and LRRK2R1441G KI mouse striatum. (a) Accumulation of SNCA oligomers in aged (18-month old) mouse dorsal striatum was demonstrated by immunostaining using a SNCA oligomer-specific antibody (‘Syn33’; Merck Millipore™, ABN2265). Aged (18-month old) LRRK2R1441G KI striatum showed significantly more SNCA oligomer staining (green), as compared with that in age-matched WT littermates. Neuronal cell bodies were counterstained by NeuroTrace™ Nissl staining (cyan). (b) More SNCA-positive granules (green; arrowheads) were also seen in aged (18-month old) LRRK2R1441G KI mouse striatum as compared with those in age-matched WT littermates by immunostaining using anti-SNCA [4D6] monoclonal antibody (Abcam™, ab1903). There was no observable difference in the staining pattern and intensity of SNCA in young (3-month old) WT and KI brains, indicating that SNCA aggregation increased with age in LRRK2R1441G KI mice. Magnification: 1 × 630.
Figure 3.
Figure 3.
Perinuclear clustering of lysosomes associated with LRRK2R1441G KI mutation. (a) Cell morphology of littermate-matched WT and LRRK2R1441G KI mouse embryonic fibroblasts (MEFs). (b) Lysosomes were visualized by immunofluorescence staining of lysosome marker protein, LAMP1 (red) and CMA-specific LAMP2A (green). LRRK2R1441G KI mutant MEFs cultured under normal condition showed more clustering of lysosomes at around perinuclear region (arrows) without observable change in gross cell morphology and viability. (c) Representative confocal photomicrographs showing more clustering of lysosomes (arrows) in the dorsal striatum of aged (18-month old) LRRK2R1441G KI mice but only rarely found in age-matched WT controls, suggesting impaired cellular protein degradation in LRRK2 KI mouse brains. Neuronal cell bodies were counterstained by NeuroTrace™ Nissl staining (cyan). Magnification: 1 × 630.
Figure 4.
Figure 4.
Increased levels of CMA-associated lysosomal LAMP2A, and HSPA8 protein in the striatum and ventral midbrain of aged LRRK2R1441G KI mice compared with those in age-matched WT mice. (a)(i) Whole mouse striatum was dissected and homogenized by sonication in cold PBS supplemented with a protease inhibitor cocktail (Sigma Aldrich™, 11836153001) to isolate the cytosolic fraction. The insoluble pellets consisting of total cellular membranous fraction were completely dissolved in 1% DDM (n-dodecyl-β-D-maltoside) for SDS-PAGE and western blotting, # indicates solubilized lysate from individual mice; (ii) Densitometry analysis of western blots showed that LAMP2A (N = 11), HSPA8 (N = 11) and a well-described CMA substrate, GAPDH (N = 6), were significantly increased in membranous fractions of mouse LRRK2R1441G KI striatum as compared to WT mice. (b) Freshly dissected ventral midbrains of aged WT and LRRK2R1441G KI mice were dissociated by papain to obtain single cell suspension, and were subsequently stained for LAMP2A and GAPDH using an excess amount of antibodies. (i and ii) Total cellular levels of LAMP2A in both WT and LRRK2R1441G KI mice were compared using flow cytometry based on the mean staining intensity (area under curve) of the protein. Ventral midbrain LAMP2A level in aged LRRK2R1441G KI mice was significantly higher as compared with that in their age-matched WT controls (N = 3). (iii) Relative amount of GAPDH in neurons was measured in flow cytometry after co-staining of GAPDH and neuronal marker protein TUBB3. The mean staining intensity (area under curve) of double-positive cell population (Q2) showed that GAPDH level was significantly higher in aged LRRK2R1441G KI mouse midbrain neurons (N = 6). Data are expressed as mean ± S.E.M. Statistical significance by unpaired t-test at the level of *p < 0.05 and **p < 0.01, as compared to WT controls. (c) Immunohistochemistry of LAMP2A in aged mouse striatum revealed abnormal lysosomal LAMP2A accumulation as shown in the form of bigger puncta (red) in LRRK2R1441G KI mice, suggesting perturbed CMA. Average puncta size calculation was based on random puncta images from aged WT and KI mouse striatum (N = 3), respectively. Statistical significance by unpaired Student’s t-test at the level of **p < 0.01, as compared to WT controls.
Figure 5.
Figure 5.
Development of a photoactivatable fluorescence-based cell culture model to determine rate of cellular clearance of SNCA and a CMA-specific KFERQ-peptide. (a) Wildtype or LRRK2R1441G KI mutant mouse embryonic fibroblasts (MEFs) were transduced with lentivirus for 5 days to express either full-length SNCA or KFERQ-peptide conjugated with photoactivatable PAmCherry protein and a novel protein tag ‘NE’ for detection. (b) Expression of correct target protein was confirmed in each MEF clones by western blotting based on verification of their corresponding protein size using antibodies against SNCA, mCherry, and NE. (c) PAmCherry-SNCA-NE protein expressed in both WT and LRRK2R1441G KI mutant MEF(s) was visualized by immunocytochemistry against NE tag (green); Magnification: 1 × 630. (d) MEF(s) expressing SNCA or KFERQ-peptide were exposed to UV-A (405 nm) for 5 min to induce mCherry fluorescence emission. Magnification: 1 × 40.
Figure 6.
Figure 6.
LRRK2R1441G KI mutant MEFs catabolize SNCA and ‘KFERQ’ substrate peptide more slowly because of impaired LAMP2A-mediated protein clearance. Representative flow cytometry intensity plots of photoactivated WT and LRRK2 KI MEFs harvested at different time points for (a) SNCA; (b) ‘KFERQ’ substrate peptide; and (c) ‘KFSDA’ (‘KFERQ’ mutant) substrate peptide. The rate of protein catabolism was expressed as time-dependent change in levels of PAmCherry fluorescence in both WT and mutant MEFs compared with the level at time t = 0. LRRK2R1441G KI mutant cells have a significantly lower rate of cellular protein clearance as compared with that of WT cells (N = 5–8). Data are expressed as mean ± S.E.M. **p < 0.01 represents statistical significance as compared to WT MEFs at the respective time points by post-hoc multiple comparisons after two-way ANOVA.
Figure 7.
Figure 7.
LAMP2A-specific CMA protein degradation was not observed in LRRK2R1441G KI mutant MEF(s). (a) Total cellular LAMP2A protein expression was knocked down by transfection of siRNA(s) for 72 h and confirmed by western blots. (b) The clearance rate of CMA-specific KFERQ substrate peptide was significantly decreased in WT MEFs after LAMP2A knockdown (N = 4; p < 0.01). However, similar decrease was not observed in KI MEFs after LAMP2A knockdown, indicating that CMA-specific protein degradation was impaired in LRRK2 mutant cells. (c) LAMP2A knockdown in WT MEFs caused a significant decrease in ‘KFERQ’ substrate clearance as compared with its corresponding control cells transfected with scrambled negative siRNA (N = 4; p < 0.01). Such LAMP2A knockdown-induced decrease was not observed when ‘KFERQ’ recognition motif was mutated (i.e. ‘KFSDA’). Data are expressed as mean ± S.E.M. Statistical significance was calculated by post-hoc multiple comparisons after two-way ANOVA at the level of **p < 0.01 as compared to its corresponding group transfected with scrambled siRNA (N = 3). (d) Total lysosomal activity was measured by an enzymatic assay kit based on degradation of a self-quenched lysosomal substrate followed by flow cytometry. Lysosomal activity in WT MEFs was significantly higher than in LRRK2R1441G KI mutant cells. LAMP2A knockdown significantly decreased total lysosomal activity in WT MEF(s), but not in LRRK2R1441G KI mutant cells. Data are expressed as mean ± S.E.M. Statistical significance was calculated by unpaired Student’s t-test at the level of **p < 0.01 between two comparing groups. ‘NS’ indicates no statistical significance between the two designated groups.
Figure 8.
Figure 8.
Lower relative contribution of lysosomal degradation of ‘KFERQ’-like substrate (as a percentage of total cellular protein clearance) in LRRK2R1441G KI MEFs. Representative flow cytometry intensity plots of photoactivated WT and KI MEFs collected at different time points after treated with either (a) (i and ii) bafilomycin A1 (100 nM) or (b) (i and ii) chloroquine (CQ; 20 μM) to determine specific reduction in overall clearance due to lysosomal inhibition. The time-dependent clearance of ‘KFERQ’-substrates in both WT and KI MEFs with and without lysosomal inhibition were determined as compared with their corresponding levels of PAmCherry at t = 0, expressed as a percentage. The relative contribution of lysosomal degradation in the overall substrate clearance was determined by the percentage difference between the inhibitor-treated and its corresponding untreated control cells at 48 h. Data are expressed as mean ± S.E.M. **p < 0.01 and *p < 0.05 represent statistical significance between two designated groups at 48 h by post-hoc multiple comparisons after two-way ANOVA.
Figure 9.
Figure 9.
Treatment with RARA antagonist, AR7, increased lysosomal activity in WT and LRRK2R1441G KI mutant MEFs. (a) Treatment of CMA activator, AR7 (RARA antagonist) induced lysosomal accumulation (as visualized in form of puncta) of CMA substrate in MEFs. WT and KI MEFs stably expressing PAmCherry-KFERQ-NE were treated with AR7 for 16 h in complete culture medium. In parallel control groups, MEFs were cultured in serum-free medium (i.e. serum deprivation/starvation), which is known to induce CMA. Cells were photoactivated after treatment and observed under fluorescence microscopy for puncta (arrowheads) formation. (b) (i) Pre-incubation of CMA activator, AR7 (20 μM), significantly increased the total lysosomal activity in both WT and LRRK2R1441G KI mutant MEFs expressing either (ii) SNCA or (iii) KFERQ-peptide, as compared with their corresponding untreated groups (N = 4). LRRK2R1441G KI MEF(s) have lower overall lysosomal degradation activity as compared with that of WT controls. Data are expressed as mean ± S.E.M. Statistical significance at *p < 0.05 and **p < 0.01 between two designated groups by unpaired Student’s t-test.
Figure 10.
Figure 10.
Treatment of CMA activator AR7 dose-dependently reduced intracellular and extracellular SNCA oligomer levels in LRRK2R1441G KI mutant primary cortical neurons. (a) (i) Primary cortical neurons (DIV9) from WT and LRRK2R1441G KI mutant mice were cultured with or without AR7 at 0, 10, or 20 μM. (i) Treatment of AR7 in primary cortical neurons from DIV9 to DIV21 did not cause severe cell morphological changes, and cytotoxicity (Figure S7). (ii-iii) Total cell lysates and the corresponding conditioned media were collected at different time points (DIV9, 14, and 21) to measure the levels of SNCA oligomer by ELISA. LRRK2R1441G KI primary neurons have significantly higher level of SNCA oligomers than WT neurons at all time points. Treatment of AR7 significantly prevented accumulation of both intracellular and extracellular SNCA oligomers in LRRK2R1441G KI primary neurons. Data are expressed as mean ± S.E.M. Statistical significance is shown by post-hoc multiple comparison following two-way ANOVA at the level of *p < 0.05 and **p < 0.01, as compared to WT controls at its corresponding time points; and #p < 0.05 and ##p < 0.01 as compared to untreated KI controls at its corresponding time point. (b) (i) Total cellular levels of SNCA, LAMP2A and HSPA8 at different time points (DIV9, 14, and 21) were determined by western blots. There was no significant difference in the levels of (ii) total SNCA between WT and KI neurons. Treatment of AR7 significantly reduced total intracellular SNCA in both WT and LRRK2R1441G KI neurons, as compared to their corresponding vehicle-treated control groups (N = 4). AR7 treatment in 24 h dose-dependently induced (iii) Lamp2a mRNA expression in both WT and KI cells (N = 3). However, no significant change in levels of total cellular (iv) LAMP2A and (v) HSPA8 protein was observed in both WT and KI cultures with AR7 treatment at DIV21. Statistical significance is shown at the level of *p < 0.05 and **p < 0.01, as compared to their corresponding vehicle-treated control groups by post-hoc multiple comparison following two-way ANOVA.

Similar articles

Cited by

References

    1. de Lau LM, Breteler MM.. Epidemiology of Parkinson’s disease. Lancet Neurol. 2006;5(6):525–535. - PubMed
    1. Lesage S, Brice A.. Parkinson‘s disease: from monogenic forms to genetic susceptibility factors. Hum Mol Genet. 2009;18(R1):R48–R59. - PubMed
    1. Lin MK, Farrer MJ. Genetics and genomics of Parkinson‘s disease. Genome Med. 2014;6(6):48. - PMC - PubMed
    1. Verstraeten A, Theuns J, Van Broeckhoven C. Progress in unraveling the genetic etiology of Parkinson disease in a genomic era. Trends Genet. 2015;31(3):140–149. - PubMed
    1. Satake W, Nakabayashi Y, Mizuta I, et al. Genome-wide association study identifies common variants at four loci as genetic risk factors for Parkinson’s disease. Nat Genet. 2009;41:1303–1307. - PubMed

Publication types

MeSH terms

Substances