

Combined Sabal and Urtica Extracts (WS® 1541) Exert Anti-proliferative and Anti-inflammatory Effects in a Mouse Model of Benign Prostate Hyperplasia
- PMID: 30984003
- PMCID: PMC6450068
- DOI: 10.3389/fphar.2019.00311
Combined Sabal and Urtica Extracts (WS® 1541) Exert Anti-proliferative and Anti-inflammatory Effects in a Mouse Model of Benign Prostate Hyperplasia
Abstract
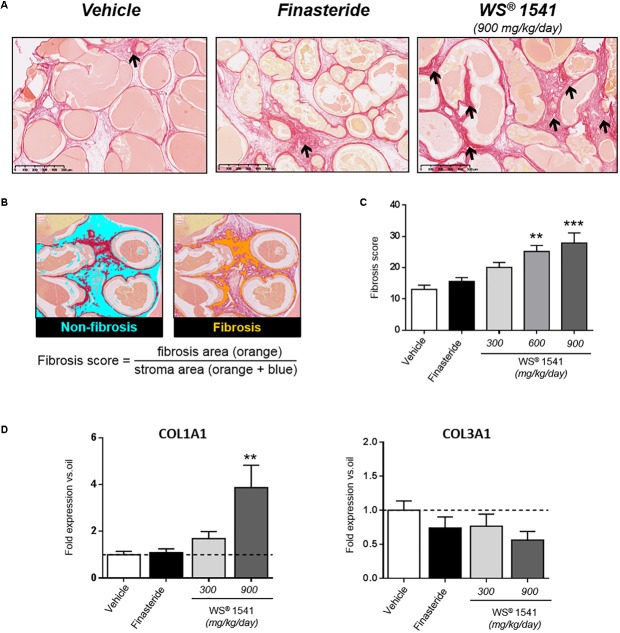
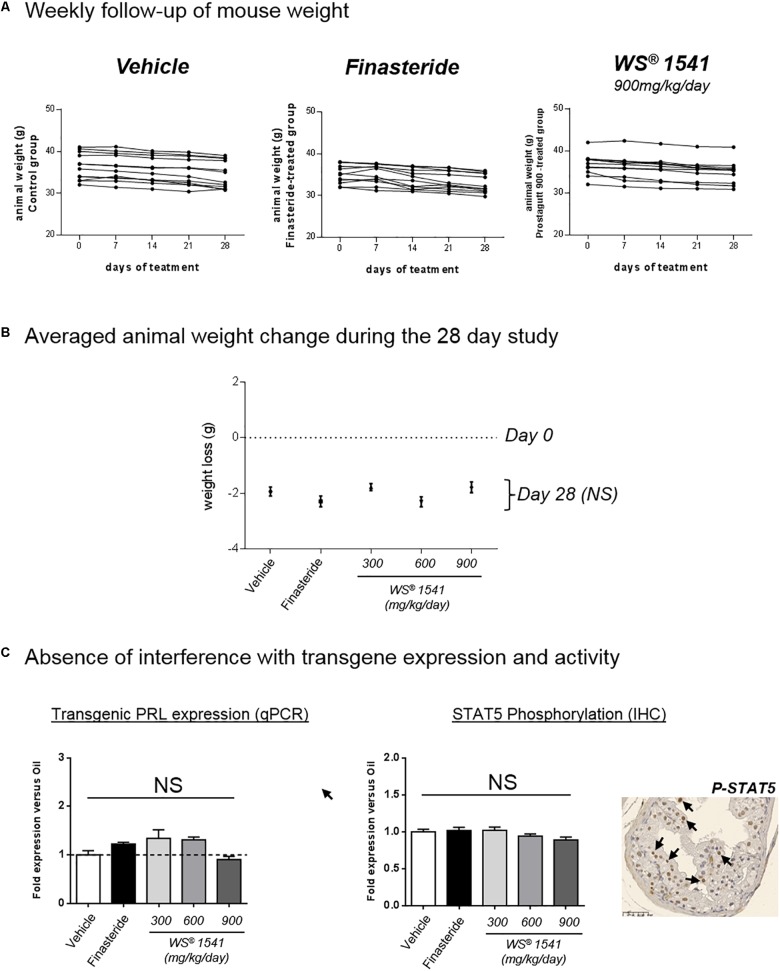
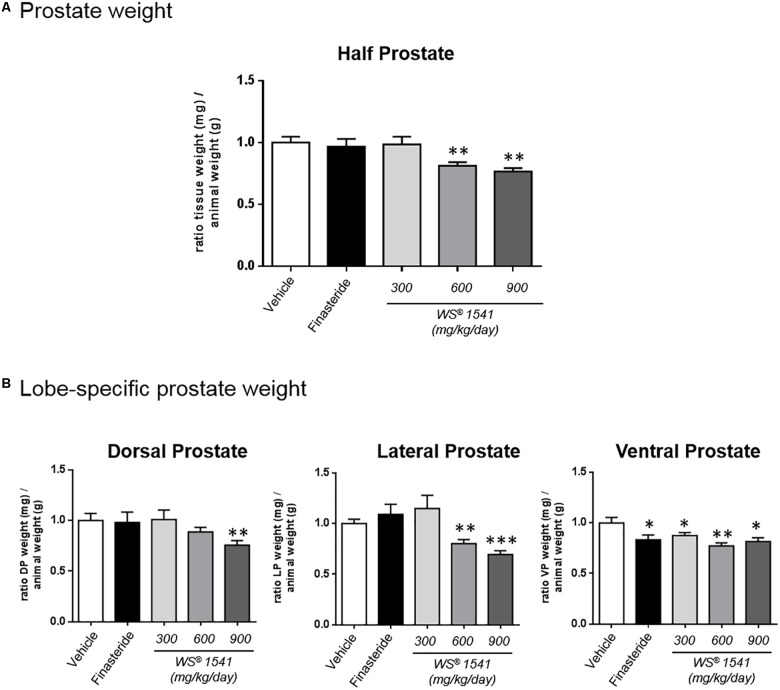
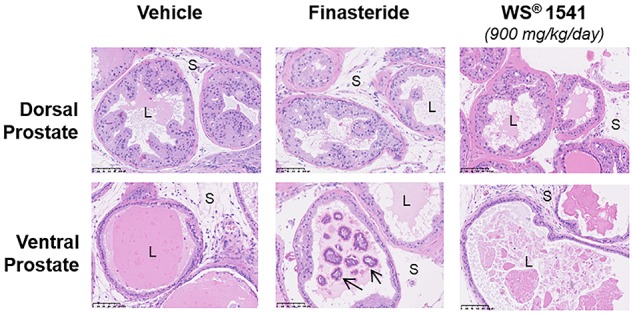
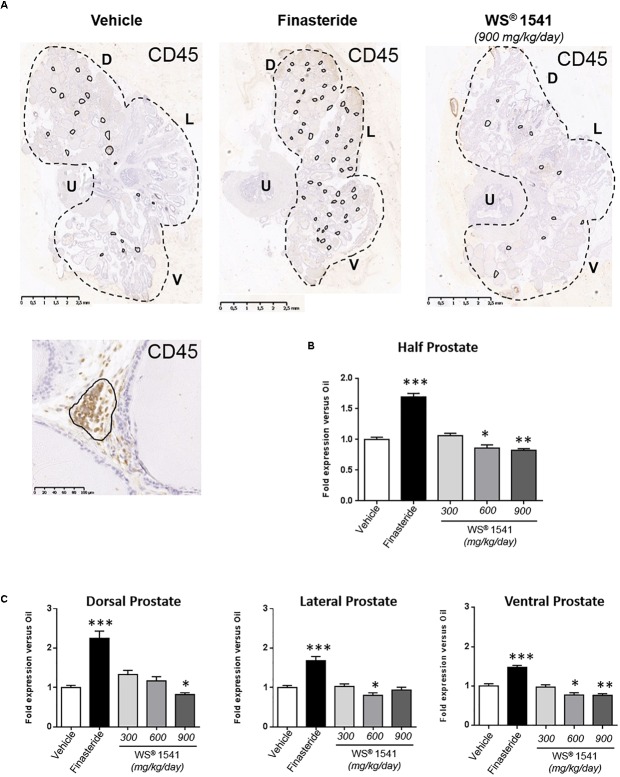
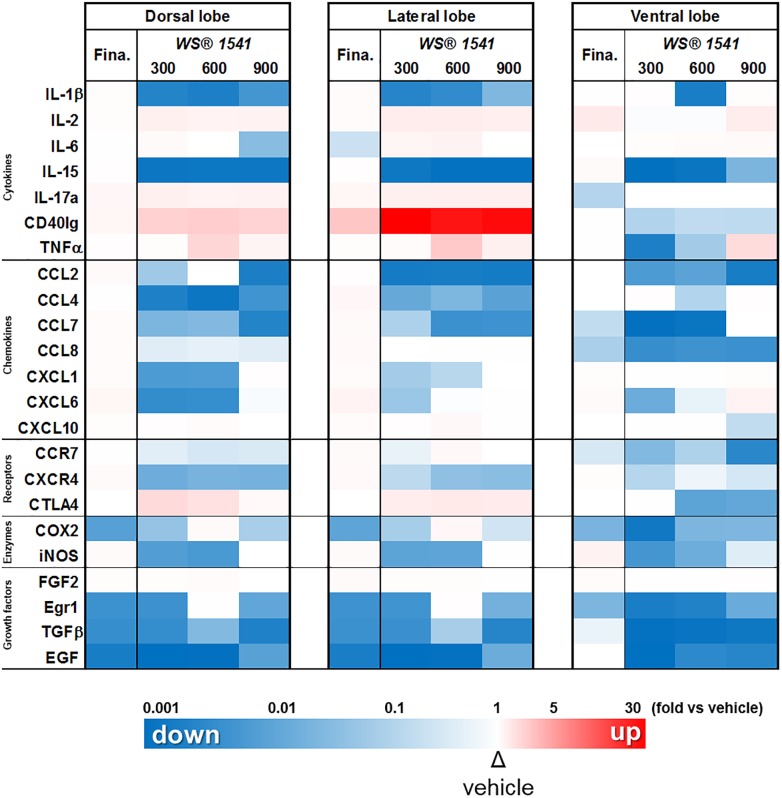
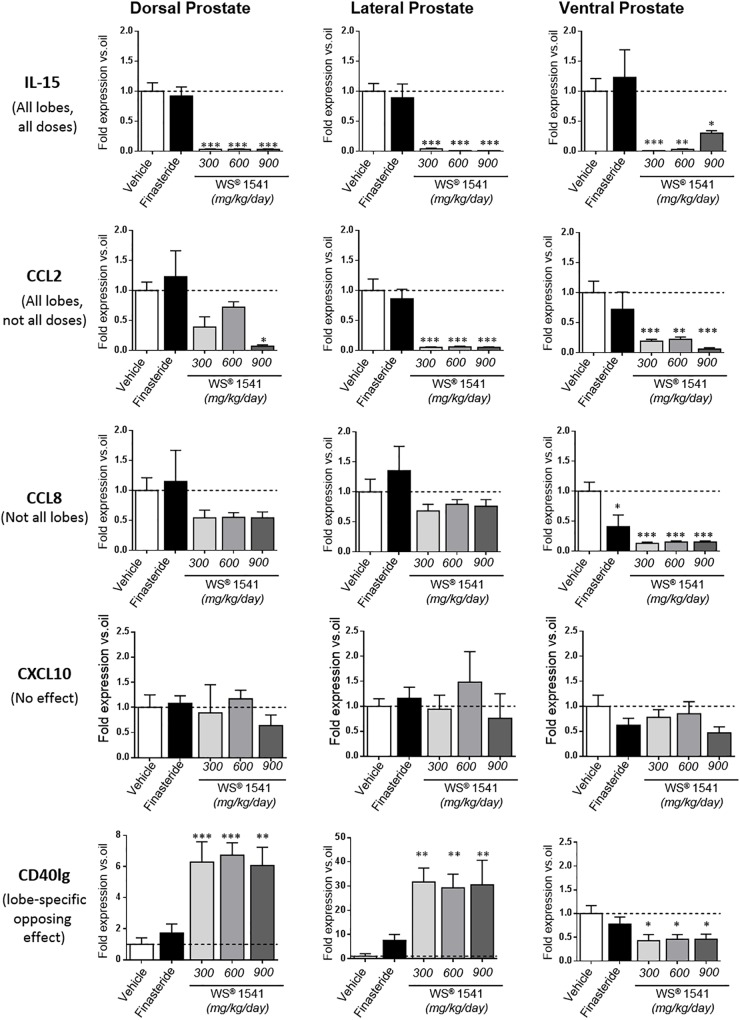
WS® 1541 is a phytopharmaceutical drug combination containing a lipophilic extract from fruits of Sabal serrulata (WS® 1473) and an aqueous ethanolic extract from roots of Urtica dioica (WS® 1031). It is approved in several countries worldwide for the treatment of lower urinary tract syndrome (LUTS) linked to benign prostate hyperplasia (BPH). Clinical studies have demonstrated the efficacy of this unique combination in the treatment of BPH-related LUTS. However, its mechanisms of action in vivo remain partly uncharacterized. The aim of this study was to take advantage of a validated mouse model of BPH to better characterize its growth-inhibitory and anti-inflammatory properties. We used the probasin-prolactin (Pb-PRL) transgenic mouse model in which prostate-specific overexpression of PRL results in several features of the human disease including tissue hypertrophy, epithelial hyperplasia, increased stromal cellularity, inflammation, and LUTS. Six-month-old heterozygous Pb-PRL male mice were randomly distributed to five groups (11-12 animals/group) orally treated for 28 consecutive days with WS® 1541 (300, 600, or 900 mg/kg/day), the 5α-reductase inhibitor finasteride used as reference (5 mg/kg/day) or vehicle (olive oil 5 ml/kg/day). Administration of WS® 1541 was well tolerated and caused a dose-dependent reduction of prostate weight (vs. vehicle) that was statistically significant at the two highest doses. This effect was accompanied by a reduction in prostate cell proliferation as assessed by lower Ki-67 expression (qPCR and immunohistochemistry). In contrast, finasteride had no or only a mild effect on these parameters. The growth-inhibitory activity of WS® 1541 was accompanied by a strong anti-inflammatory effect as evidenced by the reduced infiltration of cells expressing the leukocyte common antigen CD45. In sharp contrast, finasteride significantly increased the prostate inflammatory status according to this readout. Molecular profiling (qPCR) of 23 selected pro-inflammatory genes confirmed the strong anti-inflammatory potency of WS® 1541 compared to finasteride. Since treatment of WS® 1541 did not interfere with transgene expression and activity in the prostate of Pb-PRL mice, the effects observed in this study are entirely attributable to the intrinsic pharmacological action of the drug combination.
Keywords: BPH; COX-2; WS® 1541; chemokines; cytokines; iNOS; inflammation; lower urinary tract syndrome (LUTS).
Figures

Similar articles
-
Effects of a proprietary mixture of extracts from Sabal serrulata fruits and Urtica dioica roots (WS® 1541) on prostate hyperplasia and inflammation in rats and human cells.Front Pharmacol. 2024 Mar 15;15:1379456. doi: 10.3389/fphar.2024.1379456. eCollection 2024. Front Pharmacol. 2024. PMID: 38560358 Free PMC article.
-
Anti-inflammatory properties of Lipidosterolic extract of Serenoa repens (Permixon®) in a mouse model of prostate hyperplasia.Prostate. 2015 May;75(7):706-22. doi: 10.1002/pros.22953. Epub 2015 Feb 14. Prostate. 2015. PMID: 25683150
-
WS PRO 160 I 120 mg (a combination of sabal and urtica extract) in patients with LUTS related to BPH.Ther Adv Urol. 2019 Oct 11;11:1756287219879533. doi: 10.1177/1756287219879533. eCollection 2019 Jan-Dec. Ther Adv Urol. 2019. PMID: 31656534 Free PMC article. Review.
-
Rate of castration-induced prostate stroma regression is reduced in a mouse model of benign prostatic hyperplasia.Am J Clin Exp Urol. 2023 Feb 25;11(1):12-26. eCollection 2023. Am J Clin Exp Urol. 2023. PMID: 36923722 Free PMC article.
-
Nutraceutical treatment and prevention of benign prostatic hyperplasia and prostate cancer.Arch Ital Urol Androl. 2019 Oct 2;91(3). doi: 10.4081/aiua.2019.3.139. Arch Ital Urol Androl. 2019. PMID: 31577095 Review.
Cited by
-
Natural Products in the Treatment of Lower Urinary Tract Dysfunction and Infection.Handb Exp Pharmacol. 2025;287:295-323. doi: 10.1007/164_2024_708. Handb Exp Pharmacol. 2025. PMID: 38411727 Review.
-
Exploring the Enigma of 5-ARIs Resistance in Benign Prostatic Hyperplasia: Paving the Path for Personalized Medicine.Curr Urol Rep. 2023 Dec;24(12):579-589. doi: 10.1007/s11934-023-01188-z. Epub 2023 Nov 21. Curr Urol Rep. 2023. PMID: 37987980 Review.
-
Serenoa repens and Urtica dioica Fixed Combination: In-Vitro Validation of a Therapy for Benign Prostatic Hyperplasia (BPH).Int J Mol Sci. 2020 Dec 2;21(23):9178. doi: 10.3390/ijms21239178. Int J Mol Sci. 2020. PMID: 33276425 Free PMC article.
-
STAT5a/b Deficiency Delays, but does not Prevent, Prolactin-Driven Prostate Tumorigenesis in Mice.Cancers (Basel). 2019 Jul 2;11(7):929. doi: 10.3390/cancers11070929. Cancers (Basel). 2019. PMID: 31269779 Free PMC article.
-
Prostate luminal progenitor cells: from mouse to human, from health to disease.Nat Rev Urol. 2022 Apr;19(4):201-218. doi: 10.1038/s41585-021-00561-2. Epub 2022 Jan 25. Nat Rev Urol. 2022. PMID: 35079142 Review.
References
-
- Baltaci S., Orhan D., Gogus C., Turkolmez K., Tulunay O., Gogus O. (2001). Inducible nitric oxide synthase expression in benign prostatic hyperplasia, low- and high-grade prostatic intraepithelial neoplasia and prostatic carcinoma. BJU Int. 88 100–103. 10.1046/j.1464-410x.2001.02231.x - DOI - PubMed
-
- Bennett B. C., Hicklin J. R. (1998). Uses of saw palmetto (Serenoa repens, Arecaceae) in Florida. Econ. Bot. 52 381–393. 10.1007/BF02862068 - DOI
LinkOut - more resources
Full Text Sources
Research Materials
Miscellaneous