. 2019 Mar 26:10:591.
doi: 10.3389/fmicb.2019.00591. eCollection 2019.

Defining the Transcriptional and Post-transcriptional Landscapes of Mycobacterium smegmatis in Aerobic Growth and Hypoxia

Affiliations

Defining the Transcriptional and Post-transcriptional Landscapes of Mycobacterium smegmatis in Aerobic Growth and Hypoxia

M Carla Martini et al. Front Microbiol. .

Abstract

The ability of Mycobacterium tuberculosis to infect, proliferate, and survive during long periods in the human lungs largely depends on the rigorous control of gene expression. Transcriptome-wide analyses are key to understanding gene regulation on a global scale. Here, we combine 5'-end-directed libraries with RNAseq expression libraries to gain insight into the transcriptome organization and post-transcriptional mRNA cleavage landscape in mycobacteria during log phase growth and under hypoxia, a physiologically relevant stress condition. Using the model organism Mycobacterium smegmatis, we identified 6,090 transcription start sites (TSSs) with high confidence during log phase growth, of which 67% were categorized as primary TSSs for annotated genes, and the remaining were classified as internal, antisense, or orphan, according to their genomic context. Interestingly, over 25% of the RNA transcripts lack a leader sequence, and of the coding sequences that do have leaders, 53% lack a strong consensus Shine-Dalgarno site. This indicates that like M. tuberculosis, M. smegmatis can initiate translation through multiple mechanisms. Our approach also allowed us to identify over 3,000 RNA cleavage sites, which occur at a novel sequence motif. To our knowledge, this represents the first report of a transcriptome-wide RNA cleavage site map in mycobacteria. The cleavage sites show a positional bias toward mRNA regulatory regions, highlighting the importance of post-transcriptional regulation in gene expression. We show that in low oxygen, a condition associated with the host environment during infection, mycobacteria change their transcriptomic profiles and endonucleolytic RNA cleavage is markedly reduced, suggesting a mechanistic explanation for previous reports of increased mRNA half-lives in response to stress. In addition, a number of TSSs were triggered in hypoxia, 56 of which contain the binding motif for the sigma factor SigF in their promoter regions. This suggests that SigF makes direct contributions to transcriptomic remodeling in hypoxia-challenged mycobacteria. Taken together, our data provide a foundation for further study of both transcriptional and posttranscriptional regulation in mycobacteria.

Keywords: Mycobacterium smegmatis; RNA cleavage; RNA processing and decay; hypoxia; leaderless translation; transcription start sites (TSSs); transcriptome; tuberculosis.


Figures

Figure 1
Figure 1
Mapping and categorization of transcription start sites in M. smegmatis. (A) Diagram showing the ratios of coverage in the converted/non-converted libraries for each coordinate. Gaussian mixture modeling was used to discriminate between TSSs and CSs. For this analysis, the 15,720 coordinates from Dataset 1 were used. (B) Abundance of the ANNNT promoter motif located between bases –13 to –6 upstream of the 15,720 coordinates. The light blue dashed line indicates the percentage of coordinates in the genome of M. smegmatis that have at least one ANNNT motif located between bases –13 to –6 upstream (9.7%). (C) Base frequency at the +1 position among the 15,720 5′ ends from Dataset 1. (D) Categories for TSS annotation based on the genomic context. TSSs were classified according to their relative position to genes as primary (pTSSs, red), internal (iTSSs, green), antisense (aTSSs, light blue) and orphan (oTSSs, violet). (E) Distribution of TSSs among the different categories.
Figure 2
Figure 2
M. smegmatis promoter -10 regions are dominated by the ANNNT motif. (A) Identification of promoter motifs. Consensus motifs were identified by using MEME. The 20 nt upstream the 6,090 TSSs were used for the initial analysis. Those sequences lacking an ANNNT –10 motif between positions –13 and –6 (1,257) were used to identify other conserved promoter sequences. Motif 2 (20 nt length) and Motif 4 (18 nt length) are located immediately upstream of the TSS (at the –1 position), while the spacing of Motif 5 varies from –4 to –1 relative to the TSS, with –3 being the dominant position (75% of the motifs). (B) The sequences flanking 3,500 randomly chosen TSSs were used to create a sequence logo by WebLogo 3 (Crooks et al., 2004), revealing the two dominant spacings for the ANNNT motif and base preferences in the immediate vicinity of the TSS. (C) Comparison of apparent promoter activity for different motifs. Mean normalized read depth in the converted libraries from Dataset 1 was compared for TSSs having or lacking the ANNNT motif in the –10 region, and ANNNT-associated TSSs were further subdivided into those containing the extended TANNNT motif or conversely the VANNNT sequence (where V = A, G or C). Motifs 2, 4, and 5 in Figure 2A are also included. ∗∗∗∗p < 0.0001, ∗∗∗p < 0.001, ∗∗p < 0.01, p < 0.05 (Kruskal–Wallis test with post-test for multiple comparisons).
Figure 3
Figure 3
Leader features are conserved in mycobacteria. (A) Leader length distribution. The 4,054 pTSSs and the pTSSs of the 213 reannotated genes (N-iTSSs → pTSSs) were used. (B) Leader length correlation between M. smegmatis and Mtb genes. The leader sequences of genes having a single unique pTSS in both species (leader length ≥ 0 and ≤500 nt) were used. 508 homologous genes in Cortes et al. (2013) (left figure) and 251 homologous genes in Shell et al. (2015b) (right figure) were used. When a gene in M. smegmatis had more than one homolog in Mtb, that with the highest identity was considered. Spearman r p-value < 0.00001 in both cases. (C) Distribution of leaderless transcripts among different functional TIGRfam functional categories (Haft et al., 2001). 557 genes having TIGRfam categories were used for this analysis. Genes having both leadered and leaderless transcripts were excluded. The black dashed line indicates the expected proportion of leaderless genes (25%) according to the global analysis performed in this study. The numbers above each bar indicate the total number of genes used for this analysis in each category (leaderless + leadered). ∗∗∗∗p < 0.0001, ∗∗∗p < 0.001 (Chi-Square test with Bonferroni correction for multiple comparisons). (D) RNA levels vary according to leader status. Mean expression levels were compared for genes expressed with leaders containing a canonical SD sequence (SD) or not (No SD) or lacking leaders (leaderless). Gene expression was quantified by RNAseq. Genes were classified as containing an SD sequence if at least one of the three tetramers AGGA, GGAG, or GAGG (core sequence AGGAGG) were present in the region –6 to –17 nt relative to the start codon. rRNAs, tRNAs, sRNAs, and genes expressed as both leadered and leaderless transcripts were excluded. ∗∗∗∗p < 0.0001, ∗∗p < 0.005; ns: not significant. (Kruskal–Wallis test with post-test for multiple comparisons).
Figure 4
Figure 4
Cleavage site positions are biased with respect to sequence context and genetic location. (A) Sequence context of cleavage sites. The sequences flanking the 3,344 high-confidence CSs were used to create the sequence logo with WebLogo 3 (Crooks et al., 2004). (B) Base preference for RNA cleavage. The base frequencies for the –2 to +2 positions were determined. (C) Cleavage site categories based on the genetic context. CSs are denoted with arrows. 5′ UTR: the CS is within the leader of a gene, and the genes upstream and downstream of the CS are divergent (Gene 1 and Gene 2, red arrow). CDS: The CS is within a coding sequence (green arrow). 3′ UTR: the genes upstream and downstream of the CS are convergent (Gene 2 and Gene 3, light blue arrow). Operon: The CS is between two genes with the same orientation and the first gene in the operon has a pTSS according to Supplementary Table S6 (violet arrow). (D) Distribution of cleavage sites. The frequency of CSs in each location was normalized to the proportion of the genome that the location category comprised. The proportions were then normalized to the CDS category, which was set as 1. ∗∗∗∗p < 0001, p < 0.01 (Chi-square test).
Figure 5
Figure 5
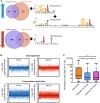
The transcriptional landscape substantially changes upon oxygen limitation. (A) TSSs significantly increased or decreased in hypoxia. 132 TSSs were overrepresented (upper panel) and 186 were underrepresented (lower panel) in different hypoxia stages. The upstream regions of these TSSs were used to search for promoter motifs using MEME. (B) The mean normalized read depths for each 5′ end in the non-converted libraries were compared between hypoxia and normoxia. Graphics show the Log2 of the ratios of read depth for each CSs at 15 h (upper left) and 24 h (upper right), and the Log2 of the ratios of the read depth for each TSSs at 15 h (lower left) and 24 h (lower right) compared to normoxia. (C) Normalized read depth at high-confidence cleavage sites under normoxia and the transition into hypoxia. ∗∗∗∗p < 0.0001, ∗∗∗p < 0.001; ns, not significant (non-parametric Wilcoxon matched-pairs signed rank test).

References

    1. Adams P. P., Flores Avile C., Popitsch N., Bilusic I., Schroeder R., Lybecker M., et al. (2017). In vivo expression technology and 5’ end mapping of the Borrelia burgdorferi transcriptome identify novel RNAs expressed during mammalian infection. Nucleic Acids Res. 45 775–792. 10.1093/nar/gkw1180 - DOI - PMC - PubMed
    1. Albrecht M., Sharma C. M., Reinhardt R., Vogel J., Rudel T. (2009). Deep sequencing-based discovery of the chlamydia trachomatis transcriptome. Nucleic Acids Res. 38 868–877. 10.1093/nar/gkp1032 - DOI - PMC - PubMed
    1. Andre G., Even S., Putzer H., Burguiere P., Croux C., Danchin A., et al. (2008). S-box and T-box riboswitches and antisense RNA control a sulfur metabolic operon of Clostridium acetobutylicum. Nucleic Acids Res. 36 5955–5969. 10.1093/nar/gkn601 - DOI - PMC - PubMed
    1. Arraiano C. M., Andrade J. M., Domingues S., Guinote I. B., Malecki M., Matos R. G., et al. (2010). The critical role of RNA processing and degradation in the control of gene expression. FEMS Microbiol. Rev. 34 883–923. 10.1111/j.1574-6976.2010.00242.x - DOI - PubMed
    1. Bagchi G., Das T. K., Tyagi J. S. (2002). Molecular analysis of the dormancy response in Mycobacterium smegmatis: expression analysis of genes encoding the DevR–DevS two-component system, Rv3134c and chaperone α-crystallin homologues. FEMS Microbiol. Lett. 211 231–237. - PubMed