. 2019 Mar 11:2019:3017678.
doi: 10.1155/2019/3017678. eCollection 2019.

Intramuscular Injection of Adenoassociated Virus Encoding Human Neurotrophic Factor 3 and Exercise Intervention Contribute to Reduce Spasms after Spinal Cord Injury

Affiliations

Intramuscular Injection of Adenoassociated Virus Encoding Human Neurotrophic Factor 3 and Exercise Intervention Contribute to Reduce Spasms after Spinal Cord Injury

Yu-Xin Chang et al. Neural Plast. .

Abstract

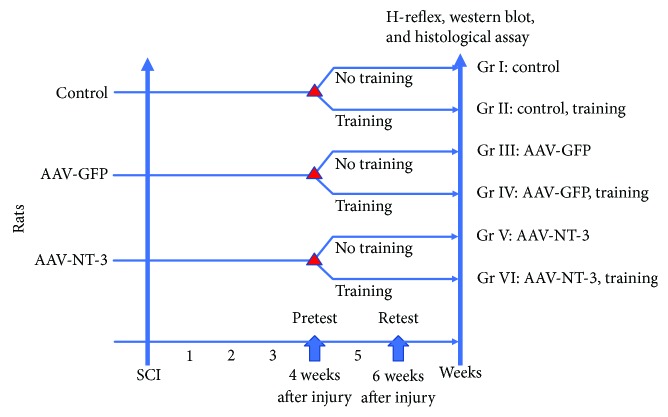
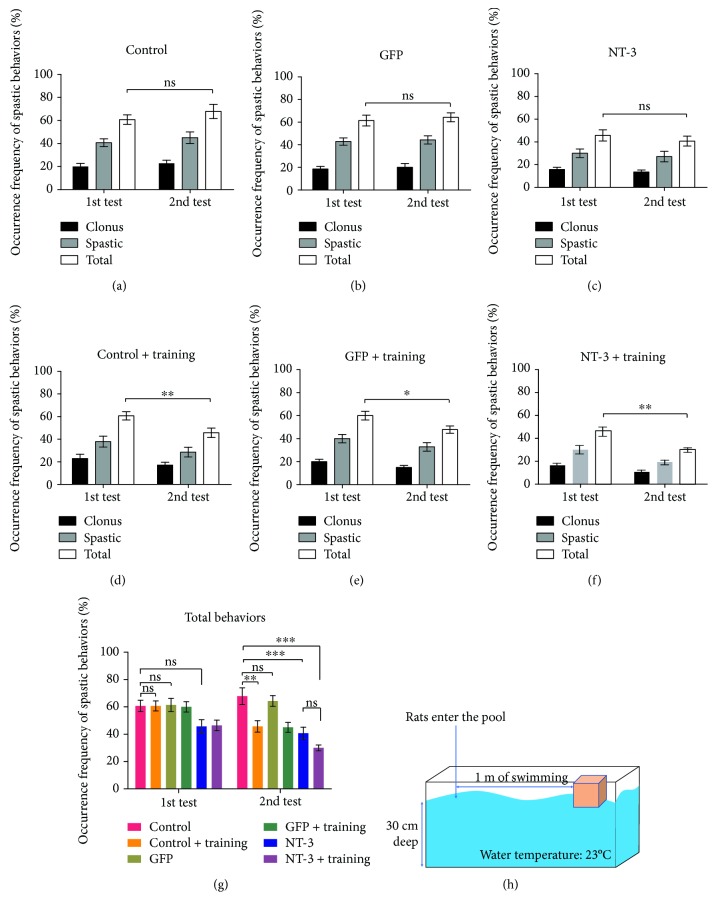
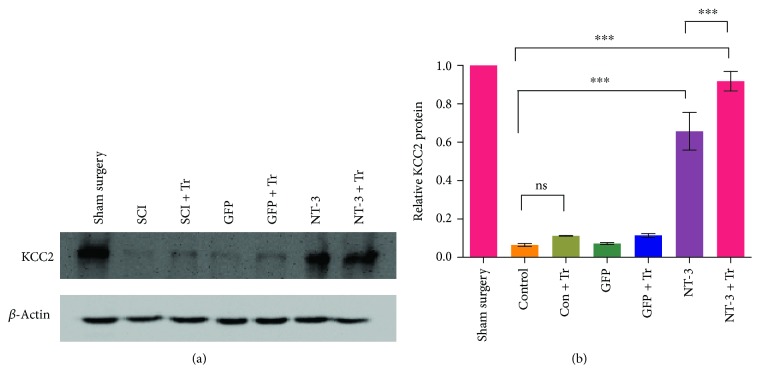
Limb spasms are phenomena of hyperreflexia that occur after spinal cord injury. Currently, the clinical treatment is less than ideal. Our goal is to develop a combination therapy based on individualized medicine to reduce spasticity after spinal cord injury. In this study, rats received a severe contusive injury at the T9 segment of the spinal cord, followed by gene therapy with adenoassociated virus encoding human neurotrophic factor 3 (AAV-NT3) and a 2-week exercise program starting at 4 weeks after injury. We quantified the frequency of spasms during a swimming test at 4 and 6 weeks after injury and confirmed the results of the swimming test by measuring the H-reflex of the plantar muscle. We obtained weekly hind limb exercise scores to assess the effect of the interventions in hind limb motor function improvement. Then, we used immunofluorescence to observe the immunoreactivity of spinal motor neurons, synaptophysin, cholinergic interneurons, and GABAergic interneurons. We also measured the expression of KCC2 in the spinal cord by western blot. We found that AAV-NT3 gene therapy, exercise, and combination therapy all attenuated the frequency of spasms in the swimming test conducted at 6 weeks after spinal cord injury and increased rate-dependent depression of H-reflex. Combination therapy was significantly superior to AAV-NT3 alone in protecting motor neurons. Recovery of KCC2 expression was significantly greater in rats treated with combination therapy than in the exercise group. Combination therapy was also significantly superior to individual therapies in remodeling spinal cord neurons. Our study shows that the combination of AAV-NT3 gene therapy and exercise can alleviate muscle spasm after spinal cord injury by altering the excitability of spinal interneurons and motor neurons. However, combination therapy did not show a significant additive effect, which needs to be improved by adjusting the combined strategy.


Figures

Figure 1
Figure 1
Experimental scheme. Rats were randomized into three groups and received a 250-kilodyne contusive spinal cord injury. Three groups of animals were injected with normal saline, AAV-NT3, or AAV-GFP in the lower limb muscles after spinal cord injury. Three animals in each group were used to detect the expression of NT-3 in the injected lower limb muscle and dorsal root ganglion by western blot at 4 weeks after spinal cord injury. Then, all rats were subjected to a swim test at 4 weeks after spinal cord injury to evaluate the spasticity of the animals. Each group of animals was then divided into two groups: one with exercise and the other without. All rats were retested after 2 weeks for swimming. H-reflex and tissue fixation followed by western blot analysis were performed 1 day later.
Figure 2
Figure 2
Injection of AAV-NT3 into the gastrocnemius muscle significantly increased NT-3 in muscle and spinal dorsal root ganglia. (a) The schematic diagram shows the experimental setup. Rats received contusive spinal cord injury and injection of AAV-NT3 or AAV-GFP into hind limb muscles. The proprioceptive reflex of the Ia afferent nerve-mediated single synapse is also shown in the diagram. (b) At 4 weeks after spinal cord injury, the expression of NT-3 in the gastrocnemius and tibialis anterior muscles of hind limbs was detected with western blot. (c) Quantitative analysis of the data in (b) showed that the expression of NT-3 in the muscles of the AAV-NT3 group was significantly higher than in the other two groups. (d) At 4 weeks after spinal cord injury, the expression of NT-3 in the spinal cord L4 to S2 DRG was detected by western blot. (e) Quantitative analysis of the data in (d) showed that the expression of NT-3 in the spinal cord DRG of the AAV-NT3 group was significantly higher than in the other two groups. Data are expressed as the mean ± SD. One-way ANOVA was used to compare AAV-NT3 with AAV-GFP or the control group. ∗∗∗p < 0.05.
Figure 3
Figure 3
AAV-NT3 and exercise alleviate the spastic behavior in the swimming test. (a–f) The bar graph shows the average frequency of spastic behavior in swimming tests after spinal cord injury in each group, including clone and spastic phases. The first and second tests were performed at weeks 4 and 6 after spinal cord injury, respectively. (g) The bar graph shows the average frequency of total spastic behavior for each experimental group in two tests. (h) Schematic diagram of the swimming test. Data are expressed as the mean ± S.E.M. Unpaired t-test or one-way ANOVA was used, and each experimental group was compared with the control group. p < 0.05, ∗∗p < 0.01, and ∗∗∗p < 0.001. ns: nonsignificant.
Figure 4
Figure 4
AAV-NT3 and combination therapy significantly improved hind limb motor function. The line graph shows the BBB score for each group within 6 weeks after spinal cord injury. Data are expressed as the mean ± S.E.M. One-way ANOVA was used, and each experimental group was compared with the control group. ns: nonsignificant.
Figure 5
Figure 5
The RDD of H-reflex increased with AAV-NT3 and exercise, either alone or in combination. (a) Sham surgery-treated rats (red line) showed a significant decrease in H-wave as the stimulation frequency increased from 0.2 Hz (upper) to 5 Hz (bottom), and this decrease was suppressed in the control group. The M-wave did not change in either group. (b) The graph shows the RDD of the H-wave of each group of animals. Data are expressed as the mean ± S.E.M. One-way ANOVA was used, and each experimental group was compared with the control group. p < 0.05, ∗∗p < 0.01. ns: nonsignificant.
Figure 6
Figure 6
The number of ventral horn motor neurons increased, and the average size increased in the combined treatment group, but there was no significant difference in SYP. (a) Schematic diagram of the spinal cord layer, with the white rectangular box indicating the position of the anterior horn Rexed's lamina IX. (b) Immunofluorescence staining of cholinergic motor neurons ChAT (red) and SYP (green) at low magnification. (c) Expression of ChAT (red) and SYP (green) in ventral horn motor neurons in each group. Scale bar: 20 μm. (d) Bar graph showing changes in the number of motor neurons. (e) Bar graph showing changes in the size of motor neurons. (f) Bar graph showing the average number of SYP puncta in each spinal motor neuron. Data are expressed as the mean ± S.E.M. One-way ANOVA was used, and each experimental group was compared with the control group. p < 0.05, ∗∗p < 0.01. ns: nonsignificant.
Figure 7
Figure 7
Compared with the sham surgery-treated group, the size of cholinergic interneurons in the central spinal cord gray matter (Rexed's lamina VII) was smaller but the number did not change in each experimental group. (a) Schematic diagram of the spinal layer, with the white rectangular box indicating the position of the VII layer. Representative immunofluorescence staining of cholinergic interneuron ChAT (red) in each group. Scale bar: 20 μm. (b) Bar graph showing changes in the number of cholinergic interneurons in each group. Number of cells counted per field (123 μm × 89 μm). (c) Bar graph showing changes in the size of cholinergic interneurons in each group. Data are expressed as the mean ± S.E.M. One-way ANOVA was used, and each experimental group was compared with the control group. p < 0.05, ∗∗p < 0.01. ns: nonsignificant.
Figure 8
Figure 8
Compared with the sham surgery-treated group, the number of GABAergic interneurons in the central spinal cord gray matter (Rexed's lamina VII) was significantly increased but the size did not change. (a) Schematic diagram of the spinal layer, with the white rectangular box indicating the position of the VII layer. Representative immunofluorescence staining of GAD65-positive GABAergic interneurons (green) in each group. Scale bar: 50 μm. (b) Bar graph showing changes in the number of GABAergic interneurons in each group. Number of cells counted per field (307 μm × 307 μm). (c) Bar graph showing changes in the size of GABA interneurons in each group. Data are expressed as the mean ± S.E.M. One-way ANOVA was used, and each experimental group was compared with the control group. ∗∗∗p < 0.001. ns: nonsignificant.
Figure 9
Figure 9
AAV-NT3, exercise, or combination therapy increased the expression of KCC2 in the spinal cord after spinal cord injury. (a) After 6 weeks of spinal cord injury, the expression of KCC2 in the spinal cord L4 to S2 was detected by western blot. (b) Quantitative analysis of the data in (a). Data are expressed as the mean ± S.E.M. One-way ANOVA was used, and each experimental group was compared with the control group. ∗∗∗p < 0.001. ns: nonsignificant.

References

    1. Adams M. M., Hicks A. L. Spasticity after spinal cord injury. Spinal Cord. 2005;43(10):577–586. doi: 10.1038/sj.sc.3101757. - DOI - PubMed
    1. Gonzenbach R. R., Gasser P., Zörner B., Hochreutener E., Dietz V., Schwab M. E. Nogo-A antibodies and training reduce muscle spasms in spinal cord-injured rats. Annals of Neurology. 2010;68(1):48–57. doi: 10.1002/ana.22009. - DOI - PubMed
    1. Corleto J. A., Bravo-Hernández M., Kamizato K., et al. Thoracic 9 spinal transection-induced model of muscle spasticity in the rat: a systematic electrophysiological and histopathological characterization. PLoS One. 2015;10(12, article e0144642) doi: 10.1371/journal.pone.0144642. - DOI - PMC - PubMed
    1. Thibaut A., Chatelle C., Ziegler E., Bruno M. A., Laureys S., Gosseries O. Spasticity after stroke: physiology, assessment and treatment. Brain Injury. 2013;27(10):1093–1105. doi: 10.3109/02699052.2013.804202. - DOI - PubMed
    1. Dietz V., Sinkjaer T. Spastic movement disorder: impaired reflex function and altered muscle mechanics. The Lancet Neurology. 2007;6(8):725–733. doi: 10.1016/S1474-4422(07)70193-X. - DOI - PubMed

Publication types

MeSH terms