. 2019 Mar 7:2019:2617030.
doi: 10.1155/2019/2617030. eCollection 2019.

The Genetic Landscape of Human Glioblastoma and Matched Primary Cancer Stem Cells Reveals Intratumour Similarity and Intertumour Heterogeneity

Affiliations

The Genetic Landscape of Human Glioblastoma and Matched Primary Cancer Stem Cells Reveals Intratumour Similarity and Intertumour Heterogeneity

Chiara Pesenti et al. Stem Cells Int. .

Abstract

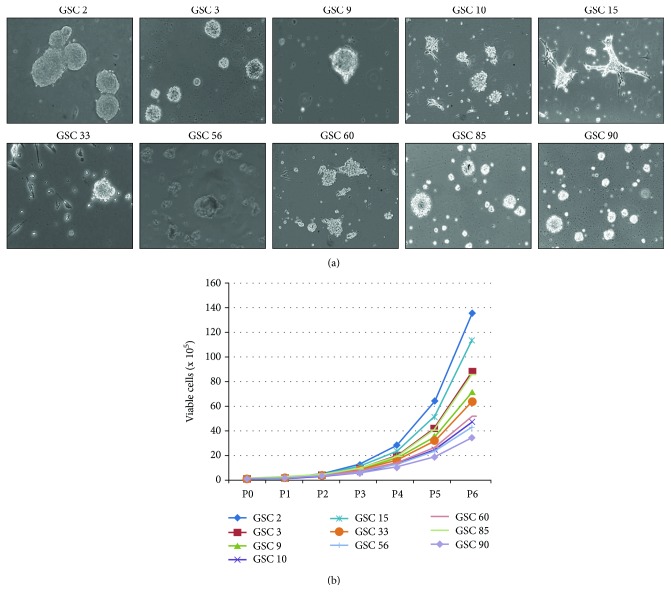
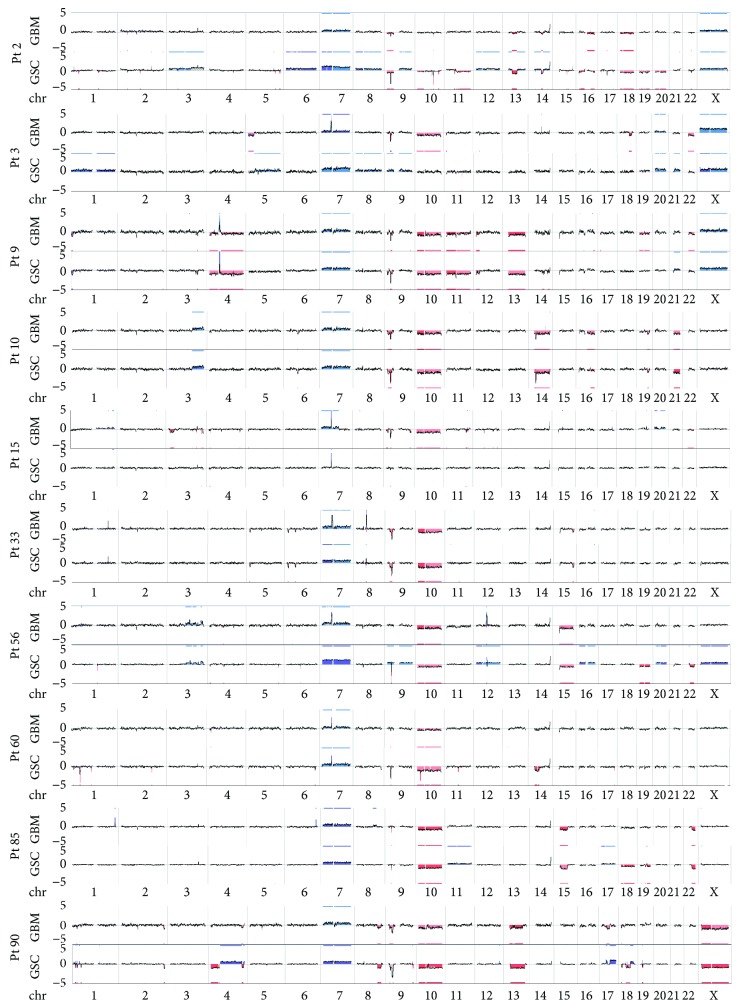
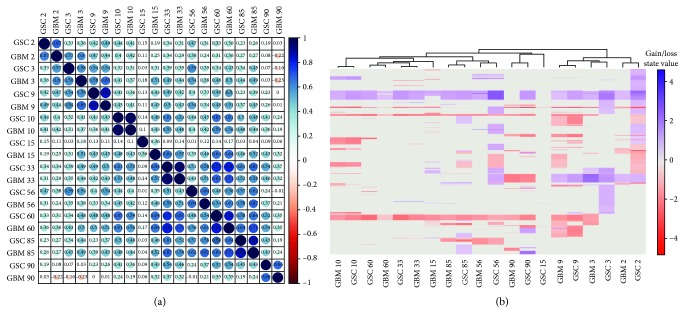
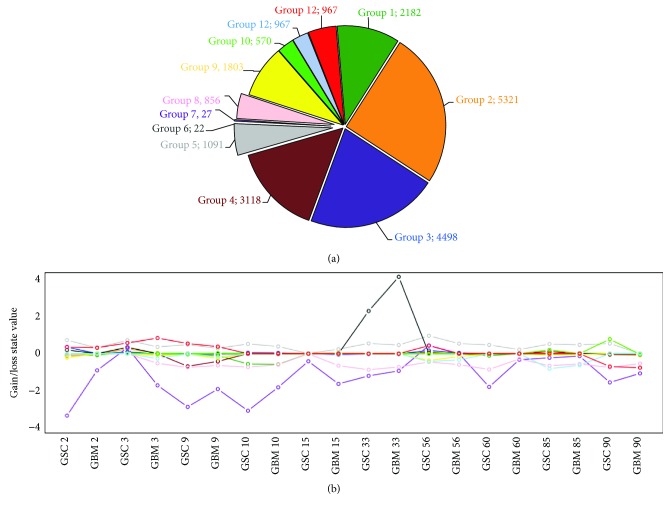
Glioblastoma (GBM) is the most malignant human brain tumour, characterized by rapid progression, invasion, intense angiogenesis, high genomic instability, and resistance to therapies. Despite countless experimental researches for new therapeutic strategies and promising clinical trials, the prognosis remains extremely poor, with a mean survival of less than 14 months. GBM aggressive behaviour is due to a subpopulation of tumourigenic stem-like cells, GBM stem cells (GSCs), which hierarchically drive onset, proliferation, and tumour recurrence. The morbidity and mortality of this disease strongly encourage exploring genetic characteristics of GSCs. Here, using array-CGH platform, we investigated genetic and genomic aberration profiles of GBM parent tumour (n = 10) and their primarily derived GSCs. Statistical analysis was performed by using R software and complex heatmap and corrplot packages. Pearson correlation and K-means algorithm were exploited to compare genetic alterations and to group similar genetic profiles in matched pairs of GBM and derived GSCs. We identified, in both GBM and matched GSCs, recurrent copy number alterations, as chromosome 7 polysomy, chromosome 10 monosomy, and chromosome 9p21deletions, which are typical features of primary GBM, essential for gliomagenesis. These observations suggest a condition of strong genomic instability both in GBM as GSCs. Our findings showed the robust similarity between GBM mass and GSCs (Pearson corr.≥0.65) but also highlighted a marked variability among different patients. Indeed, the heatmap reporting Gain/Loss State for 21022 coding/noncoding genes demonstrated high interpatient divergence. Furthermore, K-means algorithm identified an impairment of pathways related to the development and progression of cancer, such as angiogenesis, as well as pathways related to the immune system regulation, such as T cell activation. Our data confirmed the preservation of the genomic landscape from tumour tissue to GSCs, supporting the relevance of this cellular model to test in vitro new target therapies for GBM.


Figures

Figure 1
Figure 1
GSC isolation and propagation. (a) Representative images of GSCs of each patient, captured at passage 5. Magnification 10x with an inverted phase-contrast microscope. (b) Proliferation curves of GSCs. Each passage was done every 5 days.
Figure 2
Figure 2
Genome view of GBM and GSCs of each patient displaying high intrapatient similarity and interpatient discordance. Gains or losses of chromosomal regions are computed by comparing signal intensity in GBM and GSCs with the background signal of the reference and then applying a segmenting and smoothing algorithm. Line plots show chromosomal changes seen in GBMs; the y-axis indicates the log2 value ranging from -5 to 5; blue indicates gain/amplifications, red losses/deletions.
Figure 3
Figure 3
Hierarchical clustering results in our cohort of 10 patients highlighted the intrapatient similarity. (a) Correlation map reporting Pearson correlation values for each comparison. The bar on the left of the map indicates the color legend of the Pearson corr. values calculated for each couple of samples in the matrix. (b) Heatmap reporting Gain/Loss State for 21022 coding/noncoding genes (y-axis) in all samples (x-axis). Red and blue colors represent, respectively, losses and gains.
Figure 4
Figure 4
K-means results to cluster similar genetic CNA profiles in our GBM and GSC samples in 12 groups. (a) Pie chart reporting the number of genes gathered in each cluster according to K-means algorithm. (b) Centroid profiles for each cluster. Each line depicts the intracluster CNA mean values among samples (x-axis). Grey line represents the cluster 5 profile, containing genes amplified in all patients except GBM 90. Purple and pink lines are referred to clusters 7 and 8, containing genes deleted in all samples except for GSC 3 and GSC 56.

References

    1. Wipfler K., Cornish A. S., Guda C. Comparative molecular characterization of typical and exceptional responders in glioblastoma. Oncotarget. 2018;9(47):28421–28433. doi: 10.18632/oncotarget.25420. - DOI - PMC - PubMed
    1. Abou-Antoun T. J., Hale J. S., Lathia J. D., Dombrowski S. M. Brain cancer stem cells in adults and children: cell biology and therapeutic implications. Neurotherapeutics. 2017;14(2):372–384. doi: 10.1007/s13311-017-0524-0. - DOI - PMC - PubMed
    1. Sottoriva A., Spiteri I., Piccirillo S. G. M., et al. Intratumor heterogeneity in human glioblastoma reflects cancer evolutionary dynamics. Proceedings of the National Academy of Sciences of the United States of America. 2013;110(10):4009–4014. doi: 10.1073/pnas.1219747110. - DOI - PMC - PubMed
    1. The Cancer Genome Atlas Research Network. Comprehensive genomic characterization defines human glioblastoma genes and core pathways. Nature. 2008;455:1061–1068. doi: 10.1038/nature07385. - DOI - PMC - PubMed
    1. Wick W., Dettmer S., Berberich A., et al. N2M2 (NOA-20) phase I/II trial of molecularly matched targeted therapies plus radiotherapy in patients with newly diagnosed non-MGMT hypermethylated glioblastoma. Neuro-Oncology. 2018;21(1):95–105. doi: 10.1093/neuonc/noy161. - DOI - PMC - PubMed