. 2019 Mar 28:6:31.
doi: 10.3389/fnut.2019.00031. eCollection 2019.

Milk Oligosaccharides From Different Cattle Breeds Influence Growth-Related Characteristics of Intestinal Cells

Affiliations

Milk Oligosaccharides From Different Cattle Breeds Influence Growth-Related Characteristics of Intestinal Cells

Sabine Kuntz et al. Front Nutr. .

Abstract

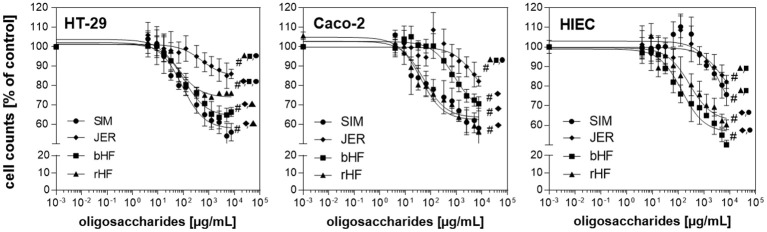
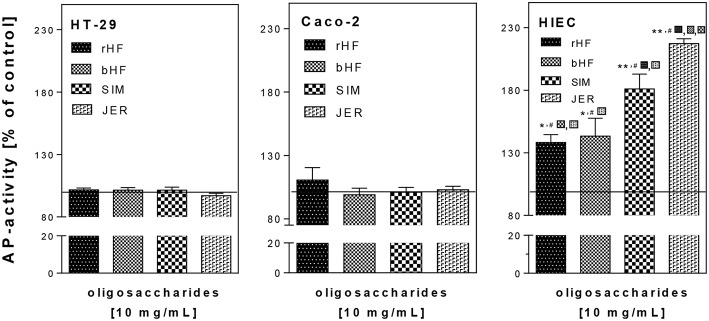
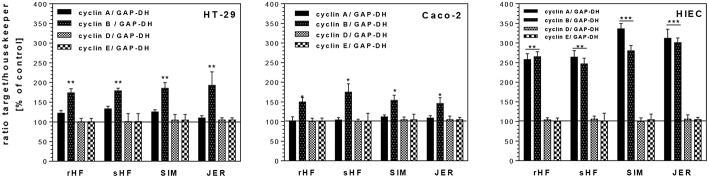
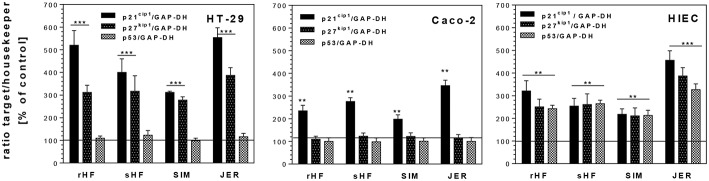
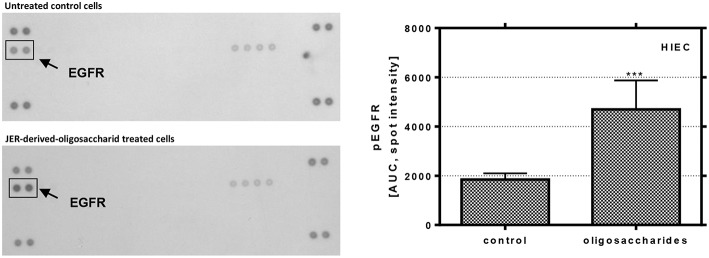
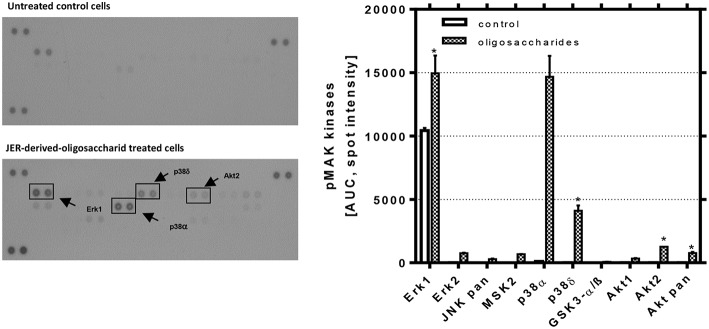
Oligosaccharides are present in human milk (HMO) in large amounts and in a high variety: Among other functions they are considered to influence the gut microbiota and gut maturation in infants. Due to the large volume of milk available bovine milk oligosaccharides (BMO) may be an alternative source of functional ingredients to potentially mimic HMO functions. Thus, we investigated direct effects of bovine milk oligosaccharides (BMO) from different cattle breeds on proliferation, differentiation and apoptosis in transformed (HT-29 and Caco-2) and non-transformed human intestinal cells (HIE cells). We observed a profound growth-inhibition effect induced by all BMO isolates in HT-29, Caco-2, and HIE cells in a dose-dependent manner. The effects varied not only between cell lines, i.e., HT-29 and Caco-2 cells were more sensitive than HIE cells, but also between the cattle breeds. Regarding the induction of differentiation, BMO induced differentiation only in HIE cells without affecting apoptosis. Cell cycle analysis via flow cytometry showed that growth inhibition was associated with a G2/M arrest in all cell lines. Expression levels detected by quantitative real-time RT-PCR revealed that this G2/M arrest was associated with changes in mRNA expression levels of cyclin A and B. Cyclin-dependent kinase inhibitors p21 cip1 and p27 kip1 and the tumor suppressor p53 were only enhanced in HIE cells necessary for arresting cells in the G2/M phase and induction of differentiation. In HT-29 and Caco-2 cells, a loss of p53 expression failed to induce G2/M associated induction of differentiation. The HIE cell specific differentiation induced by BMO was a result of influencing the phosphorylation states of EGFR (epidermal growth factor receptor) and MAP kinase, i.e., ERK1/2 (extracellular signal-regulated kinase 1/2), p38-α, and Akt2 phosphorylation. These results suggest that BMO inhibited intestinal cell proliferation and altered cell cycle dynamics by affecting corresponding regulator genes and mitogen-activated protein kinase signaling. As the development and maturation of digestive and absorptive processes depends on gut differentiation processes, our in vitro experiments show that breed-specific BMO are natural substances influencing various parameter which may be important in vivo in gastrointestinal development. This, however, needs to be proven in future studies.

Keywords: BMO; EGFR-ERK signaling; bovine milk oligosaccharides; cell cycle dynamics; differentiation; interbreed variation.


Figures

Figure 1
Figure 1
Effect of BMO on the proliferation of intestinal epithelial cells. Dose dependent inhibition effects of BMO from SIM (•), JER (♦), bHF (■), and rHF (▴) on the proliferation of HT-29, Caco-2, and HIE cells. HT-29, Caco-2 (1,500 per well) and HIE (2,500 per well) cells were incubated for 24 h. The cells were then left untreated or treated with BMO at concentrations of 0–10 mg/mL for 72 h. Results were expressed as % of controls (untreated); each value represents the mean with standard deviation (n = 3). # indicates significant interbreed variation at 10 mg/mL.
Figure 2
Figure 2
Effect of BMO on the differentiation of intestinal epithelial cells. After incubation with 10 mg/mL BMO, differentiation was determined by measuring alkaline phosphatase (AP) activity after 72 h. Results were expressed as % of control (untreated, solid line); each value represents the mean with their standard error (n = 3). Significant differences compared to the untreated control are indicated with *P < 0.05 and **P < 0.01; # indicates significant interbreed variation at 10 mg/mL.
Figure 3
Figure 3
Changes of mRNA expression levels of cell cycle genes (cyclin A, B, D, E) in intestinal HT-29, Caco-2 and HIE cells using GAPDH as housekeeper gene. Cells were treated with 10 mg/mL BMO from rHF, bHF, SIM and JER after reaching a confluency of 30 % over 72 h. Then, mRNA expression levels were determined using the target gene/housekeeping gene ratio by setting the control to 100%. Values are means of the percentage of controls with their standard error (n = 3). Mean values were significantly different from those of the control group: *P ≤ 0.05, **P ≤ 0.01, ***P<0.001.
Figure 4
Figure 4
Changes of mRNA expression levels of cell cycle genes p21cip1, p27kip1, and p53 in intestinal HT-29, Caco-2 and HIE cells using GAPDH as housekeeper gene. Cells were treated with 10 mg/mL BMO from rHF, bHF, SIM, and JER after reaching a confluence of 30% over 72 h. Values are means of the percentage of controls with their standard errors (n = 3). Mean values were significantly different from those of the control group: *P ≤ 0.05, **P ≤ 0.01, and ***P ≤ 0.001.
Figure 5
Figure 5
Phosphorylation of EGFR in HIE cells. Cells were treated with 10 mg/mL JER-derived-oligosaccharides for 10 min. Lysate was prepared according to the manufacturer's instructions. Phospho-receptor tyrosine kinase array was used to detect phosphorylation of these receptor tyrosine kinases in HIE cells. The signal was detected by chemiluminescence and the spot intensity is shown. Values are means of the percentage of controls with their standard errors (n = 2). Mean values were significantly different from those of the control group (***P ≤ 0.001) [AUC, area under the curve; EGFR, epidermal growth factor receptor].
Figure 6
Figure 6
Detection of phosphorylated mitogen-activated protein kinases in HIE cells. HIE cells were treated with JER-derived-oligosaccharides for 30 min. After incubation, 300 μg cell lysate were used for each assay. Array signals from scanned X-ray film images (left: representative blot) were analyzed using image analysis software and expressed as spot pixel density. Values are means with their standard errors (n = 2). Mean values were significantly different: *P ≤ 0.05 and ***P < 0.001 [AUC, area under the curve; pMAP, phosphorylated MAPK].
Figure 7
Figure 7
Chromatographic separation using HPAEC-PAD of BMO from four different cattle breeds. BMO from early bovine milk (colostrum) were isolated as described in the Method section. Identified peaks are 1: galactosyl-lactose; 2: N-acetylneuraminic acid; 3: 6′-N-acetylneuraminyl-lactose; 4: 3′-N-Acetylneuraminyl-lactose; 5: 6′-N-acetylneuraminyl-N-acetyllactosamin; 6: N-glycolyl-neuraminyl-lactose; 7: disialyl-lactose. bHF, German Holstein cattle (Black Pied); rHF, German Holstein cattle (Red Pied); SIM, German Simmental; JER, Jersey.

References

    1. Bode L, Contractor N, Barile D, Pohl N, Prudden AR, Boons G-J, et al. . Overcoming the limited availability of human milk oligosaccharides: challenges and opportunities for research and application. Nutr Rev. (2016) 74:635–44. 10.1093/nutrit/nuw025 - DOI - PMC - PubMed
    1. Sprenger GA, Baumgärtner F, Albermann C. Production of human milk oligosaccharides by enzymatic and whole-cell microbial biotransformations. J Biotechnol. (2017) 258:79–91. 10.1016/j.jbiotec.2017.07.030 - DOI - PubMed
    1. Bode L. Human milk oligosaccharides: every baby needs a sugar mama. Glycobiology. (2012) 22:1147–62. 10.1093/glycob/cws074 - DOI - PMC - PubMed
    1. Donovan SM, Wang M, Li M, Friedberg I, Schwartz SL, Chapkin RS. Host-microbe interactions in the neonatal intestine: role of human milk oligosaccharides. Adv Nutr. (2012) 3:450S−5S. 10.3945/an.112.001859 - DOI - PMC - PubMed
    1. Kunz C, Dekany G, Röhrig CH, Donovan SM. Introduction to the symposium. Adv Nutr. (2012) 3:379S−82S. 10.3945/an.112.002006 - DOI - PMC - PubMed