. 2019 Apr 2:11:291-300.
doi: 10.1016/j.dadm.2019.02.002. eCollection 2019 Dec.

Preanalytical sample handling recommendations for Alzheimer's disease plasma biomarkers

Affiliations

Preanalytical sample handling recommendations for Alzheimer's disease plasma biomarkers

Małgorzata Rózga et al. Alzheimers Dement (Amst). .

Abstract

Introduction: We examined the influence of common preanalytical factors on the measurement of Alzheimer's disease-specific biomarkers in human plasma.

Methods: Amyloid β peptides (Aβ[1-40], Aβ[1-42]) and total Tau plasma concentrations were quantified using fully automated Roche Elecsys assays.

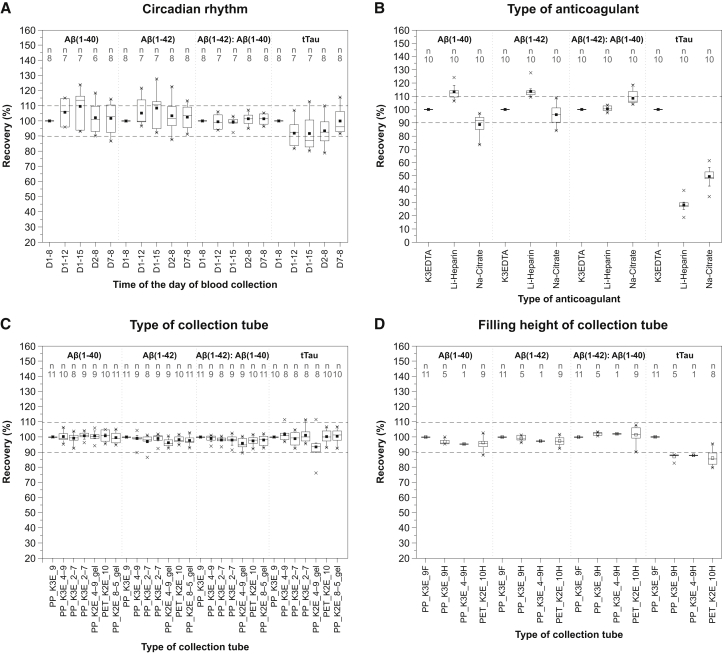
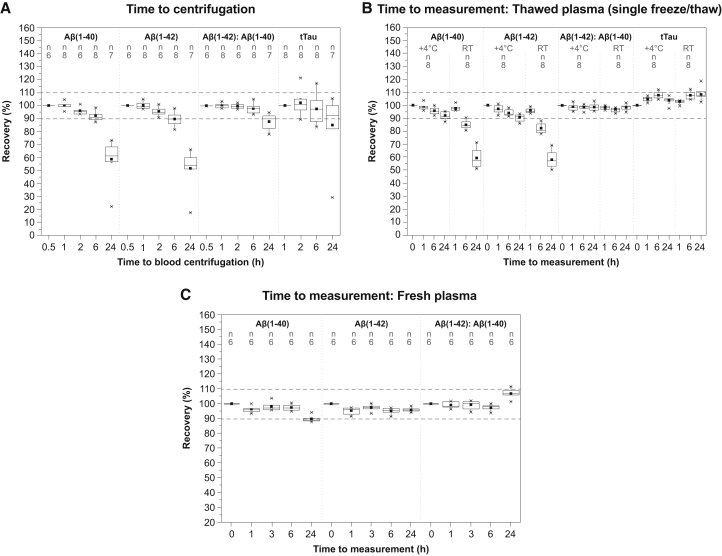
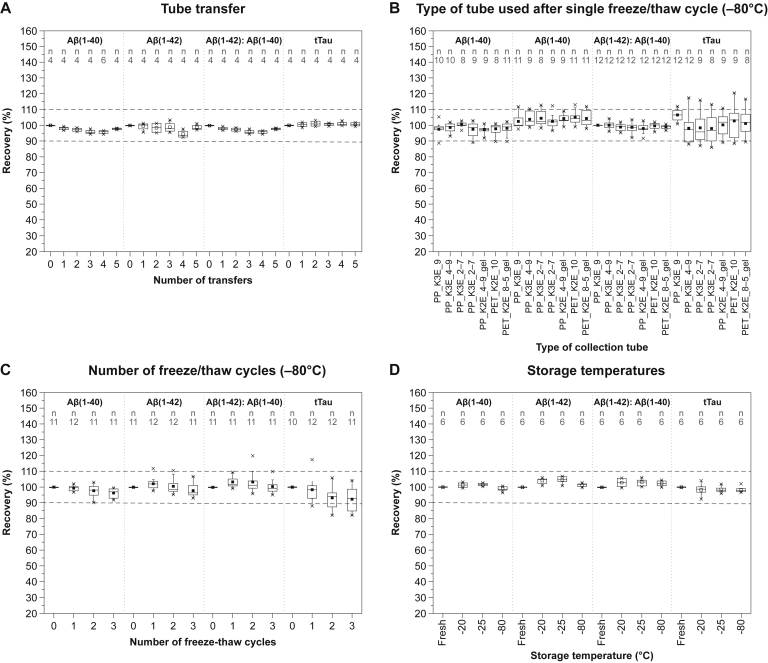
Results: Aβ(1-40), Aβ(1-42), and total Tau plasma concentrations were not affected by up to three freeze/thaw cycles, up to five tube transfers, the collection tube material, or the size; circadian rhythm had a minor effect. All three biomarkers were influenced by the anticoagulant used, particularly total Tau. Aβ concentrations began decreasing 1 hour after blood draw/before centrifugation and decreased by up to 5% and 10% at 2 and 6 hours, respectively. For separated plasma, time to measurement influenced Aβ levels by up to 7% after 6 hours and 10% after 24 hours.

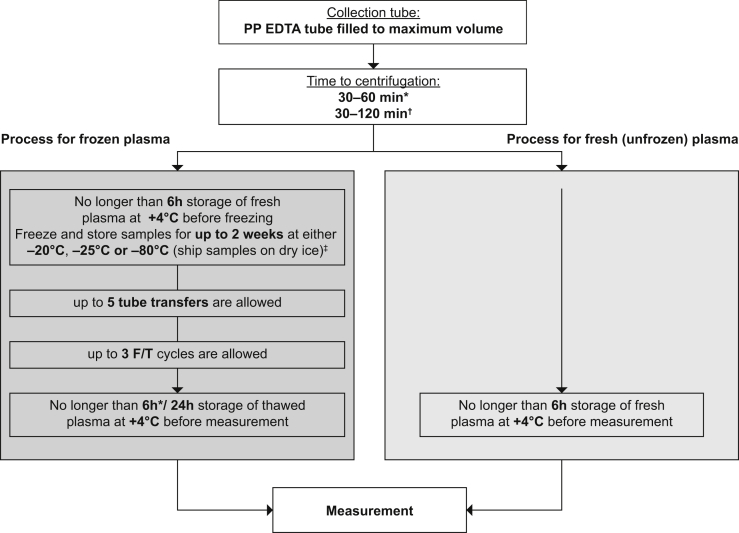
Discussion: Our findings provide guidance for standardizing blood sample collection, handling, and storage to ensure reliable analysis of Alzheimer's disease plasma biomarkers in routine practice and clinical trials.

Keywords: AD; Alzheimer's disease; Alzheimer's disease-specific biomarkers; Amyloid; Biomarkers; Elecsys immunoassay; Fully automated; Plasma; Preanalytics; Sample handling; Tau.


Figures

Fig. 1
Fig. 1
The effect of parameters related to blood sample collection on plasma levels of Aβ peptides and tTau. Circadian rhythm (A): plasma Aβ(1-40), Aβ(1-42), Aβ(1-42): Aβ(1-40) ratio, and tTau throughout the day (8:00 AM, 12:00 PM, and 3:00 PM) and across 1, 2, and 7 days (8:00 AM). Values for each time point are normalized to the baseline 8:00 AM values on day 1. D1–8 = day 1 at 8:00 AM; D1–12 = day 1 at 12:00 PM; D1–15 = day 1 at 3:00 PM; D2–8 = day 2 at 8:00 AM; D7–8 = day 7 at 8:00 AM. Type of anticoagulant (B): Aβ(1-40), Aβ(1-42), Aβ(1-42): Aβ(1-40) ratio, and tTau in K3-EDTA, Li-heparin, and Na-citrate plasma. Values for heparinized and citrated plasma were normalized to the values in K3-EDTA plasma. Type of collection tube (C): Aβ(1-40), Aβ(1-42), Aβ(1-42): Aβ(1-40) ratio, and tTau in plasma separated from blood collected into different primary collection tubes. Values for different tubes are normalized to the S-Monovette® K3-EDTA 9 mL tube. Filling height (D): Aβ(1-40), Aβ(1-42), Aβ(1-42): Aβ(1-40) ratio, and tTau in half-filled tubes. Values for different tubes are normalized to fully filled S-Monovette® K3-EDTA 9 mL tube. Horizontal lines and filled squares within each box represent the median and the mean of the sample, respectively. The bottom and the top of each box represent the first and the fourth quartiles. Error bars represent the standard deviation. Outliers are represented as small stars. Abbreviations: Aβ, amyloid β; gel, presence of gel separator in a tube; K2E, K2-EDTA; K3E, K3-EDTA; Li-heparin, lithium heparin; Na-citrate, sodium citrate; PET, polyethylene terephthalate; PP, polypropylene; tTau, total Tau, 9F, 9 mL tube filled 100%; 9H, 9 mL tube filled 50%; 4-9H, 4.9 mL tube filled 50%; 10H, 10 mL tube filled 50%. For tube type abbreviations, please see Supplementary Table 1.
Fig. 2
Fig. 2
The effect of time to centrifugation and storage conditions before analysis on plasma levels of Aβ peptides and tTau. Time to centrifugation (A): Aβ(1-40), Aβ(1-42), Aβ(1-42): Aβ(1-40) ratio, and tTau in plasma separated after 0.5 (Aβ peptides only), 1, 2, 6, and 24 hours at RT after blood collection. Values for each time point were normalized to the baseline 0.5 hour and 1 hour for Aβ(1-40), Aβ(1-42), Aβ(1-42): Aβ(1-40) ratio, and tTau, respectively. Time to measurement in plasma samples that were frozen and thawed once (B): Aβ(1-40), Aβ(1-42), Aβ(1-42): Aβ(1-40) ratio, and tTau stored at +4°C or at RT for 1, 6, and 24 hours after thawing. Values were normalized to baseline levels in freshly thawed plasma. Time to measurement–fresh plasma (C): Aβ(1-40), Aβ(1-42), and Aβ(1-42): Aβ(1-40) ratio in freshly separated plasma after storage for 1, 3, 6, and 24 hours at +4°C. Values were normalized to baseline (time = 0) in freshly separated plasma. Horizontal lines and filled squares within each box represent the median and the mean of the sample, respectively. The bottom and the top of each box represent the first and the fourth quartiles. Error bars represent the standard deviation. Outliers are represented as small stars. Abbreviations: Aβ, amyloid β; RT, room temperature; tTau, total Tau.
Fig. 3
Fig. 3
The effect of additional handling procedures on plasma levels of Aβ peptides and tTau. Tube transfer (A): Aβ1-40, Aβ1-42, Aβ42/40 ratio, and tTau in plasma after five consecutive transfers. Type of tube used after single freeze/thaw cycle (B): Aβ(1-40), Aβ(1-42), Aβ(1-42): Aβ(1-40) ratio, and tTau in plasma separated from blood collected into different primary tubes after one freeze/thaw cycle at –80°C. Values for different tubes were normalized to S-Monovette® K3-EDTA 9 mL tube. Number of freeze/thaw cycles (C): Aβ(1-40), Aβ(1-42), Aβ(1-42): Aβ(1-40) ratio, and tTau in plasma after one, two or three freeze/thaw cycles at –80°C. Values were normalized to baseline levels in freshly separated plasma before freezing. Storage temperatures (D): Aβ1-40, Aβ1-42, Aβ42/40 ratio, and tTau in plasma samples frozen and stored for 14 days at −20°C, −25°C, and −80°C. The values for each temperature were normalized to baseline levels in freshly separated plasma before freezing. Horizontal lines and filled squares within each box represent the median and the mean of the sample, respectively. The bottom and the top of each box represent the first and the fourth quartiles. Error bars represent the standard deviation. Outliers are represented as small stars. Abbreviations: Aβ, amyloid β; gel, presence of gel separator in a tube; K2E, K2-EDTA; K3E, K3-EDTA; PET, polyethylene terephthalate; PP, polypropylene; tTau, total Tau. For tube type abbreviations, please see Supplementary Table 1.
Fig. 4
Fig. 4
Recommendations for blood collection and sample handling for the analysis of AD-specific biomarkers. Abbreviations: EDTA, ethylenediaminetetraacetic acid; F/T, freeze/thaw. *If Aβ peptides are reported individually. †If Aβ(1-42): Aβ(1-40) ratio or tTau is reported. ‡Longer storage times have not been tested.

References

    1. Waldemar G., Phung K.T., Burns A., Georges J., Hansen F.R., Iliffe S. Access to diagnostic evaluation and treatment for dementia in Europe. Int J Geriatr Psychiatry. 2007;22:47–54. - PubMed
    1. Beach T.G., Monsell S.E., Phillips L.E., Kukull W. Accuracy of the clinical diagnosis of Alzheimer disease at National Institute on Aging Alzheimer Disease Centers, 2005-2010. J Neuropathol Exp Neurol. 2012;71:266–273. - PMC - PubMed
    1. Sabbagh M.N., Lue L.F., Fayard D., Shi J. Increasing precision of clinical diagnosis of Alzheimer's disease using a combined algorithm incorporating clinical and novel biomarker data. Neurol Ther. 2017;6:83–95. - PMC - PubMed
    1. Simonsen A.H., Herukka S.K., Andreasen N., Baldeiras I., Bjerke M., Blennow K. Recommendations for CSF AD biomarkers in the diagnostic evaluation of dementia. Alzheimers Dement. 2017;13:274–284. - PubMed
    1. Blennow K., Zetterberg H. Cerebrospinal fluid biomarkers for Alzheimer's disease. J Alzheimers Dis. 2009;18:413–417. - PubMed