. 2019 Apr 1;35(4):253-260.
doi: 10.3928/1081597X-20190304-01.

Biomechanical Impact of Localized Corneal Cross-linking Beyond the Irradiated Treatment Area

Biomechanical Impact of Localized Corneal Cross-linking Beyond the Irradiated Treatment Area

Joshua N Webb et al. J Refract Surg. .

Abstract

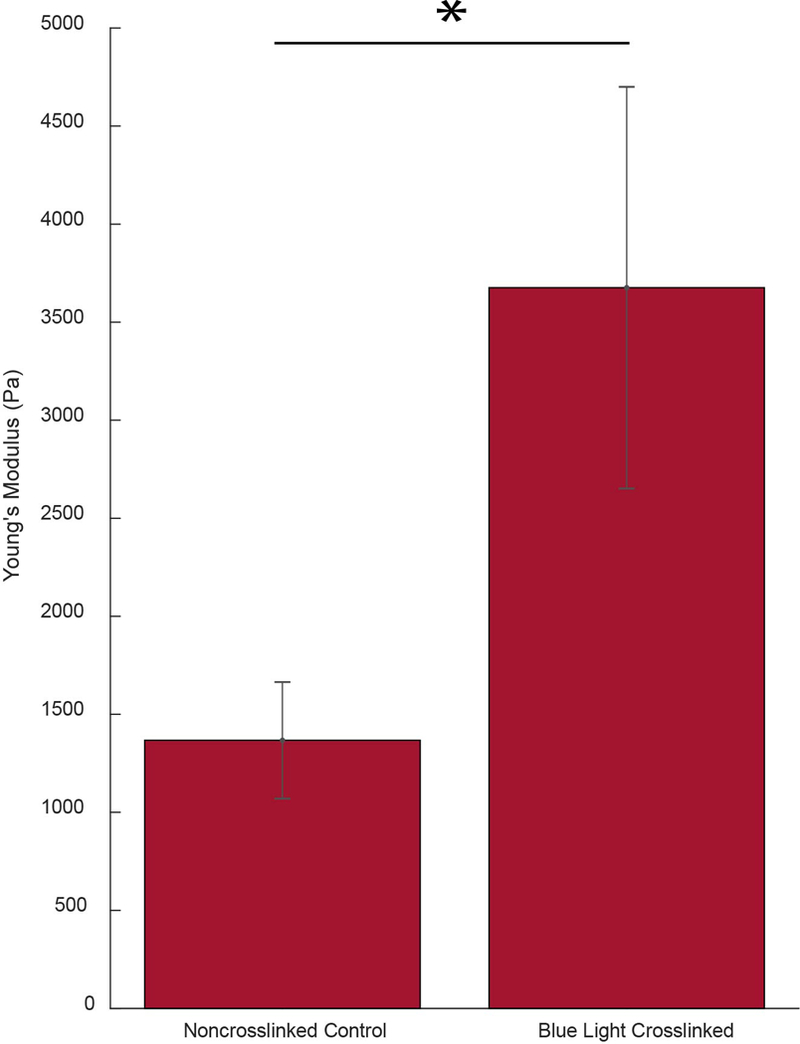
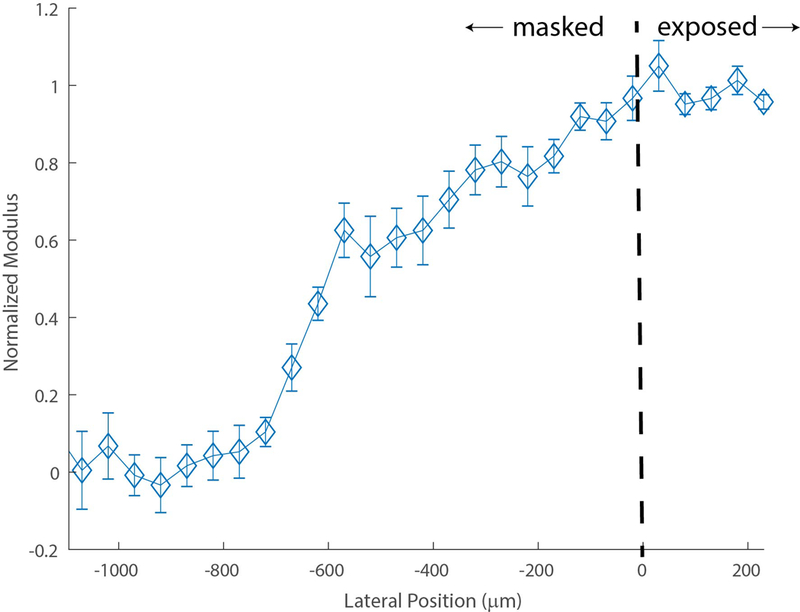
Purpose: To investigate the stiffening effect of localized corneal cross-linking (L-CXL) within and beyond the irradiated region in three dimensions.

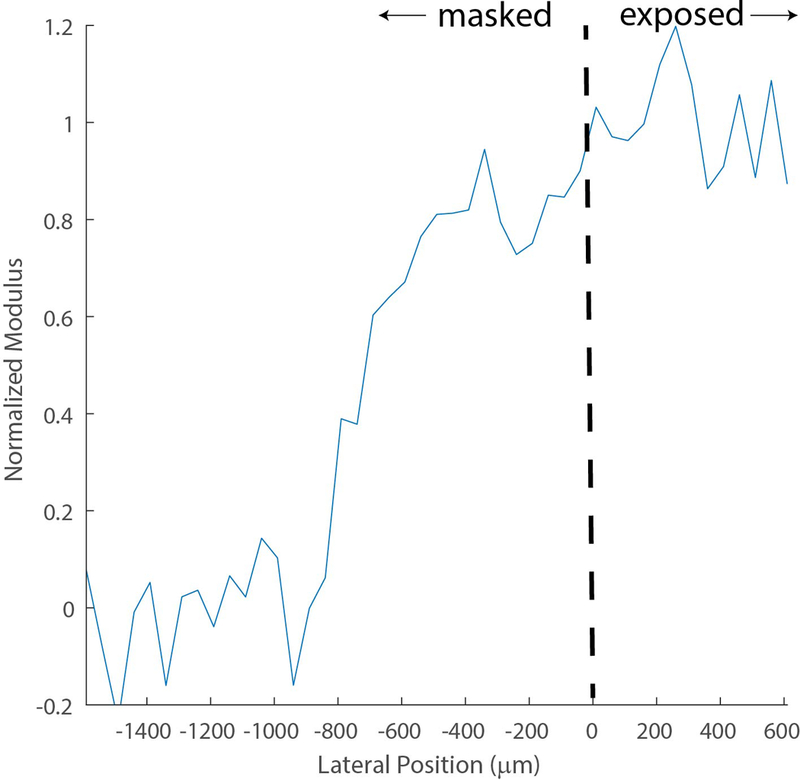
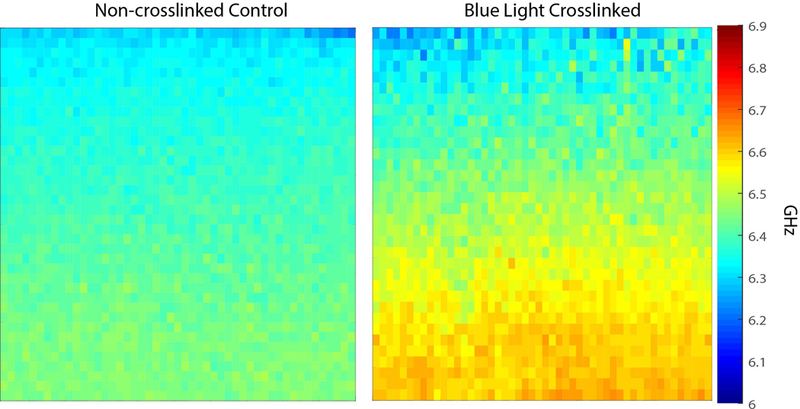
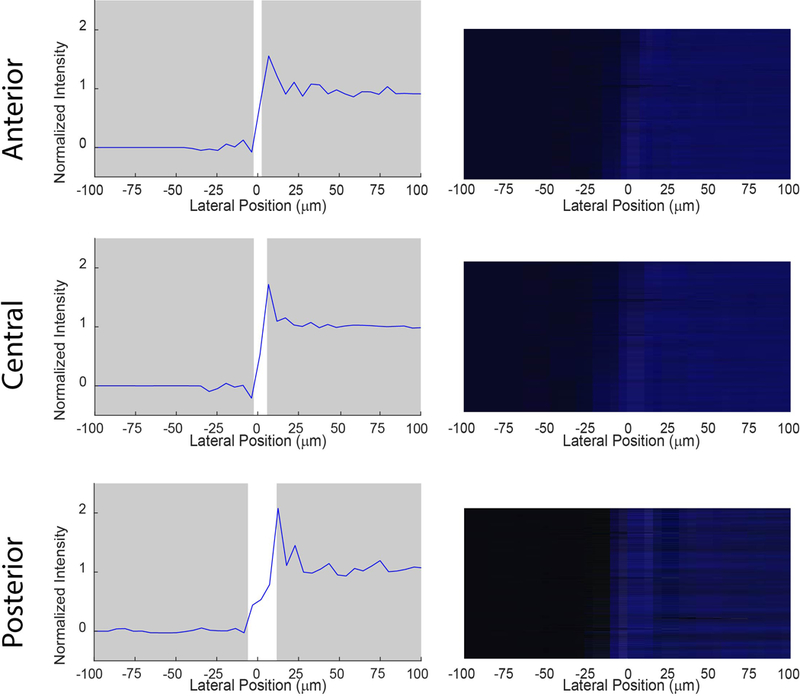
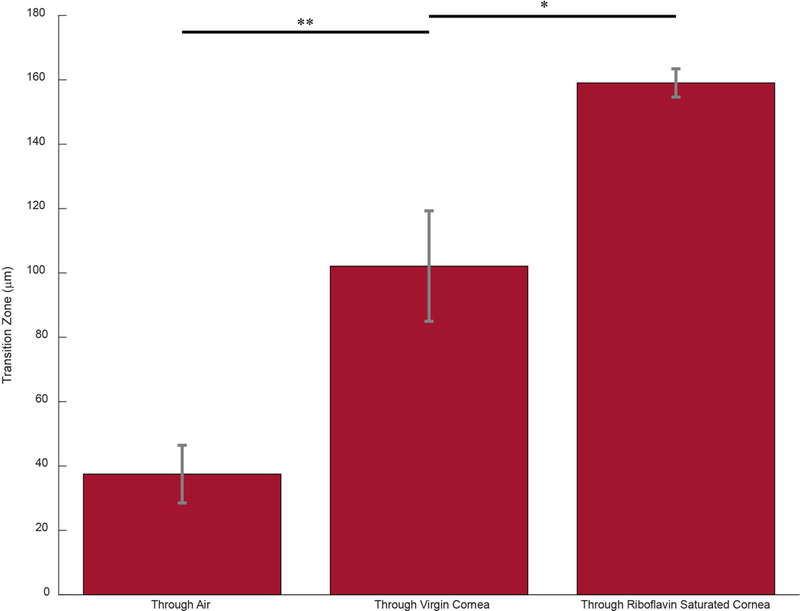
Methods: Ten porcine eyes were debrided of epithelium and incrementally soaked with 0.1% riboflavin solution. Using a customized, sharp-edged mask, half of the cornea was blocked while the other half was exposed to blue light (447 nm). The three-dimensional biomechanical properties of each cornea were then measured via Brillouin microscopy. An imaging system was used to quantify the optimal transition zone between cross-linked and non-cross-linked sections of the cornea when considering light propagation and scattering.

Results: A broad transition zone of 610 µm in width was observed between the fully cross-linked and non-cross-linked sections, indicating the stiffening response extended beyond the irradiated region. Light propagation and the scattering induced by the riboflavin-soaked cornea accounted for a maximum of 25 and 159 ± 3.2 µm, respectively.

Conclusions: The stiffening effect of L-CXL extends beyond that of the irradiated area. When considering L-CXL protocols clinically, it will be important to account for increased stiffening in surrounding regions. [J Refract Surg. 2019;35(4):253-260.].


Figures

Figure 1.
Figure 1.
a: Representative Brillouin map (4000 μm x 700 μm) produced with MATLAB software (color map: jet) depicting the Brillouin shifts of a UV-induced, locally crosslinked porcine cornea positioned anterior up. The dotted line illustrates the edge of the UV blocking mask, differentiating the blocked and exposed sections of the cornea. A higher Brillouin shift correlates to a higher Brillouin modulus. b: The normalized Brillouin shift versus lateral position. Similar to 1a, the dotted line illustrates the edge of the UV blocking mask. The transition zone was taken as 10–90% normalized shift.
Figure 1.
Figure 1.
a: Representative Brillouin map (4000 μm x 700 μm) produced with MATLAB software (color map: jet) depicting the Brillouin shifts of a UV-induced, locally crosslinked porcine cornea positioned anterior up. The dotted line illustrates the edge of the UV blocking mask, differentiating the blocked and exposed sections of the cornea. A higher Brillouin shift correlates to a higher Brillouin modulus. b: The normalized Brillouin shift versus lateral position. Similar to 1a, the dotted line illustrates the edge of the UV blocking mask. The transition zone was taken as 10–90% normalized shift.
Figure 2.
Figure 2.
a: Representative Brillouin maps (4000 μm x 700 μm) produced with MATLAB software (color map: jet) of both a virgin (control) as well as a blue light-crosslinked porcine cornea positioned anterior up. The crosslinked cornea was exposed to 15 mW/cm2 blue light for 20 minutes. b: Bar graph comparing the elasticity, found via Microsquisher® compression, of control corneal punches and crosslinked punches. Error bars represent SEM for each condition (* = p < 0.05).
Figure 2.
Figure 2.
a: Representative Brillouin maps (4000 μm x 700 μm) produced with MATLAB software (color map: jet) of both a virgin (control) as well as a blue light-crosslinked porcine cornea positioned anterior up. The crosslinked cornea was exposed to 15 mW/cm2 blue light for 20 minutes. b: Bar graph comparing the elasticity, found via Microsquisher® compression, of control corneal punches and crosslinked punches. Error bars represent SEM for each condition (* = p < 0.05).
Figure 3:
Figure 3:
Transition zone and representative light intensity image at anterior (0 μm), central (500 μm), and posterior (1000 μm) depths from the blocking mask generated from the blue light alone. The normalized light intensity versus lateral position was analyzed using Mightex CMOS-captured images at 0, 500, and 1000 μm between the mask and camera; representing the sharpest possible transition zones through air. Point 0 μm on the horizontal axis was located at 50% normalized intensity. The transition zone at any depth did not exceed 25 μm.
Figure 4.
Figure 4.
Averaged normalized transition zone of (n = 10) porcine corneas post blue light L-CXL. The dotted line illustrates the edge of the UV blocking mask, differentiating the blocked and exposed sections of the cornea. The average transition zone was calculated between the 10% and 90% of the maximum plateau of normalized shift. Error bars represent SEM for each position.
Figure 5.
Figure 5.
a: Representative graphs of the normalized light intensity versus lateral position from the 0 point at 50% intensity as the light traveled through air, a virgin cornea, and a riboflavin-soaked cornea to quantify light scattering propagation in each environment b: Bar graph representing the average transition zone as light traveled through three distinct environments. Error bars represent SEM for each condition (* = p < 0.05, ** = p <0.01)
Figure 5.
Figure 5.
a: Representative graphs of the normalized light intensity versus lateral position from the 0 point at 50% intensity as the light traveled through air, a virgin cornea, and a riboflavin-soaked cornea to quantify light scattering propagation in each environment b: Bar graph representing the average transition zone as light traveled through three distinct environments. Error bars represent SEM for each condition (* = p < 0.05, ** = p <0.01)

Similar articles

Cited by

References

    1. Gain P, Jullienne R, He Z, Aldossary M, Acquart S, Cognasse F, Thuret G. Global Survey of Corneal Transplantation and Eye Banking. JAMA Ophthalmology. 2016; 134(2): 167. - PubMed
    1. Scarcelli G, Besner S, Pineda R, Kalout P, Yun SH. In Vivo Biomechanical Mapping of Normal and Keratoconus Corneas. JAMA Ophthalmology. 2015; 133(4): 480–482. - PMC - PubMed
    1. Ruberti JW, Sinha Roy A, Roberts CJ. Corneal Biomechanics and Biomaterials. Annual Review of Biomedical Engineering. 2011; 13(1): 269–295. - PubMed
    1. Roberts CJ, Dupps WJ Jr. Biomechanics of corneal ectasia and biomechanical treatments. Journal of Cataract and Refractive Surgery. 2014; 40(6): 991–998. - PMC - PubMed
    1. Kymionis GD, Portaliou DM, Diakonis VF, Kounis GA, Panagopoulou SI, Grentzelos MA. Corneal Collagen Cross-linking With Riboflavin and Ultraviolet-A Irradiation in Patients With Thin Corneas. American Journal of Ophthalmology. 2012; 153(1): 24–28. - PubMed