. 2019 Jul 1;76(7):800-808.
doi: 10.1001/jamaneurol.2019.0658.

Association of Closed-Loop Brain Stimulation Neurophysiological Features With Seizure Control Among Patients With Focal Epilepsy

Affiliations

Association of Closed-Loop Brain Stimulation Neurophysiological Features With Seizure Control Among Patients With Focal Epilepsy

Vasileios Kokkinos et al. JAMA Neurol. .

Abstract

Importance: A bidirectional brain-computer interface that performs neurostimulation has been shown to improve seizure control in patients with refractory epilepsy, but the therapeutic mechanism is unknown.

Objective: To investigate whether electrographic effects of responsive neurostimulation (RNS), identified in electrocorticographic (ECOG) recordings from the device, are associated with patient outcomes.

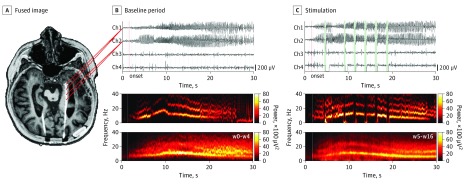
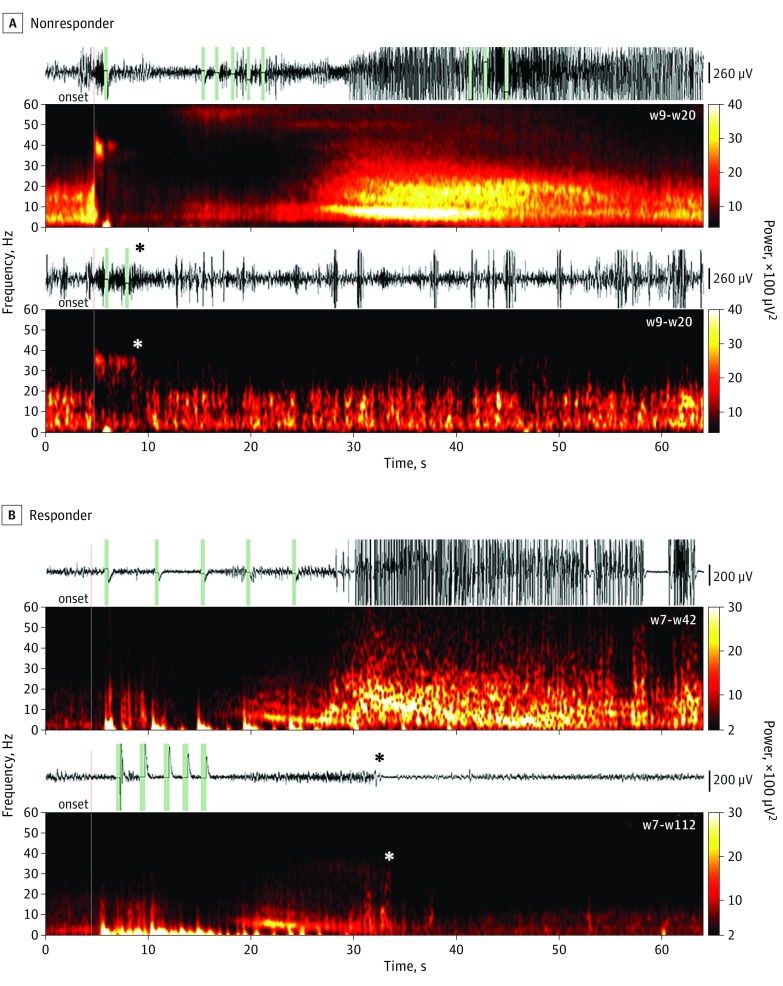
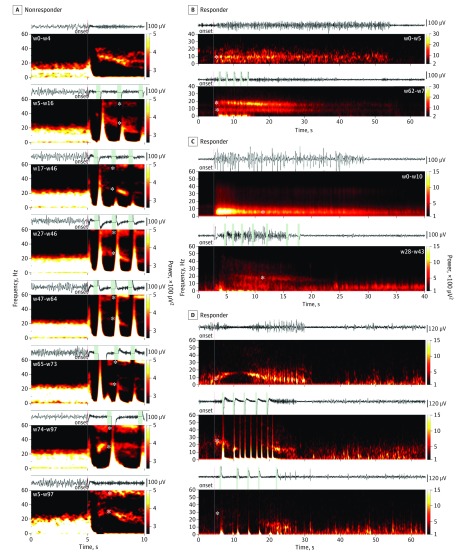
Design, setting, and participants: Retrospective review of ECOG recordings and accompanying clinical meta-data from 11 consecutive patients with focal epilepsy who were implanted with a neurostimulation system between January 28, 2015, and June 6, 2017, with 22 to 112 weeks of follow-up. Recorded ECOG data were obtained from the manufacturer; additional system-generated meta-data, including recording and detection settings, were collected directly from the manufacturer's management system using an in-house, custom-built platform. Electrographic seizure patterns were identified in RNS recordings and evaluated in the time-frequency domain, which was locked to the onset of the seizure pattern.

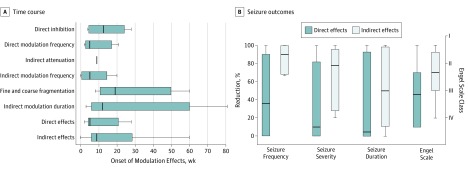
Main outcomes and measures: Patterns of electrophysiological modulation were identified and then classified according to their latency of onset in relation to triggered stimulation events. Seizure control after RNS implantation was assessed by 3 main variables: mean frequency of seizure occurrence, estimated mean severity of seizures, and mean duration of seizures. Overall seizure outcomes were evaluated by the extended Personal Impact of Epilepsy Scale questionnaires, a patient-reported outcome measure of 3 domains (seizure characteristics, medication adverse effects, and quality of life), with a range of possible scores from 0 to 300 in which lower scores indicate worse status, and the Engel scale, which comprises 4 classes (I-IV) in which lower numbers indicate greater improvement.

Results: Electrocorticographic data from 11 patients (8 female; mean [range] age, 35 [19-65] years; mean [range] duration of epilepsy, 19 [5-37] years) were analyzed. Two main categories of electrophysiological signatures of stimulation-induced modulation of the seizure network were discovered: direct and indirect effects. Direct effects included ictal inhibition and early frequency modulation but were not associated with improved clinical outcomes (odds ratio [OR], 0.67; 95% CI, 0.06-7.35; P > .99). Only indirect effects-those occurring remote from triggered stimulation-were associated with improved clinical outcomes (OR, infinity; 95% CI, -infinity to infinity; P = .02). These indirect effects included spontaneous ictal inhibition, frequency modulation, fragmentation, and ictal duration modulation.

Conclusions and relevance: These findings suggest that RNS effectiveness may be explained by long-term, stimulation-induced modulation of seizure network activity rather than by direct effects on each detected seizure.


Conflict of interest statement

Conflict of Interest Disclosures: None reported.

Figures

Figure 1.
Figure 1.. Closed-Loop Responsive Neurostimulation (RNS) Implantation and Data Processing Method
A, Preoperative magnetic resonance image and postimplantation computed tomography fused image (EpiNav software) aligned in the axial plane across the trajectory of the implanted RNS lead in the left hippocampus of patient 6. B, The 2 distal anterior hippocampal contacts provide bipolar channel 1, and the 2 proximal posterior hippocampal contacts form bipolar channel 2 (top), which record a unilateral electrographic seizure pattern (ESP) in the left hippocampus during the baseline period. For channel 2, a time-frequency plot shows the spectral evolution of the ESP aligned to onset (red vertical line). C, During stimulation, the amplifier is disconnected (time intervals in green), thereby generating a rectangular pulse artifact in the time domain (top) that is often followed by a considerable amplifier saturation direct current shift. In the frequency domain, stimulation appears as a low-frequency artifact accompanied by broadband cancellation (middle) that is often followed by a wideband artifact corresponding to amplifier saturation. Ch indicates channel; w, week of stimulation.
Figure 2.
Figure 2.. Direct Inhibition and Indirect Spontaneous Attenuation of Electrographic Seizure Patterns (ESPs)
A, Stimulated ESP examples for a nonresponder (patient 3). Most ESPs evolved despite stimulation (top), marked by an abrupt suppression of the normal background band and the appearance of a distinctive, high-beta, 30- to 40-Hz oscillation; some were inhibited shortly after their onset (bottom; asterisk marks the time point of the respective effect). B, Patient 11 (responder), whose typical ESP starts with a diffuse electro-decrement followed by the development of a theta-range (4-8 Hz) rhythm evolving into high–amplitude/power paroxysmal wide-band delta- to beta-range (2-30 Hz) rhythms overlaid with higher gamma (>30 Hz) frequencies (top). From weeks 7 to 112, a distinct number of ESPs were observed in which the development of the ongoing activity was spontaneously interrupted (bottom; asterisk) and the electrocorticography returned to normal background levels. Note that attenuation occurs more than 27 seconds after the first stimulation pulse and the bulk of stimulation ends almost 11 seconds before this spontaneous inhibition. Vertical lines represent ESP onsets (red) and stimulation events (green). w Indicates week of stimulation.
Figure 3.
Figure 3.. Direct and Indirect Frequency Modulation of Electrographic Seizure Patterns (ESPs)
A, Nonresponder’s ESP shows the 10 seconds centered on seizure pattern onset. A high- to low-beta (from 40 to 20 Hz) frequency band is systematically present at onset during baseline. During consecutive programming epochs, a progressive peristimulus attenuation of the initially dominant beta oscillation is seen, accompanied by progression of a novel gamma (55-60 Hz) oscillation (asterisks, weeks [w] 5-97). Both frequency bands appear concurrently in ESPs that were missed by stimulation throughout the stimulation periods. B, Responder’s ESP shows a baseline alpha-range (asterisk, 9-10 Hz) rhythm being replaced by a double band of independent theta and beta frequencies (asterisks, 6-10 Hz and 13-20 Hz, respectively). C, Responder’s ESP shows a semicontinuous progression of discharges in the delta to alpha range (asterisk, 2-10 Hz) and a newly appearing distinct subgroup of ESPs featuring a wide-band high-frequency distribution of epileptic oscillation (asterisk with range, 4-50 Hz). D, Responder’s electrographic seizures shows an arclike pattern in the delta to low-beta range (asterisk, 7-17 Hz) undergoing progressive changes in their onset spectral content during responsive neurostimulation treatment (asterisk, 20-36 Hz), evolving to diffuse spectrum low-power discharges (asterisk, 10-40 Hz). Vertical lines represent ESP onsets (red) and stimulation events (green).
Figure 4.
Figure 4.. Indirect Fine and Coarse Fragmentation of Electrographic Seizure Patterns (ESPs)
A, ESPs in a responder (patient 6) that became finely fragmented with a systematic and significant increase in interdischarge interval from a previous baseline mean of approximately 200 milliseconds (top, baseline weeks [w] 0-5 and first programming epoch weeks 5-16) to a posteffect interval of approximately 800 milliseconds (top) (asterisk; weeks 43-66). The corresponding spectrogram (bottom) assumes a comblike pattern compared with that of the unmodulated baseline ESP (middle). B, ESPs from a responder (patient 10) that became coarsely fragmented are characterized by pronounced discontinuities in their development during which the electrocorticogram (ECOG) returned to the background levels (asterisks; rows 3-5 of the ECOG/spectrogram pairs) with respect to both baseline (top; weeks 0-3) and unmodulated seizure patterns (second row). The fragmented epochs were not time locked to the electric stimulus and could appear more than once during the epileptic ictal discharge (asterisks; bottom row). Vertical lines represent ESP onsets (red) or stimulation events (green). Ch indicates channel.
Figure 5.
Figure 5.. Electrographic Seizure Pattern Effects: Time Course and Association With Seizure Outcomes
A, Onset of modulation effects in weeks after activation of the stimulation treatment. B, Percentages of the reductions in seizure frequency, severity, and duration compared with preimplantation baseline readings (left y-axis) and Engel scale scores (right y-axis) for patients having only direct effects and for those having indirect effects. The Engel scale consists of 4 classes (I-IV) in which lower numbers indicate greater improvement; class III or better defines a clinical responder. Internal line indicates median; box ends, first and third quartile; and limit lines, minimum and maximum values.

References

    1. Penfield W, Jasper H. Electrocorticography In: Epilepsy and the Functional Anatomy of the Human Brain. Boston, MA: Little Brown; 1954.
    1. Kossoff EH, Ritzl EK, Politsky JM, et al. . Effect of an external responsive neurostimulator on seizures and electrographic discharges during subdural electrode monitoring. Epilepsia. 2004;45(12):1560-1567. doi:10.1111/j.0013-9580.2004.26104.x - DOI - PubMed
    1. Stacey WC, Litt B. Technology insight: neuroengineering and epilepsy-designing devices for seizure control. Nat Clin Pract Neurol. 2008;4(4):190-201. doi:10.1038/ncpneuro0750 - DOI - PMC - PubMed
    1. Velasco M, Velasco F, Velasco AL, et al. . Subacute electrical stimulation of the hippocampus blocks intractable temporal lobe seizures and paroxysmal EEG activities. Epilepsia. 2000;41(2):158-169. doi:10.1111/j.1528-1157.2000.tb00135.x - DOI - PubMed
    1. Yamamoto J, Ikeda A, Satow T, et al. . Low-frequency electric cortical stimulation has an inhibitory effect on epileptic focus in mesial temporal lobe epilepsy. Epilepsia. 2002;43(5):491-495. doi:10.1046/j.1528-1157.2002.29001.x - DOI - PubMed

Publication types