. 2019 Apr 16;139(16):1957-1973.
doi: 10.1161/CIRCULATIONAHA.118.035408.

Progress Toward Improved Cardiovascular Health in the United States

Affiliations

Progress Toward Improved Cardiovascular Health in the United States

Katherine Pahigiannis et al. Circulation. .

Abstract

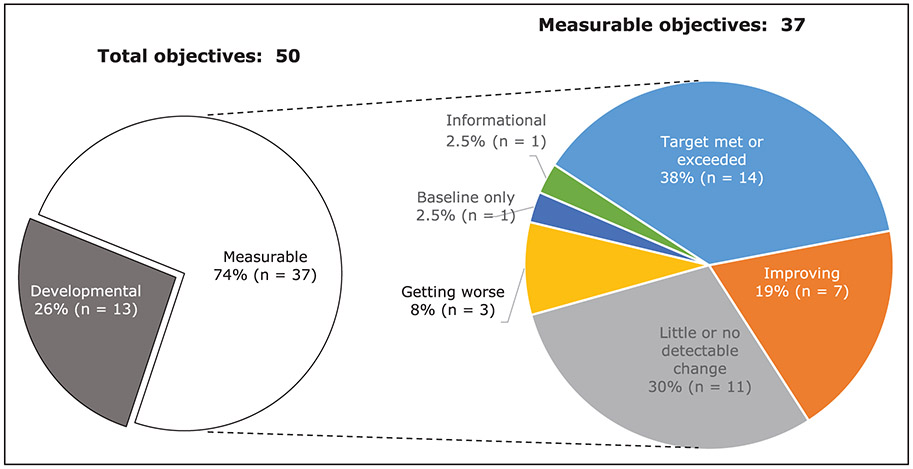
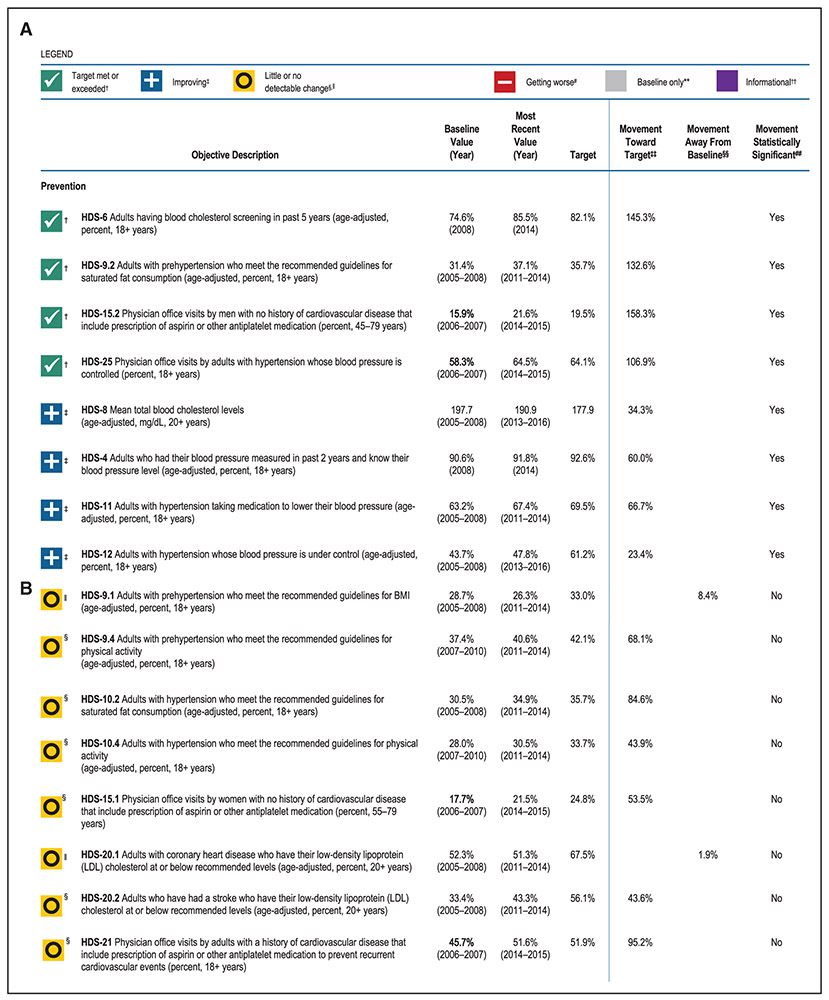
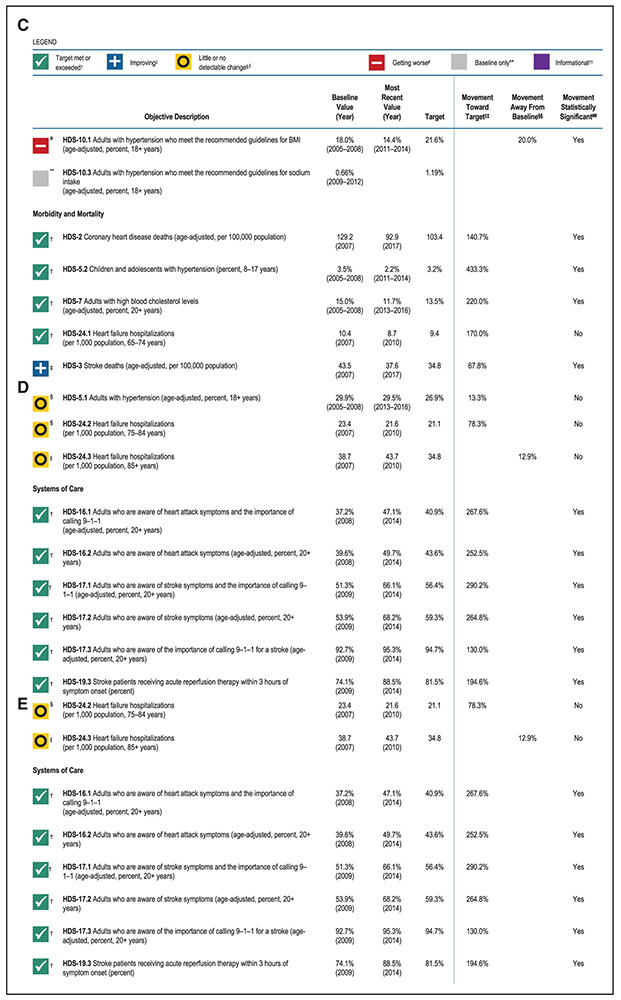
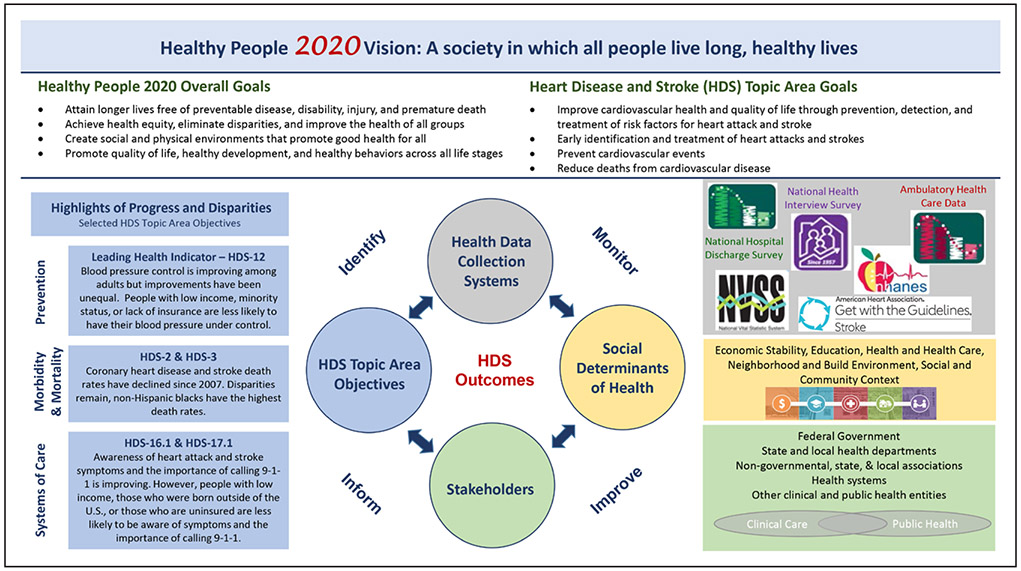
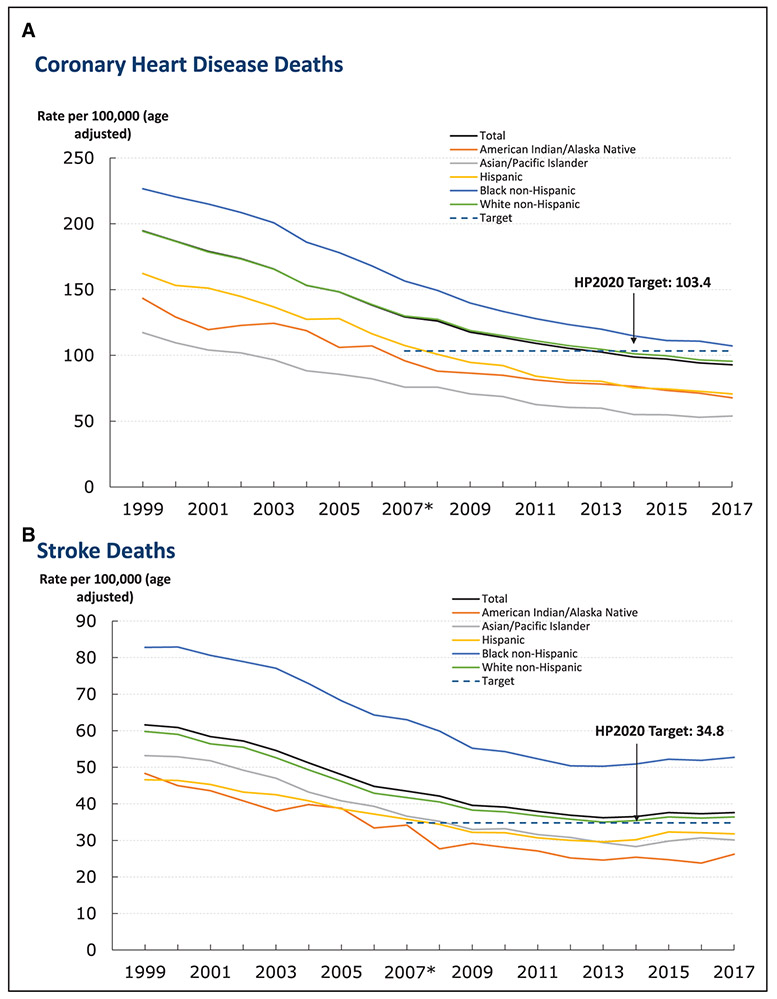
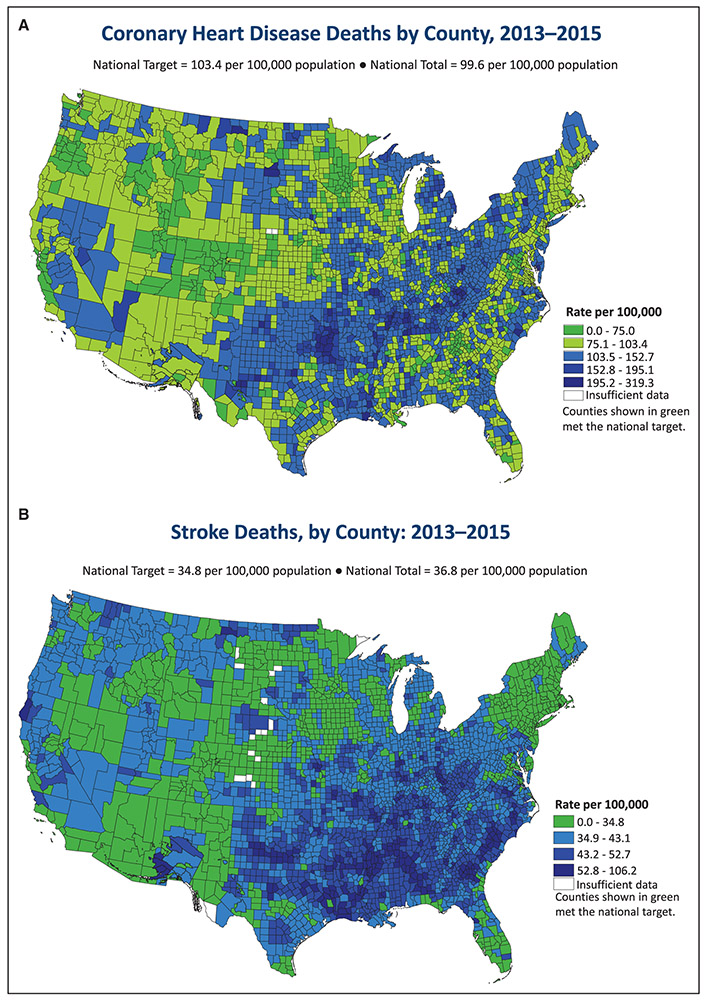
The Healthy People Initiative has served as the leading disease prevention and health promotion roadmap for the nation since its inception in 1979. Healthy People 2020 (HP2020), the initiative's current iteration, sets a national prevention agenda with health goals and objectives by identifying nationwide health improvement priorities and providing measurable objectives and targets from 2010 to 2020. Central to the overall mission and vision of Healthy People is an emphasis on achieving health equity, eliminating health disparities, and improving health for all population groups. The Heart Disease and Stroke (HDS) Work Group of the HP2020 Initiative aims to leverage advances in biomedical science and prevention research to improve cardiovascular health across the nation. The initiative provides a platform to foster partnerships and empower professional societies and nongovernmental organizations, governments at the local, state, and national levels, and healthcare professionals to strengthen policies and improve practices related to cardiovascular health. Disparities in cardiovascular disease burden are well recognized across, for example, race/ethnicity, sex, age, and geographic region, and improvements in cardiovascular health for the entire population are only possible if such disparities are addressed through efforts that target individuals, communities, and clinical and public health systems. This article summarizes criteria for creating and tracking the 50 HDS HP2020 objectives in 3 areas (prevention, morbidity/mortality, and systems of care), reports on progress toward the 2020 targets for these objectives based on the most recent data available, and showcases examples of relevant programs led by participating agencies. Although most of the measurable objectives have reached the 2020 targets ahead of time (n=14) or are on track to meet the targets (n=7), others may not achieve the decade's targets if the current trends continue, with 3 objectives moving away from the targets. This summary illustrates the utility of HP2020 in tracking measures of cardiovascular health that are of interest to federal agencies and policymakers, professional societies, and other nongovernmental organizations. With planning for Healthy People 2030 well underway, stakeholders such as healthcare professionals can embrace collaborative opportunities to leverage existing progress and emphasize areas for improvement to maximize the Healthy People initiative's positive impact on population-level health.

Keywords: heart disease; prevention; public policy; stroke.


Figures

Figure 1.
Figure 1.. Status of target attainment for 37 measurable objectives for the Heart Disease and Stroke section of Healthy People 2020, as of January 2019.
Target met or exceeded: The most recent value was equal to or exceeded the target. Improving: Movement was toward the target and statistically significant. Little or no change: Movement toward the target or away from the baseline was not statistically significant. Getting worse: Movement was away from the baseline and target and statistically significant. Measurable: Objective has a national baseline value. Developmental: Objective does not have baseline data. Baseline only: Objective has one data point only so progress cannot be assessed. Informational: Objective does not have a target so progress cannot be assessed. Percent of targeted change achieved = 100 × (most recent value – baseline value) / (HP2020 target – baseline value); percent in deficit = 100 × ∣most recent value – baseline value∣ / (baseline value). This figure was originally published as part of the Healthy People 2020 Midcourse Review (https://www.cdc.gov/nchs/healthy_people/hp2020/hp2020_midcourse_review.htm) and has been adapted for this paper.
Figure 2.
Figure 2.. Most recent progress for Healthy People 2020 measurable* Heart Disease and Stroke Objectives, January 2019.
The figure shows progress based on most recent available data for measurable Healthy People 2020 Heart Disease and Stroke Objectives. See HealthyPeople.gov for all Healthy People 2020 data, and the Healthy People Statistical Note provides more information on the measures of progress. Objectives categorized as Prevention are shown in panels A–C, Morbidity and Mortality in panels C and D, and Systems of Care in panels D and E. This figure was originally published as part of the Healthy People 2020 Midcourse Review (https://www.cdc.gov/nchs/healthy_people/hp2020/hp2020_midcourse_review.htm) and has been adapted for this paper. The objectives have been reorganized and updated with the most recently available data and thus will be different from the data presented in the Midcourse Review. Baseline values have been updated for 4 objectives (HDS-15.2, HDS-25, HDS-15.1, and HDS-21), and 1 baseline value is new (HDS-22) since the Midcourse Review publication; these revised baseline values are depicted in bold. *Measurable objectives had a national baseline value. †Target met or exceeded: The most recent value was equal to or exceeded the target. (The percentage of targeted change achieved was equal to or greater than 100%.) ‡Improving: Movement was toward the target, and the percentage of targeted change achieved was statistically significant. Little or no detectable change: §Movement was toward the target, but the percentage of targeted change achieved was not statistically significant. ∥Movement was away from the baseline and target, but the percentage change relative to the baseline was not statistically significant. #Getting worse: Movement was away from the baseline and target, and the percentage change relative to the baseline was statistically significant. **Baseline only: The objective only had 1 data point, so progress toward target attainment could not be assessed. ††Informational: A target was not set for this objective, so progress toward target attainment could not be assessed. ‡‡For objectives that moved toward their targets, movement toward the target was measured as the percentage of targeted change achieved: Most recent valueBaseline valueHP2020 targetBaseline value×100 §§For objectives that moved away from their baselines and targets, movement away from the baseline was measured as the magnitude of the percentage change from baseline: Most recent valueBaseline valueBaseline value×100 ##Statistical significance was tested when the objective had a target and at least 2 data points, and a normal distribution could be assumed. Statistical significance of the percentage of targeted change achieved or the magnitude of the percentage change from baseline was assessed at the 0.05 level using a normal 1-sided test. BMI indicates body mass index; and HDS, Heart Disease and Stroke.
Figure 3.
Figure 3.. Model depicting the interconnection of the Healthy People 2020 Vision and Goals and improvement in Heart Disease and Stroke (HDS) outcomes through key components which identify, monitor, and inform Heart Disease and Stroke topic area objectives.
The figure depicts the interconnection of the Healthy People 2020 vision and goals, the HDS topic area goals, and changes in HDS outcomes through key components that identify, monitor, and inform HDS topic area objectives. The HDS topic area objectives were categorized into 3 areas: prevention, morbidity and mortality, and systems of care. Highlights of progress and disparities in each of these areas are described in the blue boxes with the objective number indicated. Objective HDS-12 proposed to increase the proportion of adults with hypertension whose blood pressure is under control. HDS-2 and HDS-3 proposed to reduce coronary heart disease deaths and stroke deaths. HDS-16.1 and 17.1 proposed to increase the proportion of adults aged ≥20 years who are aware of the early warning symptoms and signs of a heart attack and the importance of accessing rapid emergency care by calling 9–1–1 or another emergency number. Examples of Health Data Collection Systems used by the HDS topic are shown in the gray box, 5 social determinants of health recognized by the Healthy People initiative are shown in the yellow box, and stakeholders which work independently and collaboratively, and who span the clinical care and public health arenas, are listed in the green box. For more information, please visit: https://www.healthypeople.gov/ and https://www.cdc.gov/nchs/healthy_people/hp2020/hp2020_midcourse_review.htm. NHANES indicates National Health and Nutrition Examination Survey; and NVSS, National Vital Statistics System.
Figure 4.
Figure 4.. Mortality trends for coronary heart disease and stroke.
The figure shows trends for deaths from coronary heart disease (A) and stroke (B) by race / ethnicity. *Healthy People 2020 (HP2020) baseline (2007). Data are for the International Classification of Diseases, Tenth Revision, codes I20–I25 (A) or I60–I69 (B) reported as the underlying cause of death (Healthy People objectives HDS-2 and HDS-3, respectively). Rates are age-adjusted to the 2000 standard population. Before 2003, only 1 race category could be recorded; recording ≥1 race was not an option. Beginning in 2003, multiple-race data were reported by some states; multiple-race data were bridged to the single-race categories for comparability. Source: National Vital Statistics System–Mortality, Centers for Disease Control and Prevention (CDC)/National Center for Health Statistics (NCHS); Bridged-Race Population Estimates, CDC/NCHS and Census. This figure has been adapted from documents prepared for the Healthy People 2020 Progress Review and updated with the most recently available data. The original figures can be found on slides 27 and 28 in the presentation at this link: https://www.cdc.gov/nchs/healthy_people/hp2020/hp2020_aocbc_and_hds_progress_review.htm. HDS, Heart Disease and Stroke.
Figure 5.
Figure 5.. County-level mortality maps of coronary Heart Disease and Stroke (HDS)The figure shows deaths from coronary heart disease (A) and stroke (B) by county.
Data are for International Classification of Diseases, Tenth Revision, codes I20–I25 (A) or I60–I69 (B) reported as the underlying cause of death Healthy People 2020 [HP2020] objectives HDS-2 and HDS-3, respectively). Rates are age-adjusted to the 2000 standard population. Rates are spatially smoothed to enhance the stability of rates in counties with small populations. Data are displayed by a modified Jenks classification for US counties, which creates categories that minimize within-group variation and maximize between-group variation. Sources: National Vital Statistics System–Mortality, Centers for Disease Control and Prevention (CDC)/National Center for Health Statistics (NCHS); Bridged-Race Population Estimates, CDC/NCHS and Census. Interactive Atlas of Heart Disease and Stroke, CDC/National Center for Chronic Disease Prevention and Health Promotion (NCCDPHP) https://nccd.cdc.gov/DHDSPAtlas/.

References

    1. U.S. Department of Health and Human Services, Centers for Disease Control and Prevention, National Center for Health Statistics. Health, United States, 2017: With special feature on mortality. 2018. https://www.cdc.gov/nchs/data/hus/hus17.pdf.Accessed March 28, 2019.
    1. Lackland DT, Roccella EJ, Deutsch AF, Fornage M, George MG, Howard G, Kissela BM, Kittner SJ, Lichtman JH, Lisabeth LD, Schwamm LH, Smith EE, Towfighi A; American Heart Association Stroke Council; Council on Cardiovascular and Stroke Nursing; Council on Quality of Care and Outcomes Research; Council on Functional Genomics and Translational Biology. Factors influencing the decline in stroke mortality: a statement from the American Heart Association/American Stroke Association. Stroke. 2014;45:315–353. doi: 10.1161/01.str.0000437068.30550.cf - DOI - PMC - PubMed
    1. Ford ES, Capewell S. Proportion of the decline in cardiovascular mortality disease due to prevention versus treatment: public health versus clinical care. Annu Rev Public Health. 2011;32:5–22. doi: 10.1146/annurev-publhealth-031210-101211 - DOI - PubMed
    1. Sidney S, Quesenberry CP Jr, Jaffe MG, Sorel M, Nguyen-Huynh MN, Kushi LH, Go AS, Rana JS. Recent trends in cardiovascular mortality in the United States and public health goals. JAMA Cardiol. 2016;1:594–599. doi: 10.1001/jamacardio.2016.1326 - DOI - PubMed
    1. Yang Q, Tong X, Schieb L, Vaughan A, Gillespie C, Wiltz JL, King SC, Odom E, Merritt R, Hong Y, George MG. Vital signs: recent trends in stroke death rates - United States, 2000-2015. MMWR Morb Mortal Wkly Rep. 2017;66:933–939. doi: 10.15585/mmwr.mm6635e1 - DOI - PMC - PubMed

MeSH terms