. 2019 Apr 15;15(4):e1008114.
doi: 10.1371/journal.pgen.1008114. eCollection 2019 Apr.

Distinct evolutionary dynamics of horizontal gene transfer in drug resistant and virulent clones of Klebsiella pneumoniae

Affiliations

Distinct evolutionary dynamics of horizontal gene transfer in drug resistant and virulent clones of Klebsiella pneumoniae

Kelly L Wyres et al. PLoS Genet. .

Abstract

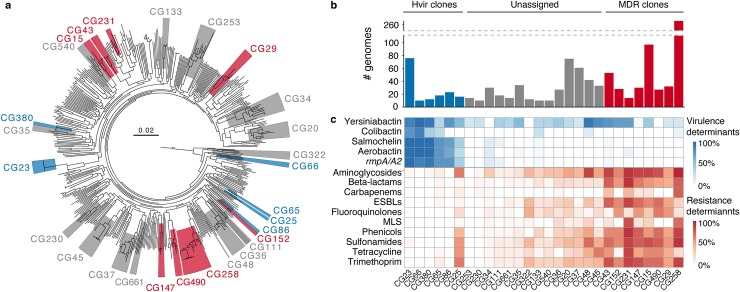
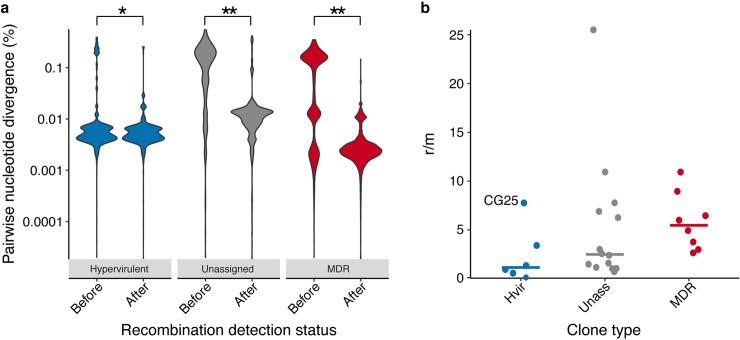
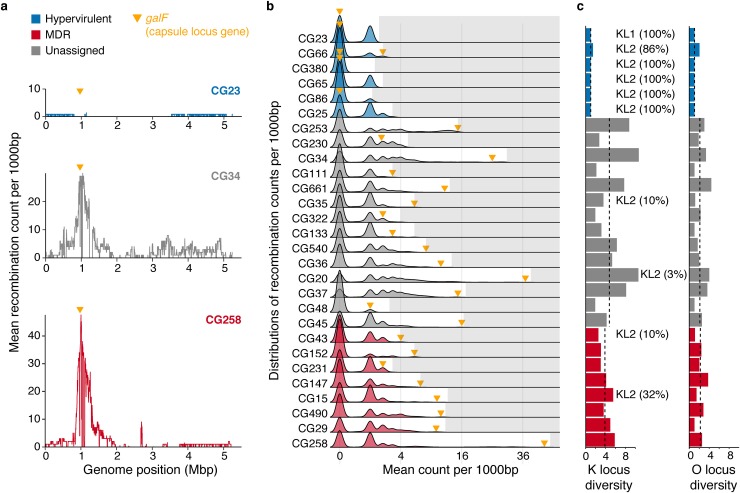
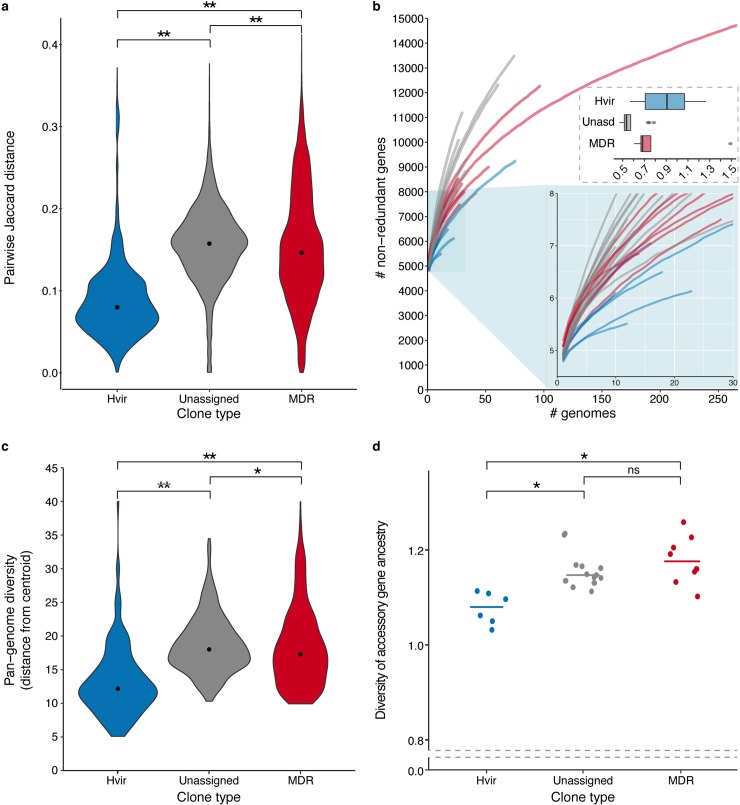
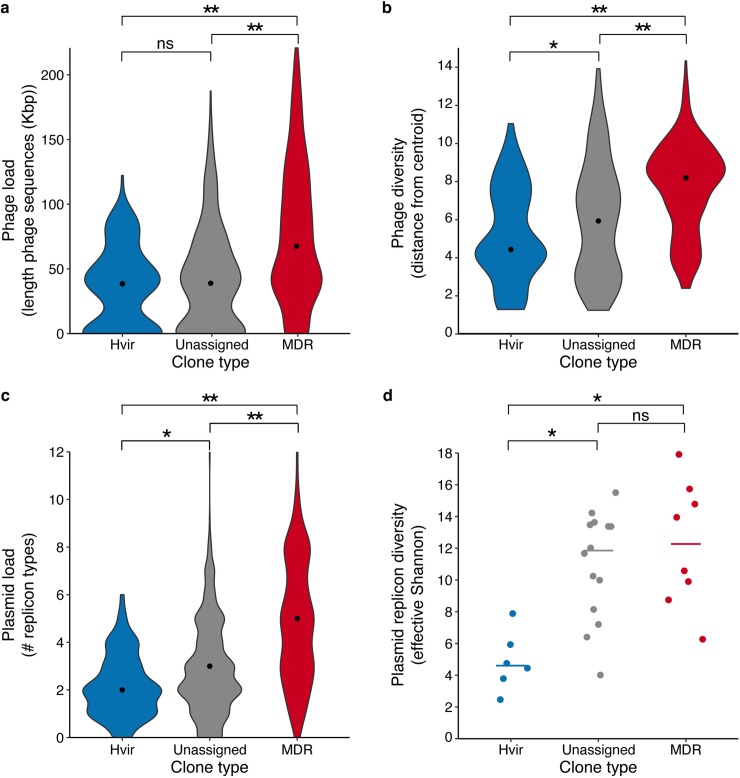
Klebsiella pneumoniae has emerged as an important cause of two distinct public health threats: multi-drug resistant (MDR) healthcare-associated infections and drug susceptible community-acquired invasive infections. These pathotypes are generally associated with two distinct subsets of K. pneumoniae lineages or 'clones' that are distinguished by the presence of acquired resistance genes and several key virulence loci. Genomic evolutionary analyses of the most notorious MDR and invasive community-associated ('hypervirulent') clones indicate differences in terms of chromosomal recombination dynamics and capsule polysaccharide diversity, but it remains unclear if these differences represent generalised trends. Here we leverage a collection of >2200 K. pneumoniae genomes to identify 28 common clones (n ≥ 10 genomes each), and perform the first genomic evolutionary comparison. Eight MDR and 6 hypervirulent clones were identified on the basis of acquired resistance and virulence gene prevalence. Chromosomal recombination, surface polysaccharide locus diversity, pan-genome, plasmid and phage dynamics were characterised and compared. The data showed that MDR clones were highly diverse, with frequent chromosomal recombination generating extensive surface polysaccharide locus diversity. Additional pan-genome diversity was driven by frequent acquisition/loss of both plasmids and phage. In contrast, chromosomal recombination was rare in the hypervirulent clones, which also showed a significant reduction in pan-genome diversity, largely driven by a reduction in plasmid diversity. Hence the data indicate that hypervirulent clones may be subject to some sort of constraint for horizontal gene transfer that does not apply to the MDR clones. Our findings are relevant for understanding the risk of emergence of individual K. pneumoniae strains carrying both virulence and acquired resistance genes, which have been increasingly reported and cause highly virulent infections that are extremely difficult to treat. Specifically, our data indicate that MDR clones pose the greatest risk, because they are more likely to acquire virulence genes than hypervirulent clones are to acquire resistance genes.


Conflict of interest statement

The authors have declared that no competing interests exist.

Figures

Fig 1
Fig 1. Definition of K. pneumoniae clones investigated in this study.
a) Phylogenetic tree inferred using maximum likelihood for K. pneumoniae genomes selected from our curated collection to represent the 509 distinct 7-gene chromosomal multi-locus sequence types. Phylogenetic clusters (monophyletic groups) were defined using patristic distance (cut-off = 0.04). Clusters corresponding to clones included in comparative analyses are marked; blue, hypervirulent; grey, unassigned; red, multi-drug resistant. b) Total number of genomes included in comparative analyses, coloured by clone type as above. Note that sample sizes exceed the number of isolates shown in the tree for the corresponding clones. c) Distribution of virulence and resistance determinants by clone. Intensity of box shading indicates the proportion of genomes harbouring the key virulence loci (blue) or acquired genes conferring resistance to different classes of antimicrobials (red), as per inset legends. Hypervirulent (Hvir) clones were defined by hierarchical clustering of virulence locus data. Multi-drug resistant (MDR) clones were defined by hierarchical clustering of resistance data. AMR, antimicrobial resistance; rmpA/A2, regulators of mucoid phenotype; ESBLs, extended spectrum beta-lactams; MLS, macrolide, lincosamide and streptogramin B antibiotics.
Fig 2
Fig 2. Nucleotide divergence and recombination dynamics.
a) Violin plots showing distributions of pairwise nucleotide divergences grouped by clone type. Data points represent comparisons between pairs of genomes within clones. Pairwise values were clalculated before and after removal of recombinant sequence regions identified by Gubbins [35]. *, p < 0.001; **, p < 1x10-15. b) Scatter plot showing the ratio of single nucleotide polymorphisms introduced by recombination vs mutation (r/m) for each clone grouped by clone type (n = 6, 14 and 8 for the hypervirulent, unassigned and MDR groups, respectively). Bars indicate median values.
Fig 3
Fig 3. Recombination hotspots, capsule (K) and LPS antigen (O) locus diversity.
a) Example plots showing mean recombination counts per base calculated over non-overlapping 1000 bp windows of the chromosome for hypervirulent CG23, unassigned CG34 and multi-drug resistant CG258. The latter two have a distinct peak in recombination counts around the K/O loci (marked by the yellow arrows). b) Density plots showing the distributions of mean recombination counts per base calculated as in 3a. For each row, grey shading marks values outside the distribution of that clone and the yellow arrow indicates the value for the window containing galF, the 5’-most K locus gene. Plots are coloured by clone type as above. c) K and O locus diversities by clone (effective Shannon’s diversities). Clones harbouring KL1 or KL2 encoding the highly serum resistant capsule types K1 and K2, respectively are marked (numbers in parentheses indicate the percentage of successfully typed genomes harbouring the locus). Bars are coloured by clone type as above. Dashed lines indicate median values for each clone type.
Fig 4
Fig 4. Gene content diversity.
a) Pairwise gene content Jaccard distances were calculated for all pairs of genomes within each clone and are summarised by clone type (n = 7150, 15754, 86228 pairs for the hypervirulent, unassigned and MDR groups, respectively). Black points indicate median values. b) Gene accumulation curves were generated independently for each clone using the rarefy function in the R Vegan [91] package to analyse each gene content matrix, and are coloured by clone type. The upper inset box shows the distributions of alpha values. The lower inset box shows a magnified view for up to 30 genomes. c) Violin plots showing the distributions of Euclidean distances from clone centroids for each genome, calculated from the gene content matrix after decomposition to 463 dimensions (n = 155, 390 and 547 for the hypervirulent, unassigned and MDR groups, respectively). Black points indicate median values. d) Scatter plot showing ancestral diversity of accessory genes for each clone grouped by clone type. Accessory genes were identified as those present in <95% genomes. Each gene was assigned to a putative ancestral origin using Kraken v0.10.6, genus level assignments were used to calculate Shannon’s diversity indices (n = 6, 14 and 8 for the hypervirulent, unassigned and MDR groups, respectively). Horizontal lines indicate median values. Note that the y-axis is broken. For all panels, brackets indicate Wilcoxon Rank Sum tests of pairwise group comparisons; ns, not significant; *, p < 0.05; **, p < 1x10-15.
Fig 5
Fig 5. Phage and plasmid diversity.
a) Violin plots showing the distributions of the total length (kbp) of phage sequence identified per genome. b) Violin plots showing the distributions of Euclidean distance to clone centroids calculated from the phage gene content matrix decomposed into 210 dimensions. c) Violin plots showing the distributions of plasmid replicon count per genome (note that perfectly co-occurring replicons are counted once only). d) Effective Shannon’s diversities for plasmid replicons, by clone. Horizontal lines indicate median values (n = 6, 14 and 8 for the hypervirulent, unassigned and MDR groups, respectively). For all violin plots, data points represent individual genomes (n = 155, 390 and 547 for the hypervirulent, unassigned and MDR groups, respectively) and black points indicate median values. For all panels, brackets indicate Wilcoxon Rank Sum tests of pairwise group comparisons; ns, not significant; *, p < 0.01; **, p < 1x10-15.

References

    1. Holt KE, Wertheim H, Zadoks RN, Baker S, Whitehouse CA, Dance D, et al. Genomic analysis of diversity, population structure, virulence, and antimicrobial resistance in Klebsiella pneumoniae, an urgent threat to public health. Proc Natl Acad Sci U S A. 2015;112: E3574–81. 10.1073/pnas.1501049112 - DOI - PMC - PubMed
    1. Bialek-Davenet S, Criscuolo A, Ailloud F, Passet V, Jones L, Delannoy-Vieillard AS, et al. Genomic definition of hypervirulent and multidrug-resistant Klebsiella pneumoniae clonal groups. Emerg Infect Dis. 2014;20: 1812–1820. 10.3201/eid2011.140206 - DOI - PMC - PubMed
    1. Brisse S, Fevre C, Passet V, Issenhuth-Jeanjean S, Tournebize R, Diancourt L, et al. Virulent clones of Klebsiella pneumoniae: Identification and evolutionary scenario based on genomic and phenotypic characterization. PLoS One. 2009;4: e4982 10.1371/journal.pone.0004982 - DOI - PMC - PubMed
    1. Navon-Venezia S, Kondratyeva K, Carattoli A. Klebsiella pneumoniae: A major worldwide source and shuttle for antibiotic resistance. FEMS Microbiol Rev. 2017;41: 252–275. 10.1093/femsre/fux013 - DOI - PubMed
    1. Wyres KL, Holt KE. Klebsiella pneumoniae population genomics and antimicrobial-resistant clones. Trends Microbiol. 2016;24: 944–956. 10.1016/j.tim.2016.09.007 - DOI - PubMed

Publication types

MeSH terms

Substances