. 2019 Apr 2;20(7):1629.
doi: 10.3390/ijms20071629.

Human Multilineage 3D Spheroids as a Model of Liver Steatosis and Fibrosis

Affiliations

Human Multilineage 3D Spheroids as a Model of Liver Steatosis and Fibrosis

Piero Pingitore et al. Int J Mol Sci. .

Abstract

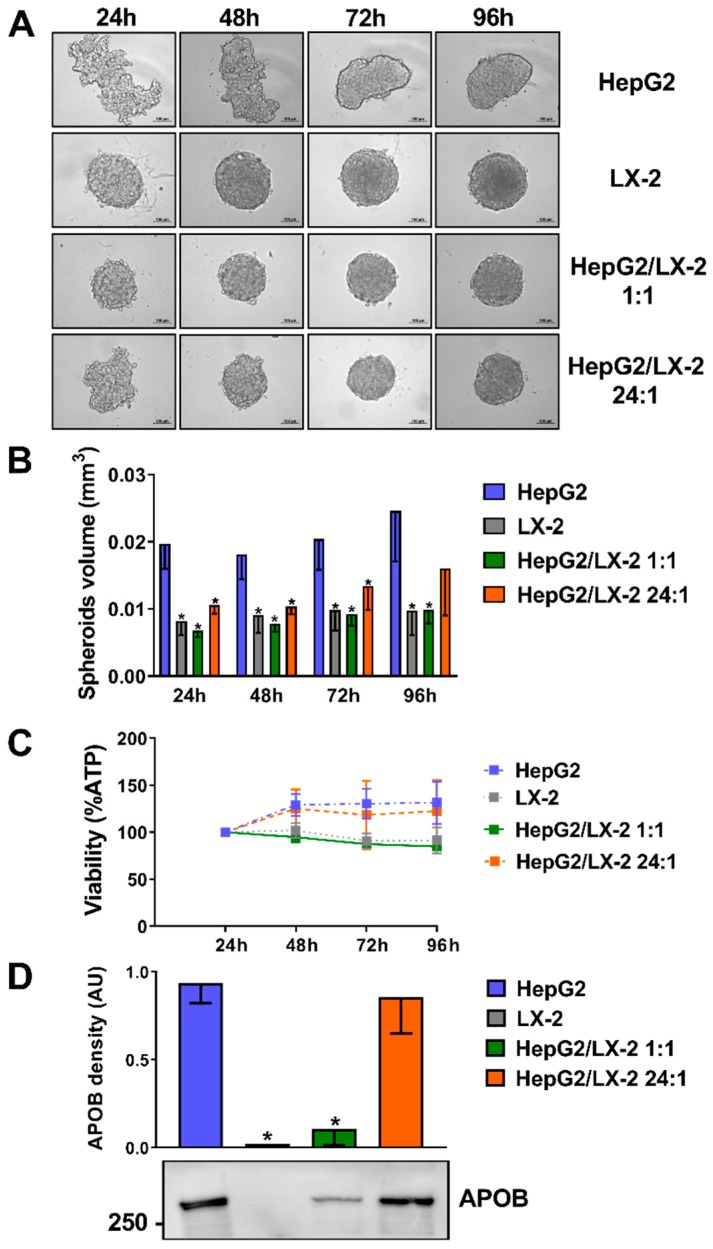
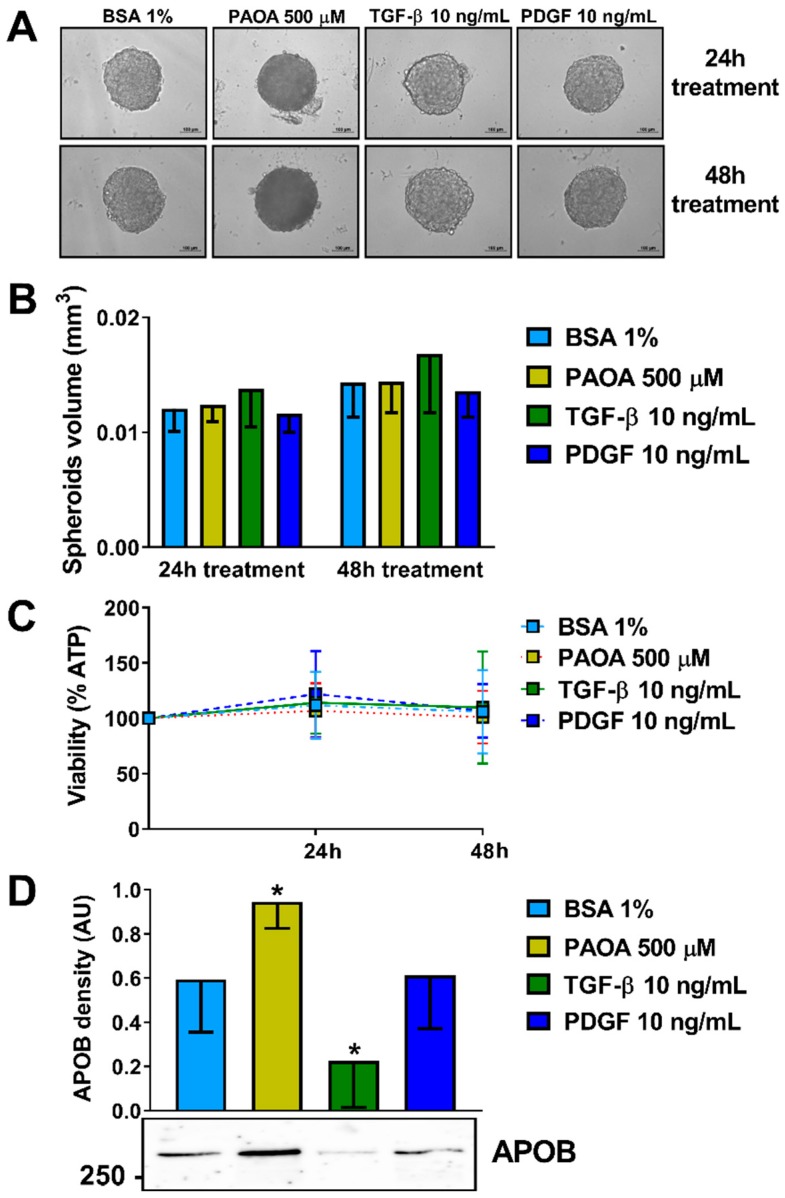
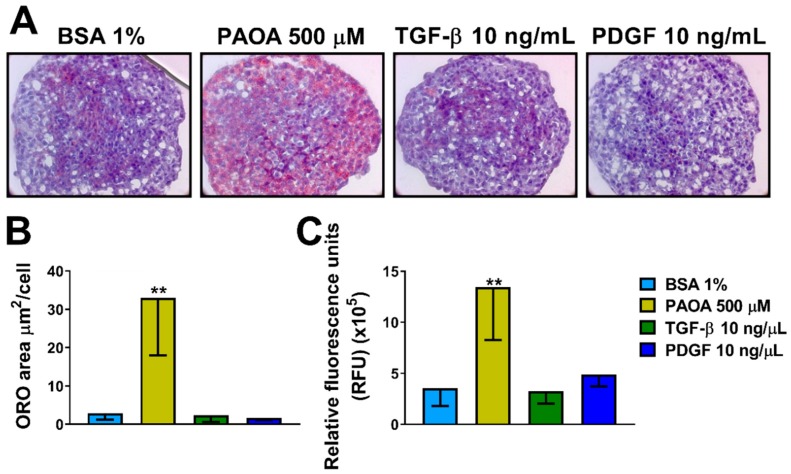
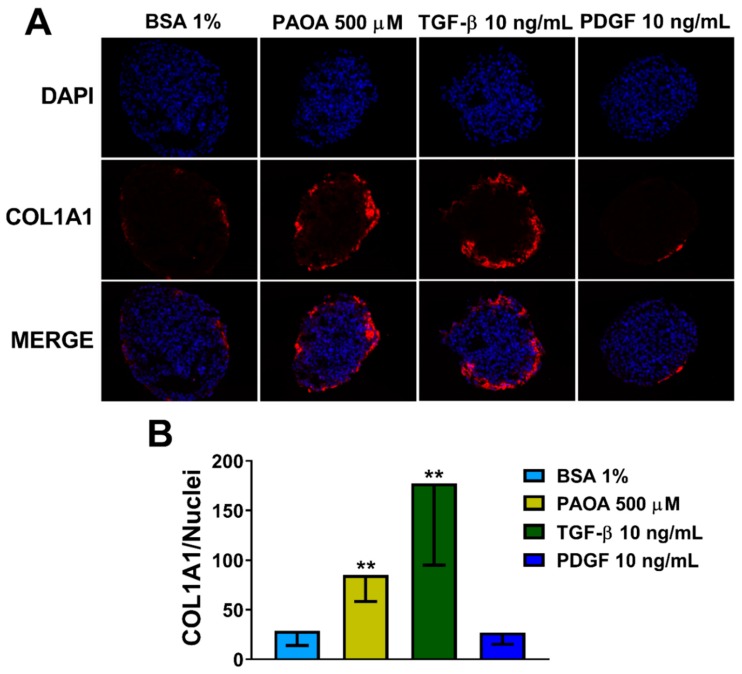
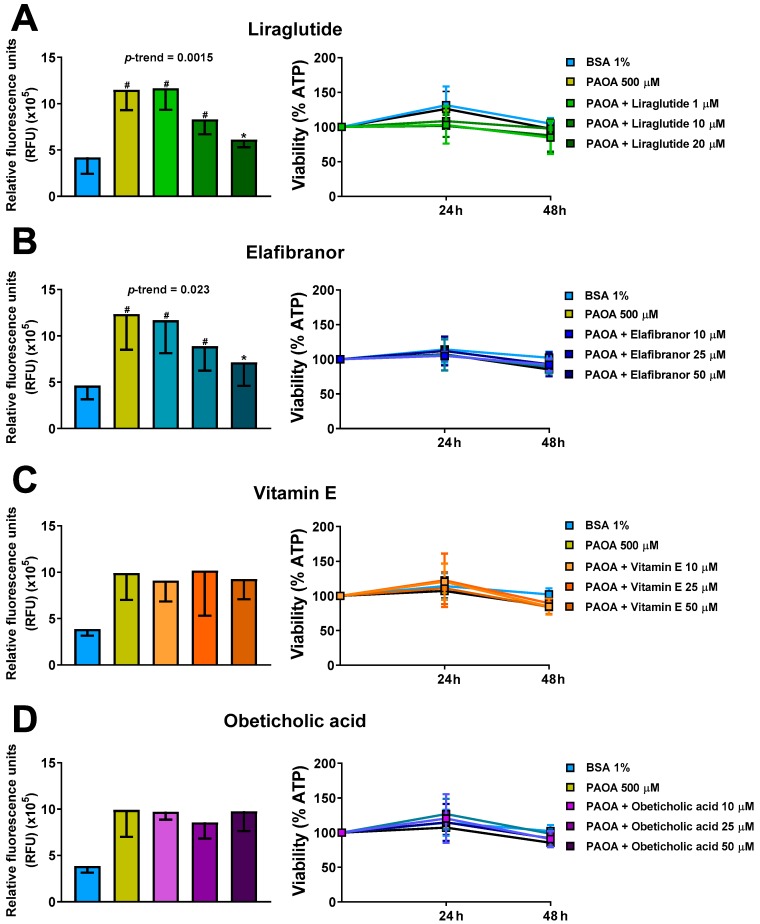
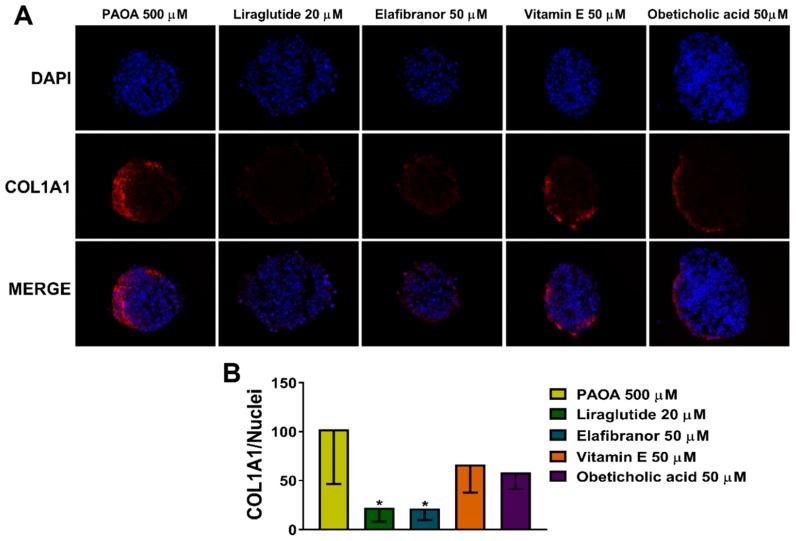
Non-alcoholic fatty liver disease (NAFLD) is the most common liver disorder in western countries. Despite the high prevalence of NAFLD, the underlying biology of the disease progression is not clear, and there are no approved drugs to treat non-alcoholic steatohepatitis (NASH), the most advanced form of the disease. Thus, there is an urgent need for developing advanced in vitro human cellular systems to study disease mechanisms and drug responses. We attempted to create an organoid system genetically predisposed to NAFLD and to induce steatosis and fibrosis in it by adding free fatty acids. We used multilineage 3D spheroids composed by hepatocytes (HepG2) and hepatic stellate cells (LX-2) with a physiological ratio (24:1). HepG2 and LX-2 cells are homozygotes for the PNPLA3 I148M sequence variant, the strongest genetic determinant of NAFLD. We demonstrate that hepatic stellate cells facilitate the compactness of 3D spheroids. Then, we show that the spheroids develop accumulations of fat and collagen upon exposure to free fatty acids. Finally, this accumulation was rescued by incubating spheroids with liraglutide or elafibranor, drugs that are in clinical trials for the treatment of NASH. In conclusion, we have established a simple, easy to handle, in vitro model of genetically induced NAFLD consisting of multilineage 3D spheroids. This tool may be used to understand molecular mechanisms involved in the early stages of fibrogenesis induced by lipid accumulation. Moreover, it may be used to identify new compounds to treat NASH using high-throughput drug screening.

Keywords: NAFLD; NASH; PNPLA3; elafibranor; fatty acids; fibrosis; liraglutide; obeticholic acid; organoids; vitamin E.


Conflict of interest statement

S.R. has been consulting for AstraZeneca, GSK, Celgene Corporation, and Pfizer in the last 5 years and received the research grant from AstraZeneca. D.L. and S.P. are employees at AstraZeneca. All other authors have none to declare. The funders had no role in the design of the study; in the collection, analyses, or interpretation of data; in the writing of the manuscript, or in the decision to publish the results.

Figures

Figure 1
Figure 1
Co-culture of HepG2 and LX-2 cells enhances the compactness of 3D spheroids. (A) HepG2 cells, which formed loosely aggregated spheroids alone, were co-cultured as multilineage spheroids with LX-2 cells (forming round-shape spheroids quickly) at a 1:1 and 24:1 ratio for 24, 48, 72 and 96 h. Scale bars in bright-field pictures are 100 μm. (B) Spheroid volume was calculated measuring their long and short diameter by ZEN 2.3 Lite software (Zeiss) (n = 4). (C) Cellular ATP levels normalized to spheroids volumes remained stable throughout 4 days of culture (n = 3). (D) Apolipoprotein B (APOB) secretion levels in the media fractions measured by Western blotting are proportioned to the percentage of hepatocytes present in the spheroids (n = 5). Bars represent mean ± SD. P-values were calculated by Mann-Whitney non-parametric test, (* p < 0.05 vs. HepG2). APOB: Apolipoprotein B; AU: arbitrary unit.
Figure 2
Figure 2
Treatments of organoid with fatty acids do not change organoid volume and viability but enhance APOB secretion. (A) 3D spheroids HepG2/LX-2 ratio 24:1 were treated, after 48 h from the seeding with: BSA 1%, a mix of palmitic acid and oleic acid 500 μM (1:2), TGF-β 10 ng/mL or PDGF 10 ng/mL for 24 or 48 h. (B) Spheroid volumes were calculated measuring their long and short diameter by ZEN 2.3 Lite software (Zeiss) (n = 3). (C) Cellular ATP levels normalized to spheroids volumes remained stable throughout 4 days of culture (n = 3). (D) APOB secretion levels in the media fractions measured by Western blotting were higher in spheroids treated with PAOA while they were lower in spheroids treated with TGF-β (n = 7). Bars represent mean ± SD. P-value was calculated by Mann-Whitney non-parametric test, (* p < 0.05 vs. BSA 1%). BSA: bovine serum albumin; PAOA: palmitic acid/oleic acid; TGF-β: Transforming growth factor-β; PDGF: Platelet-derived growth factor; APOB: Apolipoprotein B; AU: arbitrary unit.
Figure 3
Figure 3
Treatment with fatty acids (PAOA) increases neutral fat content in 3D multilineage spheroids. (A) Intracellular neutral lipid content visualized by ORO staining in sections (8 μm) of 3D spheroids HepG2/LX-2 ratio 24:1 treated, after 48 h from the seeding with BSA 1%, a mix of palmitic acid and oleic acid (PAOA) 500 μM (1:2), TGF-β 10 ng/mL or PDGF 10 ng/mL for 48 h. Cell nuclei were stained with hematoxylin. Objective: 40×. (B) Quantification of intracellular ORO-stained area quantified by BioPix software (n = 5). (C) Intracellular lipid content measured by AdipoRed assay kit (Lonza). Bars represent mean ± SD (n = 6). P-value was calculated by Mann-Whitney non-parametric test, (** p < 0.005 vs. BSA 1%). BSA: bovine serum albumin; PAOA: palmitic acid/oleic acid; TGF-β: Transforming growth factor β; PDGF: Platelet-derived growth factor, ORO: oil red O staining.
Figure 4
Figure 4
Fatty acid treatment results in an increase in COL1A1 levels in 3D multilineage spheroids. (A) Immunofluorescence staining of DAPI (blue), COL1A1 (red) and merged images of 3D spheroids (HepG2/LX-2, 24:1) treated, after 48 h from the seeding, with BSA 1% (negative control), a mix of palmitic acid and oleic acid 500 μM (1:2), TGF-β 10 ng/mL or PDGF 10 ng/mL for 48 h. All the media for treatments were supplemented with BSA 1%. Objective: 40×. (B) Quantification of COL1A1 levels by ImageJ normalized to number of nuclei. Bars represent mean ± SD (n = 6). P-value was calculated by Mann Whitney non-parametric test, (** p < 0.005 vs. BSA 1%). BSA: bovine serum albumin; PAOA: palmitic acid/oleic acid; TGF-β: Transforming growth factor β; PDGF: Platelet-derived growth factor. COL1A1: collagen type I alpha 1.
Figure 5
Figure 5
Incubation of 3D multilineage spheroids with liraglutide or elafibranor results in a reduction of intra-spheroid fat content. Prevention of steatosis by co-treatment with (A) Liraglutide (1, 10 and 20 μM), (B) Elafibranor (10, 25, 50 μM), (C) vitamin E (10, 25, 50 μM) or (D) obeticholic acid (10, 25, 50 μM) for 48 h in the presence of 500 μM free fatty acids (PAOA) bound to BSA 1%. On the left panels, lipid levels were quantified using AdipoRed biochemical quantification assay. On the right panels cellular ATP levels, normalized to spheroids volumes, remained stable throughout 48 h of treatment (n = 3). Bars represent mean ± SD. P-value was calculated by Mann-Whitney non-parametric test, (* p < 0.05 vs. PAOA 500 μM; # p < 0.005 vs. BSA 1%). BSA: bovine serum albumin; PAOA: palmitic acid/oleic acid.
Figure 6
Figure 6
COL1A1 levels decrease in 3D multilineage spheroids treated with liraglutide or elafibranor. (A) Immunofluorescence staining of DAPI (blue), COL1A1 (red), and merged images of 3D spheroids (HepG2/LX-2, 24:1) treated, after 48 h from the seeding, with a mix of palmitic acid and oleic acid 500 μM (1:2) bound to BSA 1%, with and without liraglutide 20 μM, elafibranor 50 μM, vitamin E 50 μM or obeticholic acid 50 μM for 48 h. Objective: 40×. (B) Quantification of COL1A1 levels by ImageJ normalized to number of nuclei. Bars represent mean ± SD (n = 4). P-value was calculated by Mann Whitney test non-parametric test, (* p < 0.05 vs. PAOA 500 μM). PAOA: palmitic acid/oleic acid; COL1A1: collagen type I alpha 1.

References

    1. Blachier M., Leleu H., Peck-Radosavljevic M., Valla D.C., Roudot-Thoraval F. The burden of liver disease in Europe: A review of available epidemiological data. J. Hepatol. 2013;58:593–608. doi: 10.1016/j.jhep.2012.12.005. - DOI - PubMed
    1. Younossi Z.M., Koenig A.B., Abdelatif D., Fazel Y., Henry L., Wymer M. Global epidemiology of nonalcoholic fatty liver disease-Meta-analytic assessment of prevalence, incidence, and outcomes. Hepatology. 2016;64:73–84. doi: 10.1002/hep.28431. - DOI - PubMed
    1. Brunt E.M., Wong V.W., Nobili V., Day C.P., Sookoian S., Maher J.J., Bugianesi E., Sirlin C.B., Neuschwander-Tetri B.A., Rinella M.E. Nonalcoholic fatty liver disease. Nat. Rev. Dis. Primers. 2015;1:15080. doi: 10.1038/nrdp.2015.80. - DOI - PubMed
    1. Kleiner D.E., Brunt E.M., Van Natta M., Behling C., Contos M.J., Cummings O.W., Ferrell L.D., Liu Y.C., Torbenson M.S., Unalp-Arida A., et al. Design and validation of a histological scoring system for nonalcoholic fatty liver disease. Hepatology. 2005;41:1313–1321. doi: 10.1002/hep.20701. - DOI - PubMed
    1. Kozyra M., Johansson I., Nordling Å., Ullah S., Lauschke V.M., Ingelman-Sundberg M. Human hepatic 3D spheroids as a model for steatosis and insulin resistance. Sci. Rep. 2018;8:14297. doi: 10.1038/s41598-018-32722-6. - DOI - PMC - PubMed