. 2019 Apr 2;20(7):1630.
doi: 10.3390/ijms20071630.

Characterization of Microbiota Associated with Digesta and Mucosa in Different Regions of Gastrointestinal Tract of Nursery Pigs

Affiliations

Characterization of Microbiota Associated with Digesta and Mucosa in Different Regions of Gastrointestinal Tract of Nursery Pigs

Bishnu Adhikari et al. Int J Mol Sci. .

Abstract

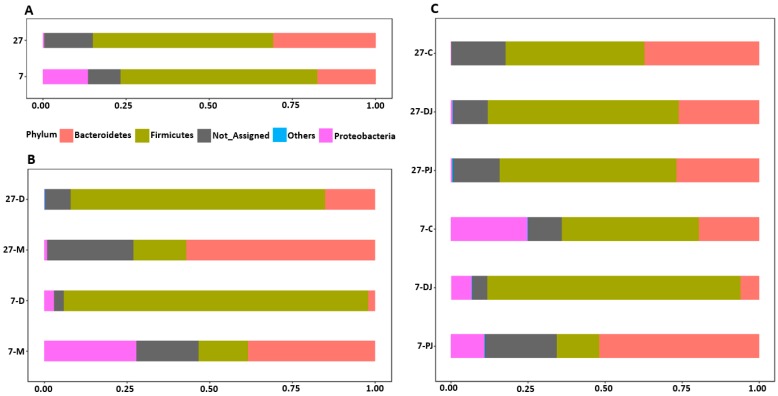
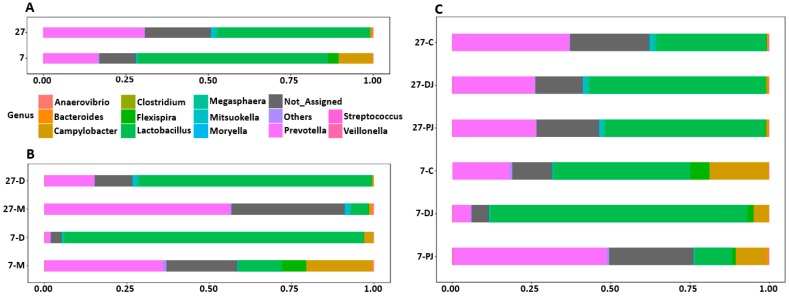
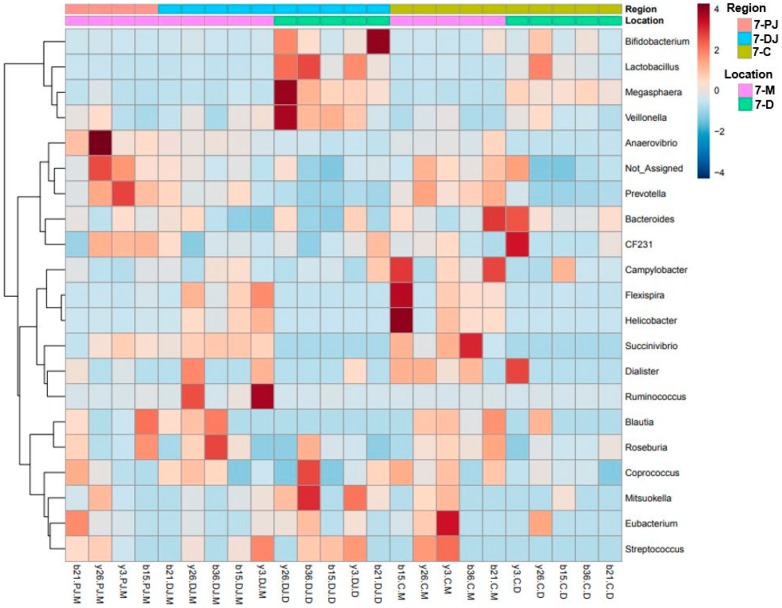
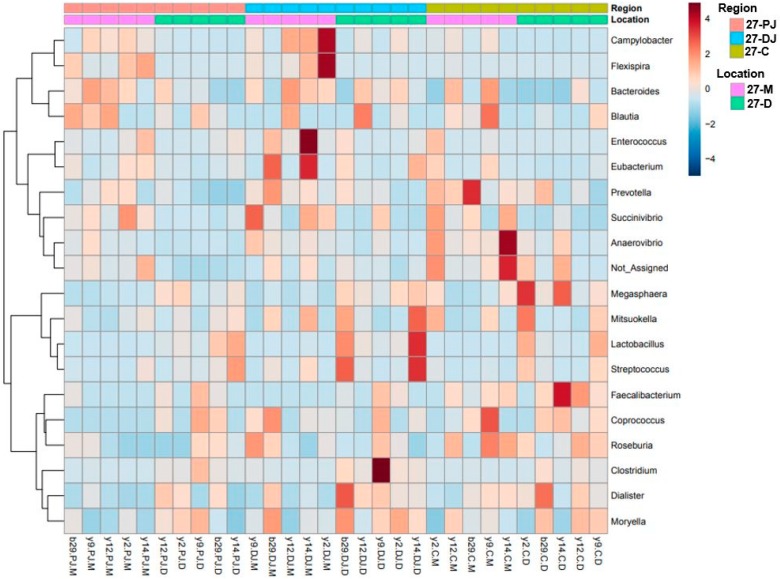
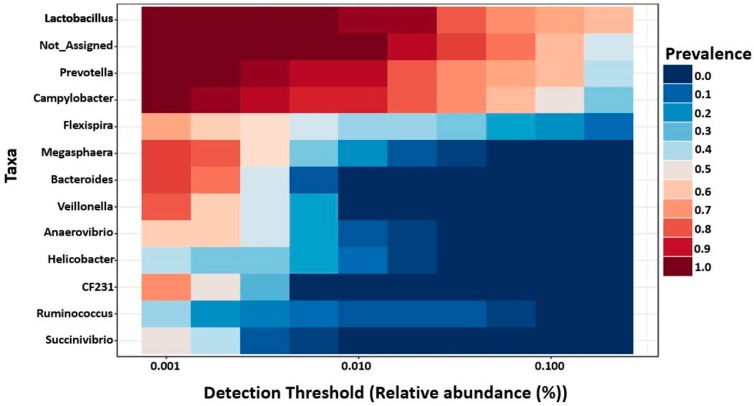
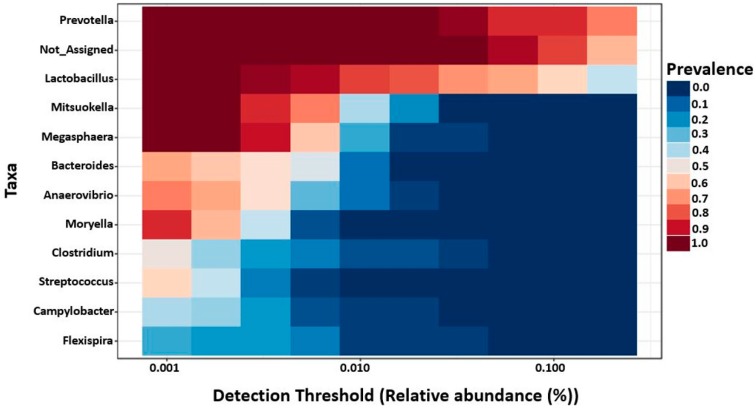
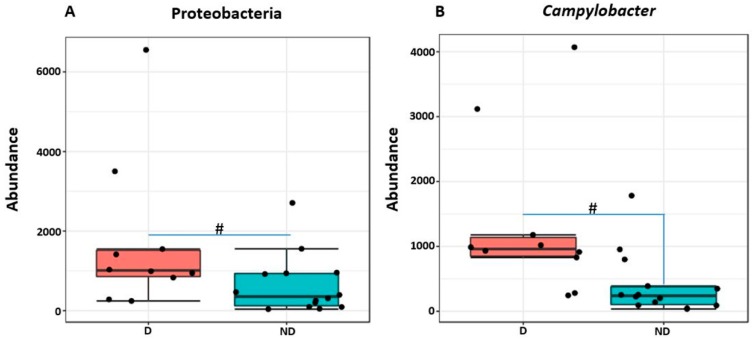
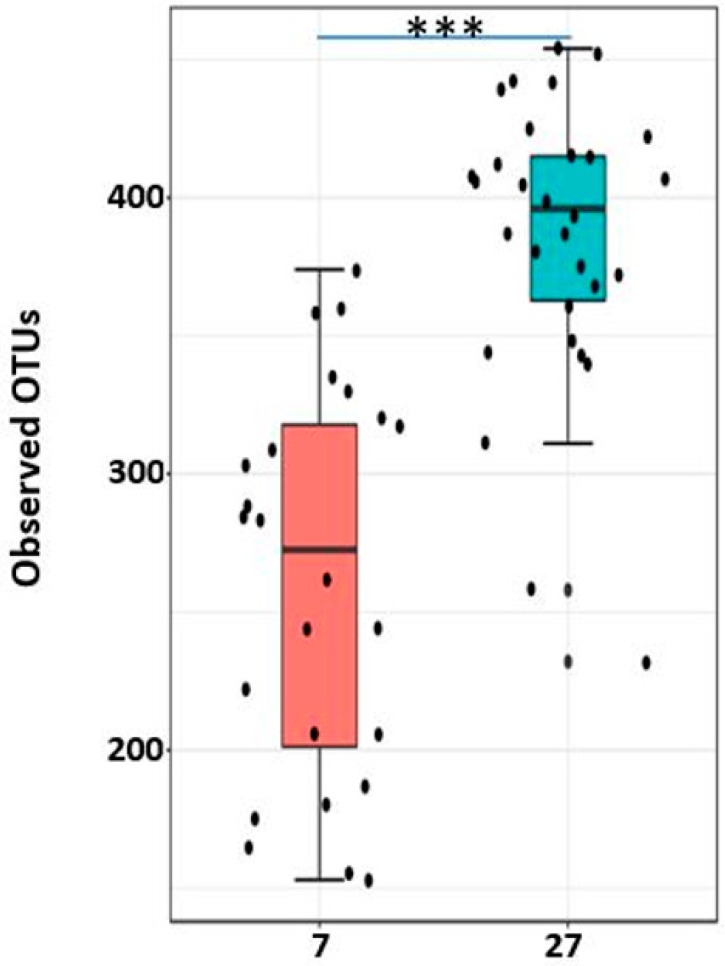
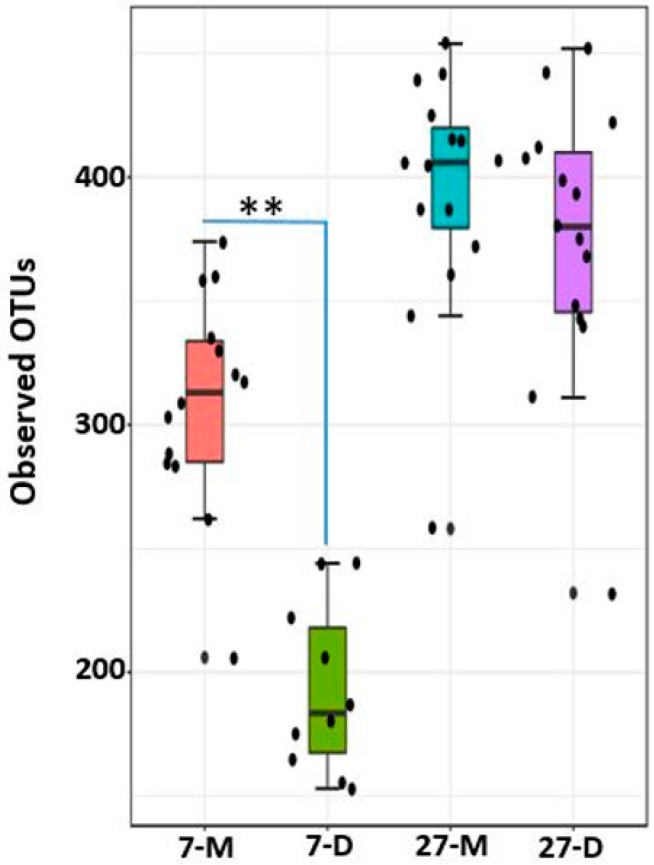
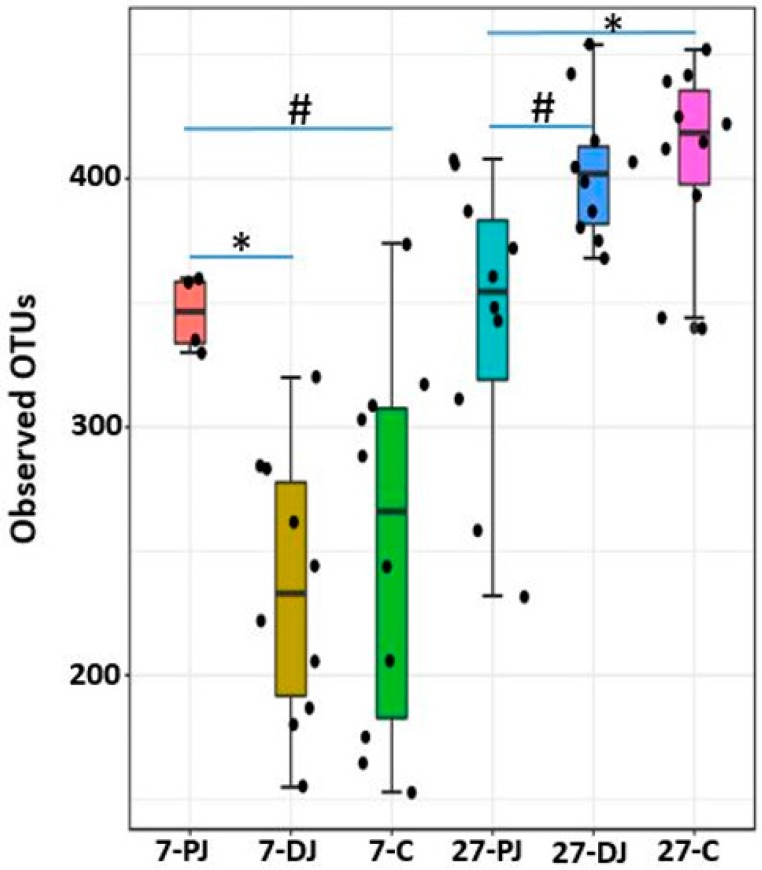
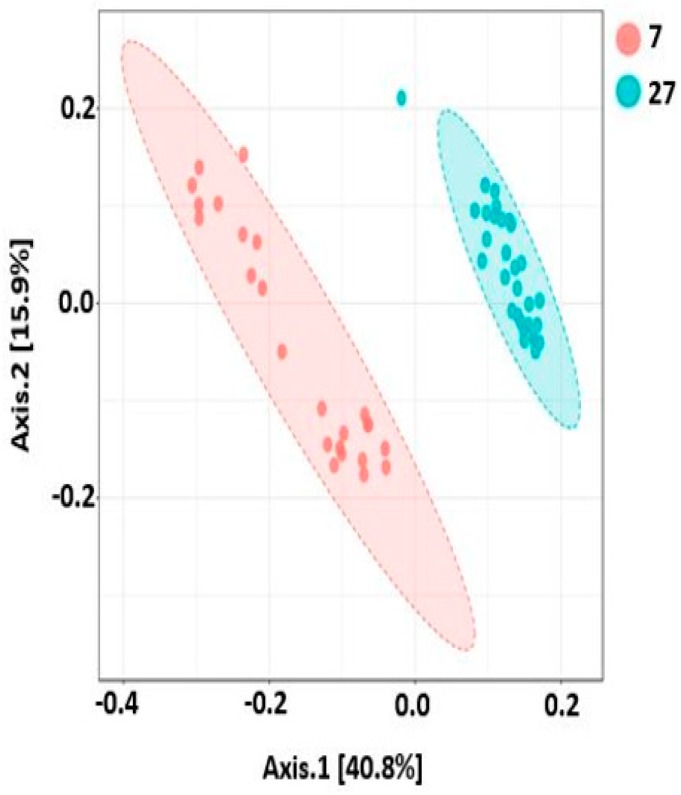
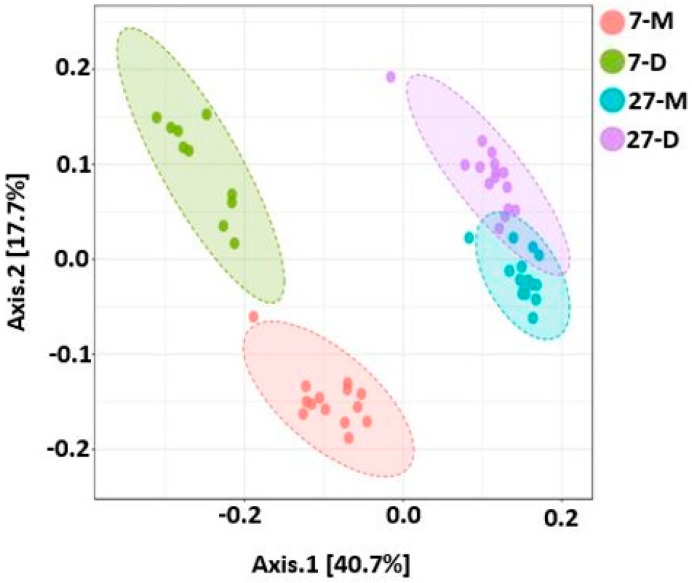
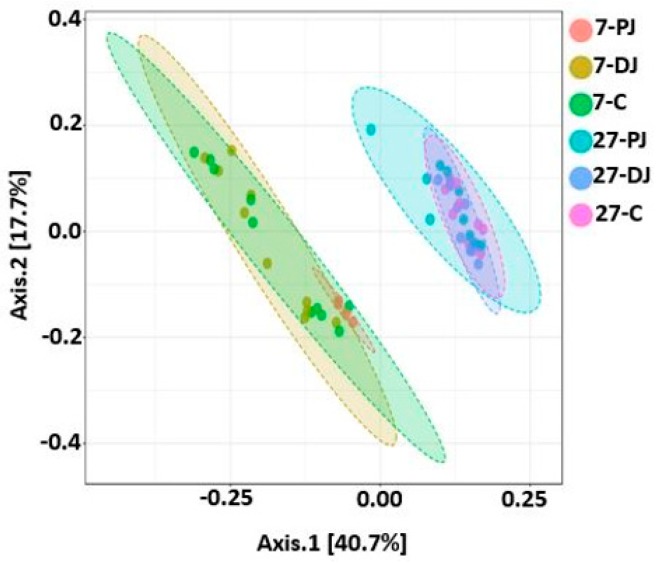
Weaning is a crucial period when piglets have to cope with sudden dietary, social, and environmental stressors that often lead to serious intestinal dysbiosis and mortality. In this study, five mucosal and five digesta samples from each proximate jejunum, distal jejunum, and mid-colon were collected from 7- and 27-day post-weaned pigs and subjected to microbiota analysis using 16S rRNA gene profiling. Taxonomic analysis at phylum level revealed that Proteobacteria was significantly higher at 7 days (13.54%), while Bacteriodetes was higher at 27 days (30.72%) post weaning. Genera such as Campylobacter, Veillonella, Helicobacter, and Blautia that were previously reported in intestinal dysbiosis were significantly enriched in seven-day post-weaned pigs. However, microbial communities shifted as post weaning age increased with a significant increase in alpha diversity, and genera such as Moryella, Dialister, Clostridium, Streptococcus, Prevotella, and Bacteroides become significantly abundant in 27-day post-weaned pigs. Interestingly, the genus Campylobacter was significantly abundant on seven-day post-weaning in two piglets with diarrhea, implicating its role in post-weaning diarrhea. The results of this study suggest that gut microbiota in pigs with dysbiosis on 7-day post weaning undergoes significant changes toward a more normal state as the post-weaning age reaches 27 days.

Keywords: diarrhea; dysbiosis; gut microbiota; pig; post-weaning stress.


Conflict of interest statement

The authors declare no conflict of interest.

Figures

Figure 1
Figure 1
Relative abundance of different phyla at post weaning ages (A), different locations (B), and different regions of gastrointestinal tract (GIT) (C). The 7 and 27 represent 7 and 27 days, respectively, after weaning; M and D represent mucosa and digesta samples, respectively; PJ, DJ, and C represent proximate jejunum, distal jejunum, and mid-colon, respectively. Not_Assigned represents the sequence reads that were not assigned at the phylum level whereas Others represents the bacterial phyla whose counts were lower than 500.
Figure 2
Figure 2
Relative abundance of different genera at post-weaning ages (A), different locations (B), and different regions of GIT (C). The 7 and 27 represent 7 and 27 days, respectively, after weaning; M and D represent mucosa and digesta samples, respectively; PJ, DJ, and C represent proximate jejunum, distal jejunum, and mid-colon, respectively. Not_Assigned represents the sequence reads that were not assigned at the genus level but assigned at the higher taxonomic level, whereas Others represents the bacterial phyla whose counts were lower than 500.
Figure 3
Figure 3
Hierarchical clustering heat map of bacterial genera from 7-day post-weaned pigs generated by MicrobiomeAnalyst using Euclidean distance measure and Ward clustering algorithm. The 7 represents 7 days post weaning; M and D represent mucosa and digesta samples, respectively; PJ, DJ, and C represent proximate jejunum, distal jejunum, and mid-colon, respectively. Not_Assigned represents the sequence reads that were not assigned at the genus level but assigned at the higher taxonomic level.
Figure 4
Figure 4
Hierarchical clustering heat map of bacterial genera from 27-day post-weaned pigs generated by MicrobiomeAnalyst using Euclidean distance measure and Ward clustering algorithm. The 27 represent 27 days post weaning; M and D represent mucosa and digesta samples, respectively; PJ, DJ, and C represent proximate jejunum, distal jejunum, and mid-colon, respectively. Not_Assigned represents the sequence reads that were not assigned at the genus level but assigned at the higher taxonomic level.
Figure 5
Figure 5
Core bacterial genera in 7-day post-weaned pigs as identified by MicrobiomeAnalyst using the parameters sample prevalence (20%) and relative abundance (0.2%). Not_Assigned represents the sequence reads that were not assigned at the genus level but assigned at the higher taxonomic level.
Figure 6
Figure 6
The core bacterial genera in 27-day post-weaned pigs as identified by MicrobiomeAnalyst using the parameters sample prevalence (20%) and relative abundance (0.2%). Not_Assigned represents the sequence reads that were not assigned at the genus level but assigned at the higher taxonomic level.
Figure 7
Figure 7
Abundance of Proteobacteria (A) and Campylobacter (B) in piglets with and without diarrhea. D and ND represent piglets with and without diarrhea, respectively. # represents significant difference between two groups at p < 0.05. Both Proteobacteria and Campylobacter were significantly increased in piglets with diarrhea as compared to healthy ones.
Figure 8
Figure 8
Alpha diversity between two post-weaning ages as measured by Observed_OTUS metric. *** represents significant difference between two groups at p < 0.0001. The 7 and 27 represent 7 and 27 days, respectively, after weaning. Increase in post-weaning age resulted an increase in alpha diversity.
Figure 9
Figure 9
Alpha diversity between two different locations at two different post-weaning ages as measured by Observed_OTUS metric. ** represents significant difference between two groups at p < 0.001. The 7 and 27 represent 7 and 27 days, respectively, after weaning; M and D represent mucosa and digesta samples, respectively.
Figure 10
Figure 10
Alpha diversity between three different regions of GIT at two different post-weaning ages as measured by Observed_OTUS metric. #, * represent significant difference between two groups at p < 0.05 and p < 0.01, respectively. The 7 and 27 represent 7 and 27 days, respectively, after weaning; M and D represent mucosa and digesta samples, respectively; PJ, DJ, and C represent proximate jejunum, distal jejunum, and mid-colon, respectively.
Figure 11
Figure 11
PCoA plot showing significant difference in bacterial community structure among piglets of two post weaning ages (ANOSIM; R = 0.76 and p < 0.001). Unweighted UniFrac distance metric was used to create PCoA plot. 7 and 27 represent 7 and 27 days respectively after weaning.
Figure 12
Figure 12
PCoA plot showing significant difference in bacterial community structure in different locations of GIT at two post-weaning ages of piglets (ANOSIM: R = 0.78, p < 0.001 for all four groups; R = 0.86, p < 0.001 for 7 days; R = 0.38, p < 0.001 for 27 days). Unweighted UniFrac distance metric was used to create PCoA plot. The 7 and 27 represent 7 and 27 days, respectively, after weaning; M and D represent mucosa and digesta samples, respectively.
Figure 13
Figure 13
PCoA plot showing significant difference in bacterial community structure in three different regions of GIT at two post-weaning ages of piglets (ANOSIM: R = 0.45, p < 0.001). Unweighted UniFrac distance metric was used to create PCoA plot. The 7 and 27 represent 7 and 27 days, respectively, after weaning; M and D represent mucosa and digesta samples, respectively; PJ, DJ, and C represent proximate jejunum, distal jejunum, and mid-colon, respectively.

References

    1. Looft T., Allen H.K., Cantarel B.L., Levine U.Y., Bayles D.O., Alt D.P., Henrissat B., Stanton T.B. Bacteria, phages and pigs: The effects of in-feed antibiotics on the microbiome at different gut locations. ISME J. 2014;8:1566–1576. doi: 10.1038/ismej.2014.12. - DOI - PMC - PubMed
    1. Adhikari B., Kwon Y.M. Characterization of the culturable subpopulations of lactobacillus in the chicken intestinal tract as a resource for probiotic development. Front. Microbiol. 2017;8:1389. doi: 10.3389/fmicb.2017.01389. - DOI - PMC - PubMed
    1. Morissette B., Talbot G., Beaulieu C., Lessard M. Growth performance of piglets during the first two weeks of lactation affects the development of the intestinal microbiota. J. Anim. Physiol. Anim Nutr. 2018;102:525–532. doi: 10.1111/jpn.12784. - DOI - PubMed
    1. Looft T., Johnson T.A., Allen H.K., Bayles D.O., Alt D.P., Stedtfeld R.D., Sul W.J., Stedtfeld T.M., Chai B., Hashsham S.A., et al. In-feed antibiotic effects on the swine intestinal microbiome. Proc. Natl. Acad. Sci. USA. 2012;109:1691–1696. doi: 10.1073/pnas.1120238109. - DOI - PMC - PubMed
    1. Frese S.A., Parker K., Calvert C.C., Mills D.A. Diet shapes the gut microbiome of pigs during nursing and weaning. Microbiome. 2015;3:28. doi: 10.1186/s40168-015-0091-8. - DOI - PMC - PubMed

LinkOut - more resources