. 2019 Apr 2;20(7):1631.
doi: 10.3390/ijms20071631.

PD-L1 Expression in Systemic Immune Cell Populations as a Potential Predictive Biomarker of Responses to PD-L1/PD-1 Blockade Therapy in Lung Cancer

Affiliations

PD-L1 Expression in Systemic Immune Cell Populations as a Potential Predictive Biomarker of Responses to PD-L1/PD-1 Blockade Therapy in Lung Cancer

Ana Bocanegra et al. Int J Mol Sci. .

Abstract

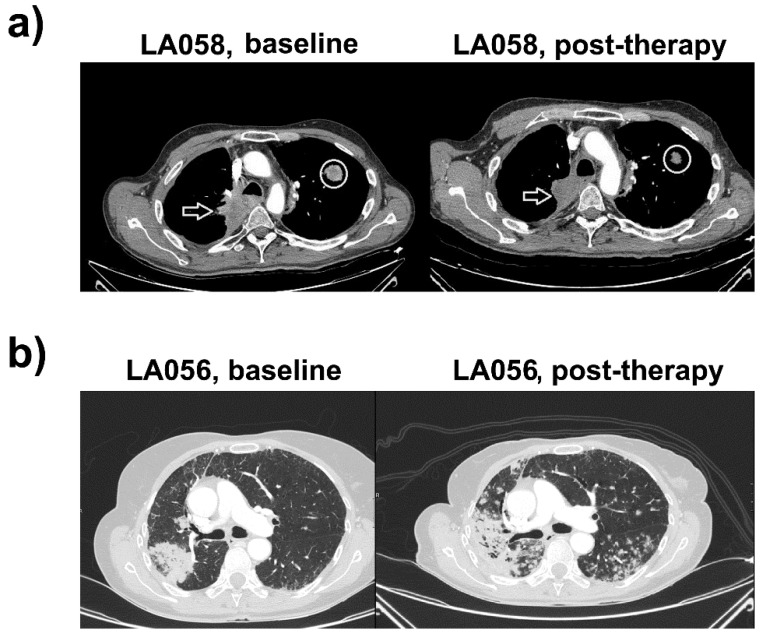
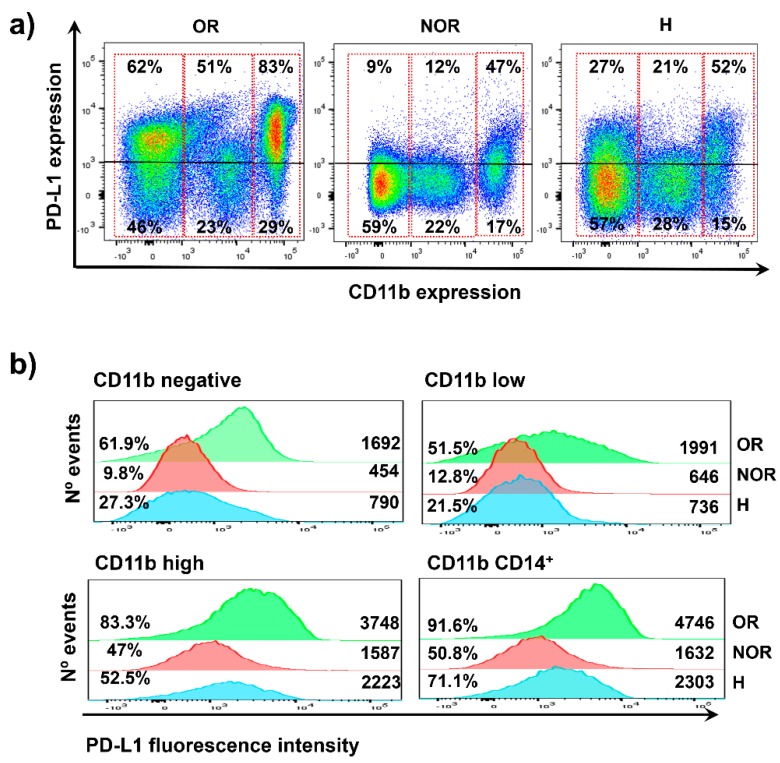
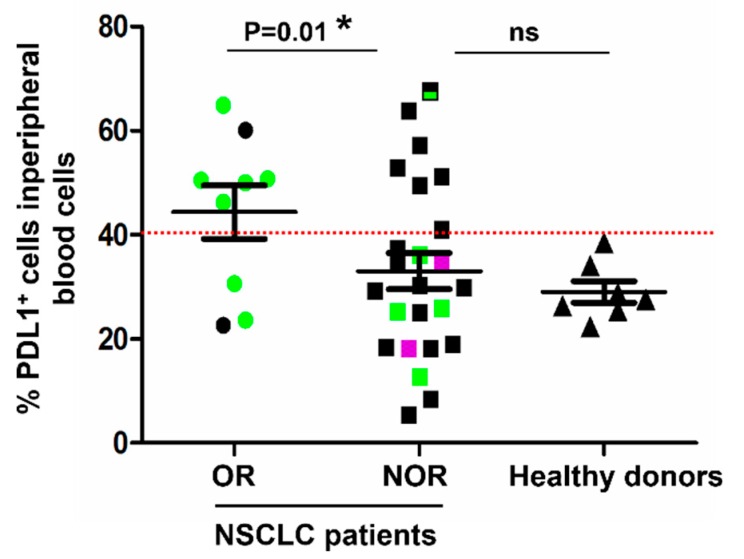
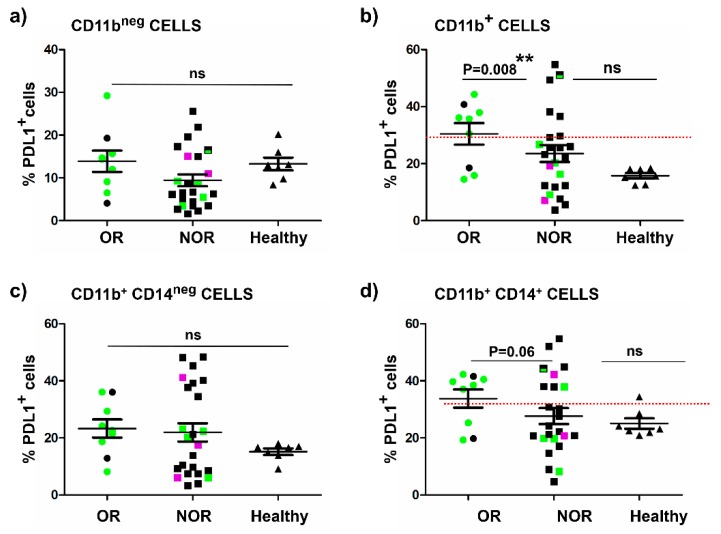
PD-L1 tumor expression is a widely used biomarker for patient stratification in PD-L1/PD-1 blockade anticancer therapies, particularly for lung cancer. However, the reliability of this marker is still under debate. Moreover, PD-L1 is widely expressed by many immune cell types, and little is known on the relevance of systemic PD-L1⁺ cells for responses to immune checkpoint blockade. We present two clinical cases of patients with non-small cell lung cancer (NSCLC) and PD-L1-negative tumors treated with atezolizumab that showed either objective responses or progression. These patients showed major differences in the distribution of PD-L1 expression within systemic immune cells. Based on these results, an exploratory study was carried out with 32 cases of NSCLC patients undergoing PD-L1/PD-1 blockade therapies, to compare PD-L1 expression profiles and their relationships with clinical outcomes. Significant differences in the percentage of PD-L1⁺ CD11b⁺ myeloid cell populations were found between objective responders and non-responders. Patients with percentages of PD-L1⁺ CD11b⁺ cells above 30% before the start of immunotherapy showed response rates of 50%, and 70% when combined with memory CD4 T cell profiling. These findings indicate that quantification of systemic PD-L1⁺ myeloid cell subsets could provide a simple biomarker for patient stratification, even if biopsies are scored as PD-L1 null.

Keywords: PD-L1; biomarker; immune checkpoint blockade; immunotherapy; lung cancer.


Conflict of interest statement

The authors declare no conflict of interest.

Figures

Figure 1
Figure 1
Clinical responses for tumor PD-L1-negative patients LA058 and LA056 treated with atezolizumab. (a) Left, CT images of LA058 before the start of immunotherapy. Right, CT images of LA058 after atezolizumab, demonstrating objective clinical responses, with evident tumor shrinkage. Arrows indicate a paravertebral upper right lobe mass with mediastinal invasion and posterolateral wall of the trachea. The circle indicates a contralateral metastatic node in the upper left lobe. Both lesions show a marked morphological decrease compatible with a partial response. (b) Left, CT evaluation of the LA056 patient. A tumoral relapse in the site of previous surgical intervention is evident. Right, CT following atezolizumab treatment. Tumor progression with bilateral pulmonary nodes and increase of the lower right lobe (LRL) mass, consistent with fast progressive disease.
Figure 2
Figure 2
PD-L1 expression within systemically circulating immune cells in patients LA058 and LA056. (a) Flow cytometry density plots of PD-L1 expression in systemic immune cells for the objective responder patient LA058 (OR, left); for the progressor patient LA056 (non-objective responder, NOR, center); and for an age-matched healthy donor (H) as a control. (b) Flow cytometry histograms representing PD-L1 expression levels in systemic immune cells from the indicated subjects (OR, NOR, and H denote objective responder, non-objective responder, and healthy donor, respectively). The percentage of PD-L1 positive cells and mean fluorescent intensities are indicated within the graphs.
Figure 3
Figure 3
Quantification of PD-L1+ cell subsets in systemic immune cells and correlation with clinical responses. Dot plot graph representing the percentage of PD-L1+ cells within total systemic immune cells quantified from fresh peripheral blood samples before the start of immunotherapies, in objective responders (OR, N = 9), non-responders (NOR, N = 24), and healthy donors (N = 7). Relevant statistical comparisons are shown within the graph, by the exact test of Fisher. In green, patients with >40% circulating memory CD4 T cells. In purple, patients with stable disease. In black, patients with <40% circulating memory CD4 T cells. The dotted red line indicates the cut-off value used to test the association of the percentage of PD-L1+ T cells with clinical responses.
Figure 4
Figure 4
Quantification of PD-L1+ cell subsets in different compartments of immune cell types in peripheral blood and correlation with clinical responses. (a) Dot plot graph representing the percentage of PD-L1+ cells within systemic CD11bnegative subsets quantified from fresh peripheral blood samples before the start of immunotherapies, in objective responders (OR, N = 9), non-responders (NOR, N = 24), and healthy donors (N = 7). (b) Within CD11b+ cell subsets. (c) Within CD11b+ CD14negative subsets. (d) Within CD11b+ CD14+ subsets. Relevant statistical comparisons are indicated within each graph, by the Fisher’s exact test, considering as cut-off values the indicated with horizontal red dotted lines. Means ± standard deviations are shown within the dot plots. Green, patients with >40% of systemic memory CD4 T cells; Black, patients with <40% of systemic memory CD4 T cells; Violet, patients with stable disease.

References

    1. Ferlay J., Colombet M., Soerjomataram I., Dyba T., Randi G., Bettio M., Gavin A., Visser O., Bray F. Cancer incidence and mortality patterns in Europe: Estimates for 40 countries and 25 major cancers in 2018. Eur. J. Cancer. 2018;103:356–387. doi: 10.1016/j.ejca.2018.07.005. - DOI - PubMed
    1. Escors D., Gato-Canas M., Zuazo M., Arasanz H., Garcia-Granda M.J., Vera R., Kochan G. The intracellular signalosome of PD-L1 in cancer cells. Signal Transduct. Target. Ther. 2018;3:26. doi: 10.1038/s41392-018-0022-9. - DOI - PMC - PubMed
    1. Karwacz K., Bricogne C., Macdonald D., Arce F., Bennett C.L., Collins M., Escors D. PD-L1 co-stimulation contributes to ligand-induced T cell receptor down-modulation on CD8(+) T cells. EMBO Mol. Med. 2011;3:581–592. doi: 10.1002/emmm.201100165. - DOI - PMC - PubMed
    1. Gato-Canas M., Zuazo M., Arasanz H., Ibanez-Vea M., Lorenzo L., Fernandez-Hinojal G., Vera R., Smerdou C., Martisova E., Arozarena I., et al. PDL1 Signals through Conserved Sequence Motifs to Overcome Interferon-Mediated Cytotoxicity. Cell Rep. 2017;20:1818–1829. doi: 10.1016/j.celrep.2017.07.075. - DOI - PubMed
    1. Herbst R.S., Baas P., Kim D.W., Felip E., Perez-Gracia J.L., Han J.Y., Molina J., Kim J.H., Arvis C.D., Ahn M.J., et al. Pembrolizumab versus docetaxel for previously treated, PD-L1-positive, advanced non-small-cell lung cancer (KEYNOTE-010): A randomised controlled trial. Lancet. 2016;387:1540–1550. doi: 10.1016/S0140-6736(15)01281-7. - DOI - PubMed

MeSH terms