. 2019 Jun 3;216(6):1328-1344.
doi: 10.1084/jem.20182002. Epub 2019 Apr 15.

T cell anergy in perinatal mice is promoted by T reg cells and prevented by IL-33

Affiliations

T cell anergy in perinatal mice is promoted by T reg cells and prevented by IL-33

Jonatan Tuncel et al. J Exp Med. .

Abstract

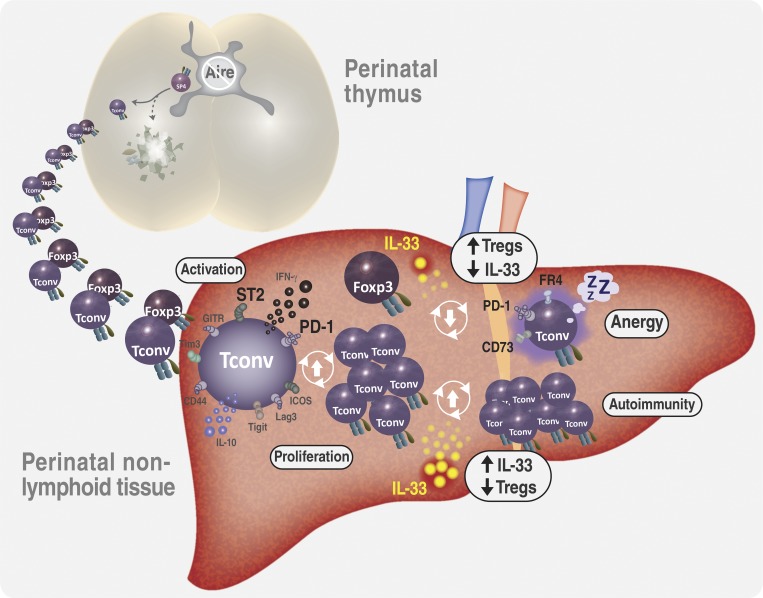
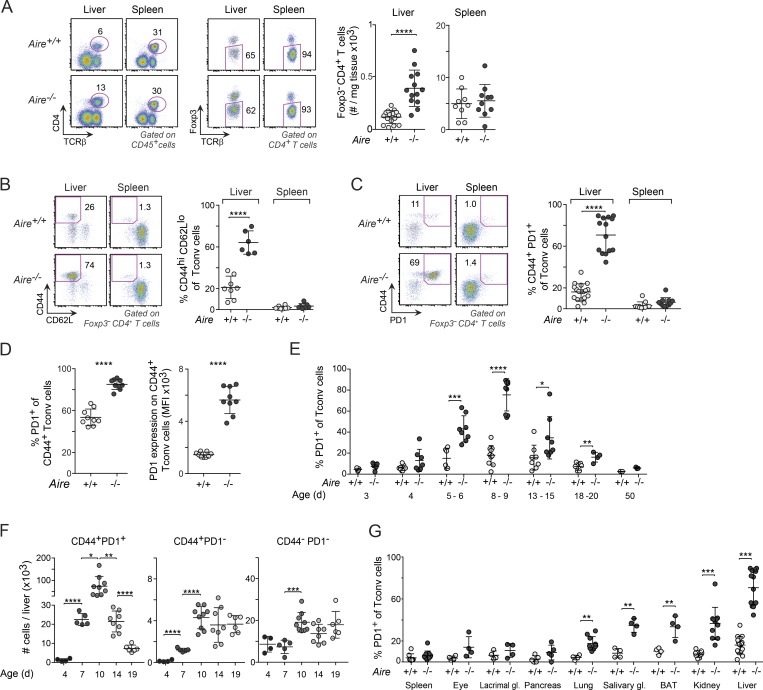
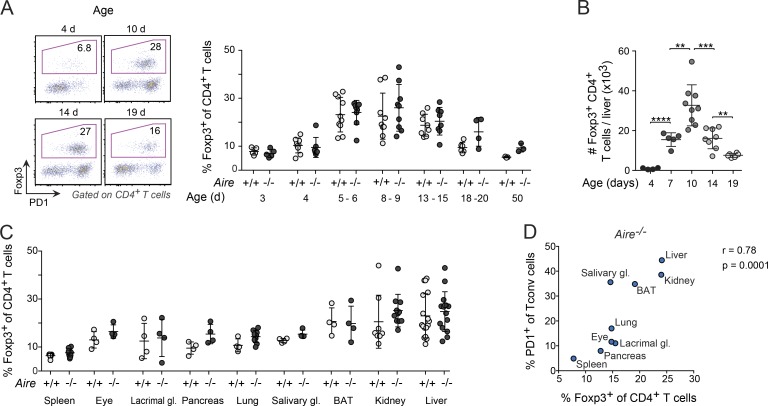
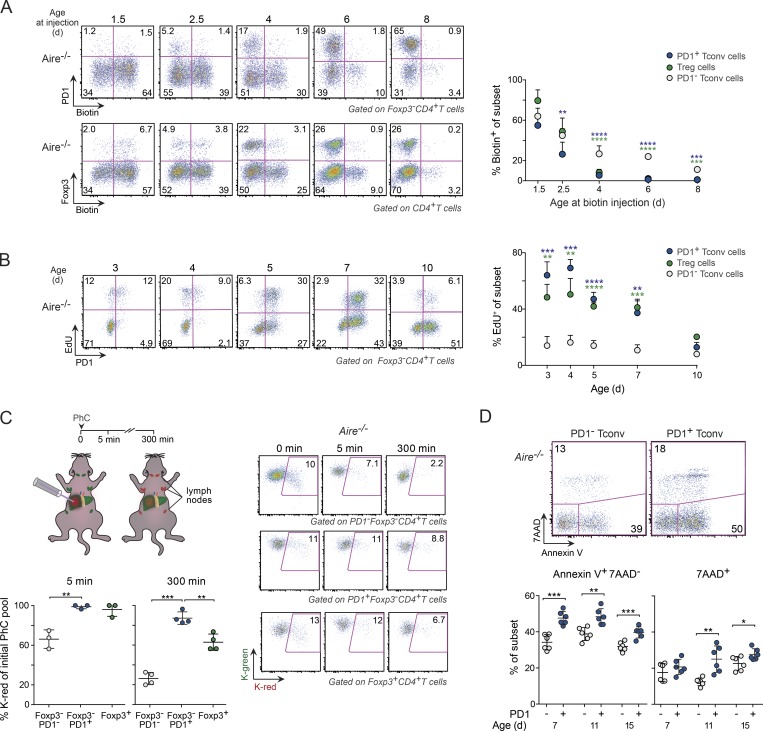
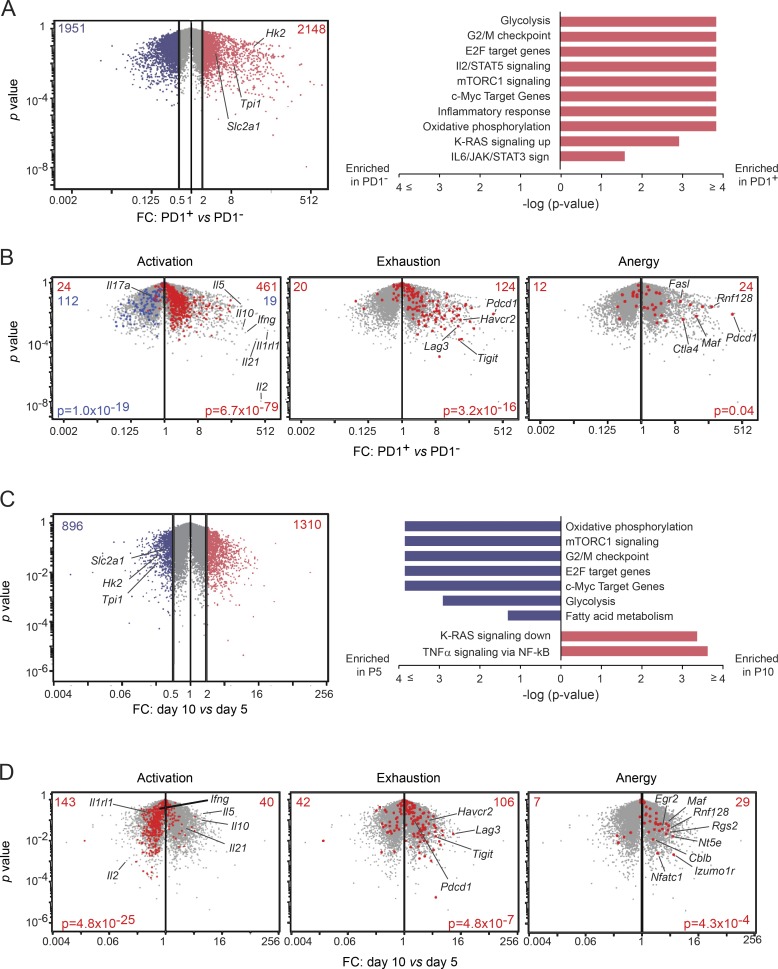
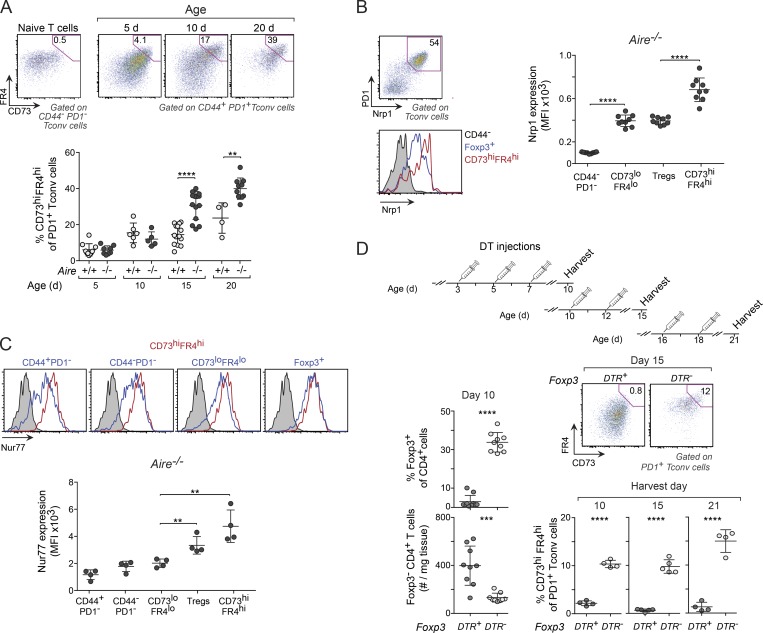
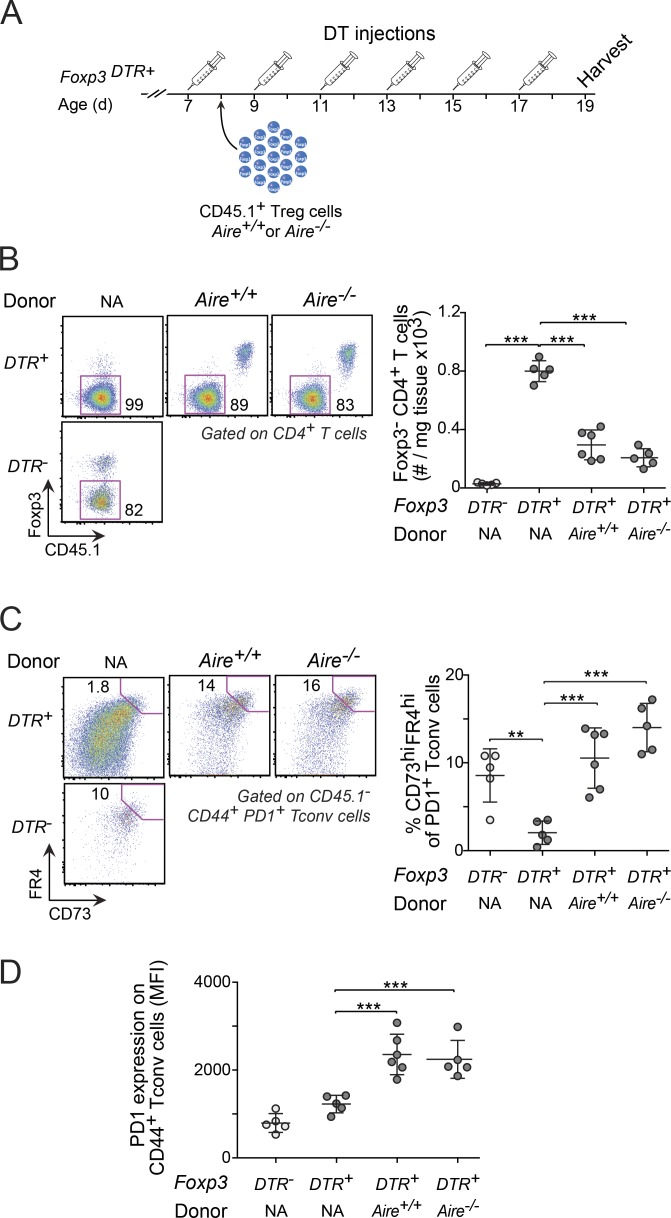
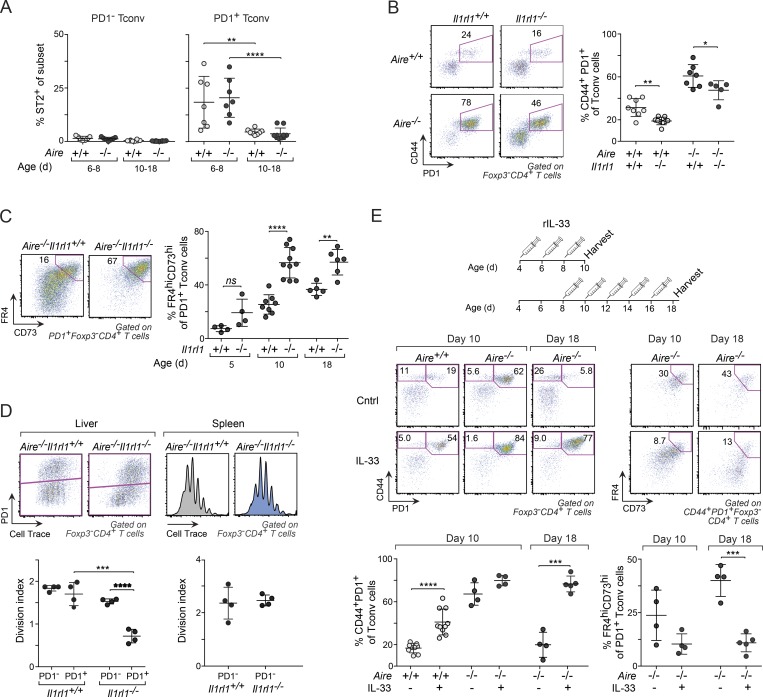
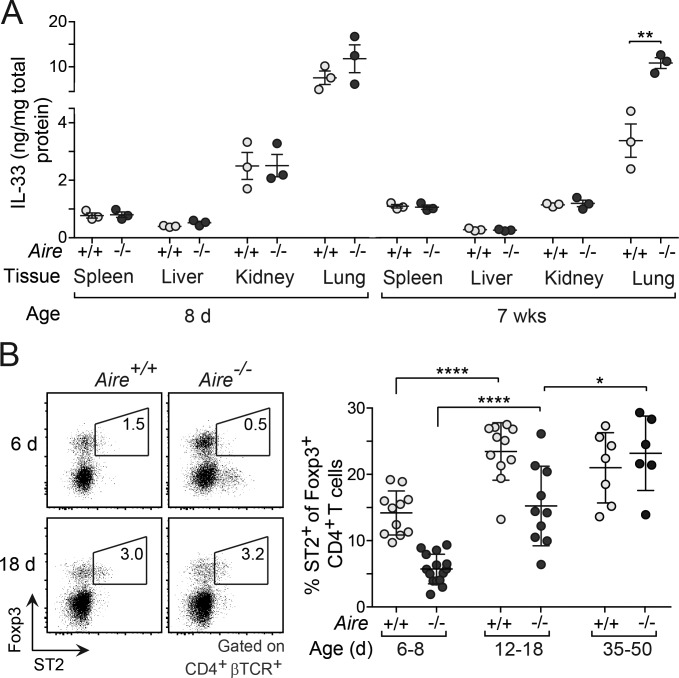
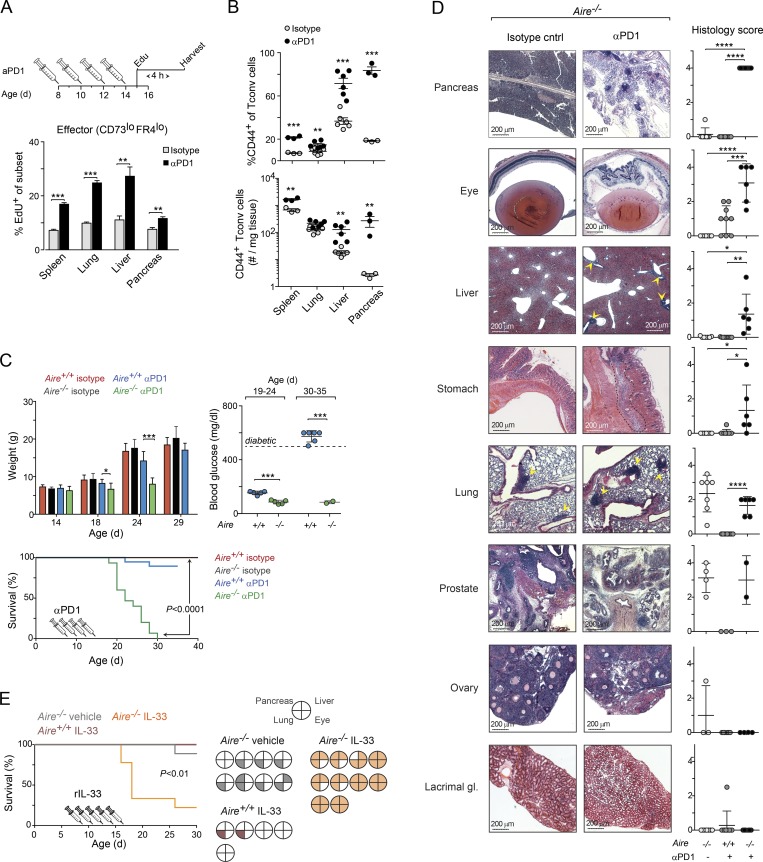
Perinatal T cells broadly access nonlymphoid tissues, where they are exposed to sessile tissue antigens. To probe the outcome of such encounters, we examined the defective elimination of self-reactive clones in Aire-deficient mice. Nonlymphoid tissues were sequentially seeded by distinct waves of CD4+ T cells. Early arrivers were mostly Foxp3+ regulatory T (T reg) cells and metabolically active, highly proliferative conventional T cells (T conv cells). T conv cells had unusually high expression of PD-1 and the IL-33 receptor ST2. As T conv cells accumulated in the tissue, they gradually lost expression of ST2, ceased to proliferate, and acquired an anergic phenotype. The transition from effector to anergic state was substantially faster in ST2-deficient perinates, whereas it was abrogated in IL-33-treated mice. A similar dampening of anergy occurred after depletion of perinatal T reg cells. Attenuation of anergy through PD-1 blockade or IL-33 administration promoted the immediate breakdown of tolerance and onset of multiorgan autoimmunity. Hence, regulating IL-33 availability may be critical in maintaining T cell anergy.


Figures

None
Graphical abstract
Figure 1.
Figure 1.
PD-1+CD4+ T conv cells were enriched in nonlymphoid organs of Aire−/− perinates. (A) Quantification of Foxp3CD4+ T cells from the liver and spleen of 8–10-d-old mice (n = 9–16 mice/group). (B and C) Frequency of CD44+CD62Llo (n = 7–8 mice/group; B) and CD44+PD-1+ (n = 11–18 mice/group; C) T conv cells from liver and spleen of 8–10-d-old mice. (D) Frequency of PD-1+ cells (left) and PD-1 mean fluorescence intensity (MFI; right) from the liver of 8–10-d-old Aire−/− mice (n = 9 mice/group). (E) Frequency of PD-1+ T conv cells from liver of mice of various ages (n = 3–8 mice/group). (F) Numbers of T eff cells and naive T conv cells in the liver of differently aged Aire−/− mice (n = 4–9 mice/group). (G) Frequency of PD-1+ T conv cells in the spleen and various nonlymphoid organs of 8–10-d-old mice (n = 4–16 mice/group). Representative flow cytometric plots in A–C show the gating strategy. Data are pooled from at least two independent experiments. Summary data (all panels) show mean ± SD. *, P ≤ 0.05; **, P ≤ 0.01; ***, P ≤ 0.001; ****, P ≤ 0.0001 (two-tailed unpaired Student’s t test).
Figure 2.
Figure 2.
Nonlymphoid organs with high abundances of PD-1+ T conv cells were enriched in T reg cells. (A) Representative flow cytometric plots and summary data concerning T reg cell percentage at various ages (n = 3–9 mice/group). (B) Number of T reg cells in the liver of differently aged Aire−/− mice (n = 4–9 mice/group). (C) Frequency of T reg cells in the spleen and various nonlymphoid organs of 8–10-d-old mice (n = 4–16 mice/group). (D) Correlation between frequencies of T reg cells (x axis) and PD-1+ T conv cells (y axis) in organs of 8–10-d-old Aire−/− mice (median values of data shown in Figs. 1 G and 2 C; n = 4–16 mice/group). Data are pooled from two to four independent experiments and show mean ± SD. Statistical analyses in A–C as in Fig. 1. **, P ≤ 0.01; ***, P ≤ 0.001.
Figure 3.
Figure 3.
T cell dynamics in the perinatal liver. (A) Analysis of biotin-labeled CD4+ T conv cells in the liver 12 h after intrathymic injection of biotin (n = 4–6 mice/group). (B) Proliferation of liver CD4+ T cells in differently aged Aire−/− perinates 4 h after EdU injection (n = 5–7 mice/group). (C) Frequency of photoconverted (PhC) CD4+ T cells (K-red) retained in the liver at various time points after light exposure of the organ in 6-d-old Kaede/B6.Aire−/− mice (n = 3–4 mice/group). (D) Annexin V+ and 7AAD+ liver T conv cells in Aire−/− mice of various ages (n = 6 mice/group). Data are pooled from two to four independent experiments and show mean ± SD. Statistical analyses as in Fig. 1. *, P ≤ 0.05; **, P ≤ 0.01; ***, P ≤ 0.001; ****, P ≤ 0.0001.
Figure 4.
Figure 4.
Age-related changes in gene expression in perinatal PD-1+ T conv cells. (A) RNA-seq analysis of PD-1+ and PD-1 T conv cells from liver of 5-d-old Aire−/− mice. Left: Volcano plot comparing transcriptomes from PD-1 versus PD-1+ T conv cells. Genes at least twofold up- (red) or down- (blue) regulated. Right: GSEA using the Hallmark collection from the MSigDB. A selection of significantly enriched gene sets at false discovery rate <0.1. (B) Volcano plots of transcriptomes from PD-1 versus PD-1+ T conv cells, as in A. Superimposed signatures (left to right): Activation up- (red) or down- (blue) signature from in vitro–activated T cells (Hill et al., 2007); exhaustion-up signature (transcripts overexpressed in exhausted vs. memory CD4+ T cells; Crawford et al., 2014); and anergy core signature (Macián et al., 2002; Zheng et al., 2012; Kalekar et al., 2016). FC, fold-change. (C) Left: Volcano plot comparing transcriptomes from PD-1+ T conv cells for 5- versus 10-d-old Aire−/− mice. Right: GSEA Hallmark gene sets. (D) Volcano plots of transcriptomes from PD-1+ T conv cells in 5- versus 10-d-old Aire−/− mice, as in C. Superimposed signatures are the same as in B. Data are pooled from two independent experiments (n = 2 mice/group/age).
Figure 5.
Figure 5.
Perinatal T reg cells were critical for maintaining anergy in PD-1+ T conv cells. (A) Frequencies of anergic (CD73hiFR4hi) PD-1+ T conv cells in liver from mice of various ages. Top: Representative flow-cytometric plots showing gating strategy using CD44PD-1 T conv cells to identify anergic cells. Bottom: Summary data (n = 4–14 mice/group). (B) Nrp1 expression on various populations of liver CD4+ T cells from 10-d-old Aire−/− mice (n = 9 mice/group). (C) Expression of Nur77 in cells from 10-d-old Nur77eGFP reporter mice (n = 4 mice/group). Nur77eGFP− cells were used as controls in all histograms (gray shadings). MFI, mean fluorescence intensity. (D) Frequency of anergic T conv cells in T reg cell–depleted perinates. Top: Treatment regimen for DT injection. Bottom left: T conv and T reg cell summary data on DT-treated 10-d-old mice. Right: Representative flow-cytometric plots and summary data for anergic T conv cells from DT-treated mice (n = 4–9 mice/group). Data are pooled from two to four independent experiments and show mean ± SD. Statistical analyses as in Fig. 1. **, P ≤ 0.01; ***, P ≤ 0.001; ****, P ≤ 0.0001.
Figure 6.
Figure 6.
The ability of T reg cells to maintain anergy in effector cells was independent of Aire. (A) Regimen for adoptive T reg cell transfer and DT treatment. (B) Numbers of T conv cells in the liver of recipient mice and controls. (C and D) Frequency of anergic T conv cells (C) and expression of PD-1 on T conv cells (D). Data are pooled from two independent experiments (all panels, n = 5–6 mice/group) and show mean ± SD. Statistical analyses as in Fig. 1. MFI, mean fluorescence intensity; NA, not applicable. **, P ≤ 0.01; ***, P ≤ 0.001.
Figure 7.
Figure 7.
ST2 signaling reined in anergy in perinatal liver T conv cells. (A) Frequency of ST2+ PD-1 and PD-1+ T conv cells in liver from differently aged perinates (n = 7–10 mice/group; see Fig. S4 A for gating strategy of ST2+ cells). (B) CD44+PD-1+ T conv cells from liver of 10-d-old mice (n = 5–8 mice/group). (C) Frequency of anergic (FR4hiCD73hi) PD-1+ T conv cells in Aire−/− mice of various ages (n = 4–10 mice/group). (D) Impact of ST2 deficiency on proliferation. αCD3/28 in vitro stimulation of sorted CellTrace violet–labeled liver and spleen CD4+ T cells from 6-d-old mice (n = 4 mice/group). (E) Frequency of total and anergic CD44+PD-1+ T conv cells form liver of IL-33–treated mice. Top: Treatment regimen. Bottom: Representative flow-cytometric plots and summary data (n = 4–10 mice/group). Data are pooled from at least two independent experiments and show mean ± SD. Statistical analyses as in Fig. 1. ns, not significant. *, P ≤ 0.05; **, P ≤ 0.01; ***, P ≤ 0.001; ****, P ≤ 0.0001.
Figure 8.
Figure 8.
The expression of ST2 on T reg cells was age and Aire dependent. (A) Concentration of IL-33 protein in lysates from various tissues of perinatal and adult mice (n = 3 mice/group). (B) Frequency of ST2+ T reg cells in Aire+/+ and Aire−/− mice of various ages. Left: Representative flow-cytometric plots. Right: Summary data (n = 6–11 mice/group). Data are pooled from at least two independent experiments and show mean ± SD. Statistical analyses as in Fig. 1. *, P ≤ 0.05; **, P ≤ 0.01; ****, P ≤ 0.0001.
Figure 9.
Figure 9.
PD-1 inhibition or treatment with IL-33–induced early-onset autoimmunity in Aire-deficient NOD perinates. (A) Impact of αPD-1 treatment on T cell proliferation. Top: αPD-1 treatment regimen for data shown in A–D. Bottom: Summary of percentage of proliferating effector T cells in various organs 4 h after EdU injection (n = 3–6 mice/group; see Fig. S5 E for flow cytometric plots and corresponding data for anergic T conv cells). (B) Frequencies and numbers of CD44+ T conv cells from Aire−/− mice (n = 3–6 mice/group). (C) Impact of αPD-1 treatment on autoimmune disease. Upper left: Weight change. Right: Blood-glucose levels, measured at two time points after mAb injection (n = 5–6 mice/group). Bottom: Survival curves (n = 11–15 mice/group); mice were sacrificed if their weight fell to <20% of that of control-treated littermates or if they developed diabetes. P value determined by log-rank (Mantel–Cox) test. (D) Histopathology analysis of organs from mice shown in C (n = 6–9 mice/group). Additional organs are shown in Fig. S5 G. Scale bars, 200 µm. (E) Impact of IL-33 treatment on autoimmune disease in NOD.Aire−/− mice. Left: Survival curves (n = 5–10 mice/group). Right: Histopathology analysis at the time of death or end of the experiment (30 d after birth). Filled sections represent infiltrated tissues (see Fig. S8 C for histology scores). Data are pooled from at least two independent experiments and show mean ± SD. Statistical analyses as in Fig. 1. *, P ≤ 0.05; **, P ≤ 0.01; ***, P ≤ 0.001; ****, P ≤ 0.0001.

References

    1. Adkins B., Leclerc C., and Marshall-Clarke S.. 2004. Neonatal adaptive immunity comes of age. Nat. Rev. Immunol. 4:553–564. 10.1038/nri1394 - DOI - PubMed
    1. Alferink J., Tafuri A., Vestweber D., Hallmann R., Hämmerling G.J., and Arnold B.. 1998. Control of neonatal tolerance to tissue antigens by peripheral T cell trafficking. Science. 282:1338–1341. 10.1126/science.282.5392.1338 - DOI - PubMed
    1. Anderson M.S., Venanzi E.S., Klein L., Chen Z., Berzins S.P., Turley S.J., von Boehmer H., Bronson R., Dierich A., Benoist C., and Mathis D.. 2002. Projection of an immunological self shadow within the thymus by the aire protein. Science. 298:1395–1401. 10.1126/science.1075958 - DOI - PubMed
    1. Anderson M.S., Venanzi E.S., Chen Z., Berzins S.P., Benoist C., and Mathis D.. 2005. The cellular mechanism of Aire control of T cell tolerance. Immunity. 23:227–239. 10.1016/j.immuni.2005.07.005 - DOI - PubMed
    1. Ansari M.J., Salama A.D., Chitnis T., Smith R.N., Yagita H., Akiba H., Yamazaki T., Azuma M., Iwai H., Khoury S.J., et al. . 2003. The programmed death-1 (PD-1) pathway regulates autoimmune diabetes in nonobese diabetic (NOD) mice. J. Exp. Med. 198:63–69. 10.1084/jem.20022125 - DOI - PMC - PubMed

Publication types

MeSH terms