. 2019 May 15;202(10):3020-3032.
doi: 10.4049/jimmunol.1801456. Epub 2019 Apr 15.

Trauma Induces Emergency Hematopoiesis through IL-1/MyD88-Dependent Production of G-CSF

Affiliations

Trauma Induces Emergency Hematopoiesis through IL-1/MyD88-Dependent Production of G-CSF

Anja Fuchs et al. J Immunol. .

Abstract

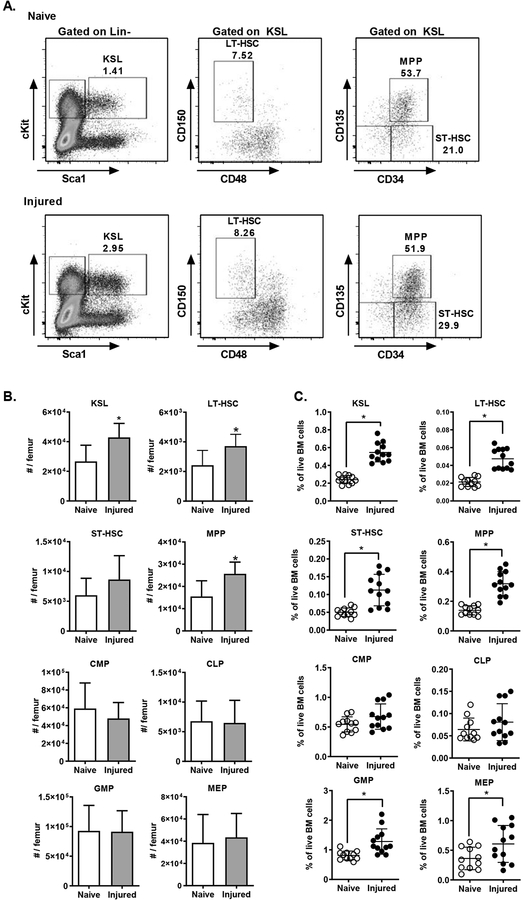
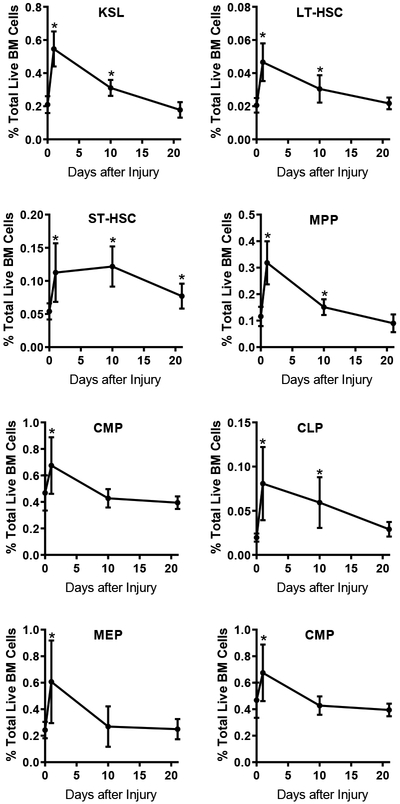
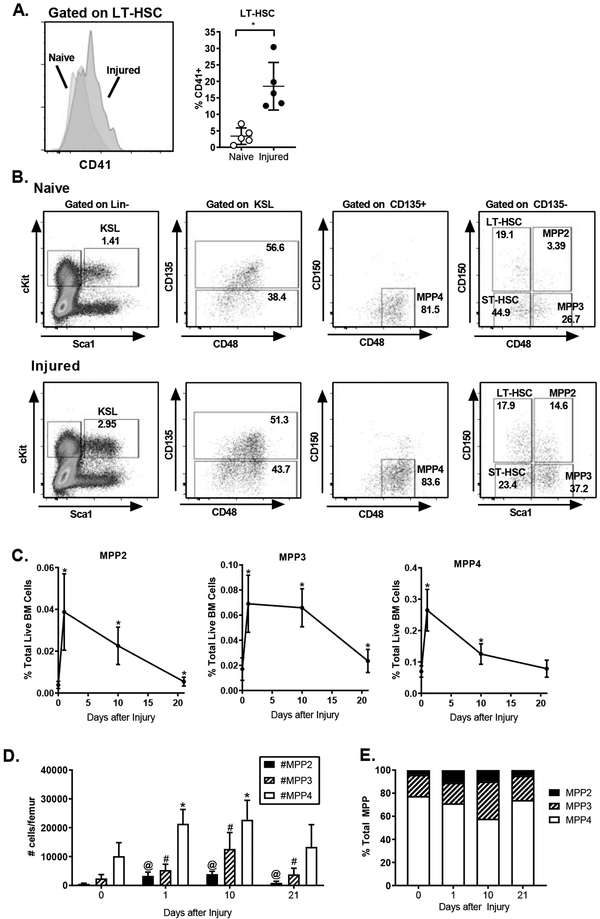
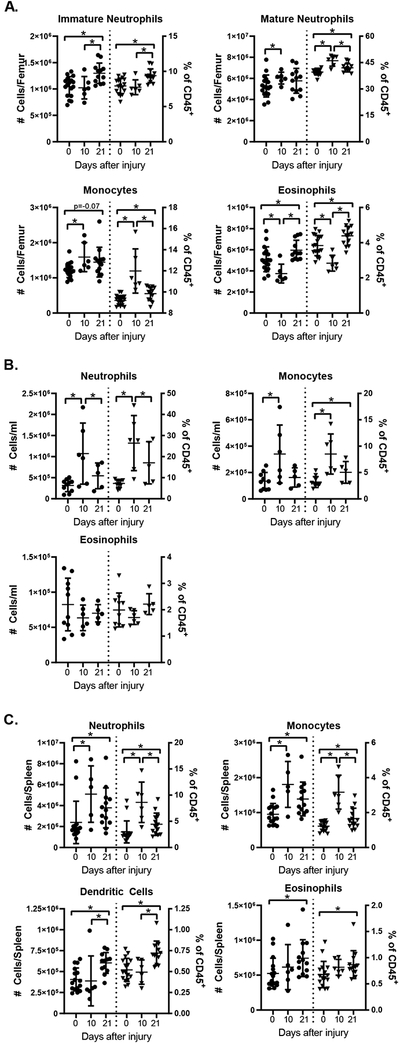
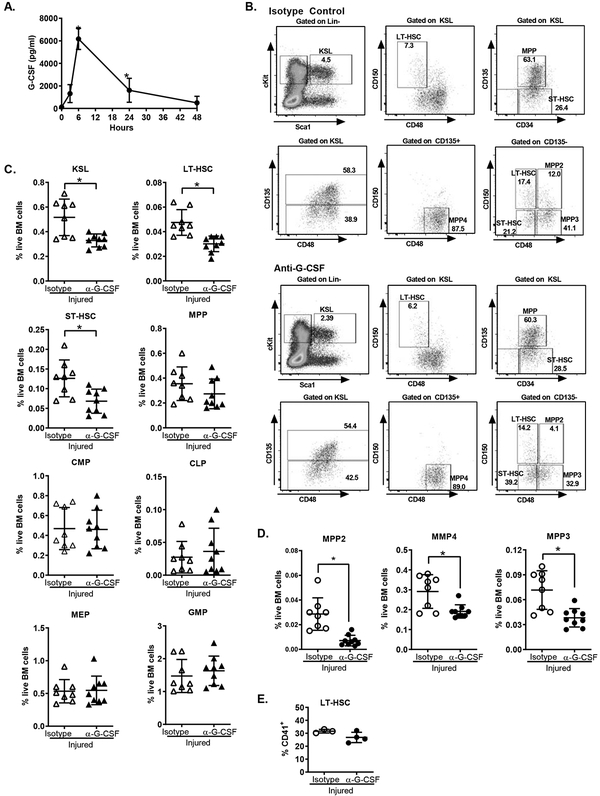
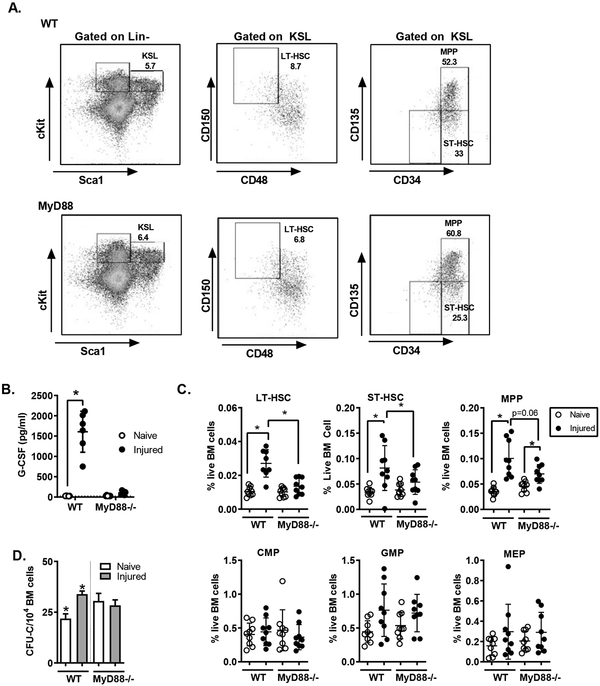
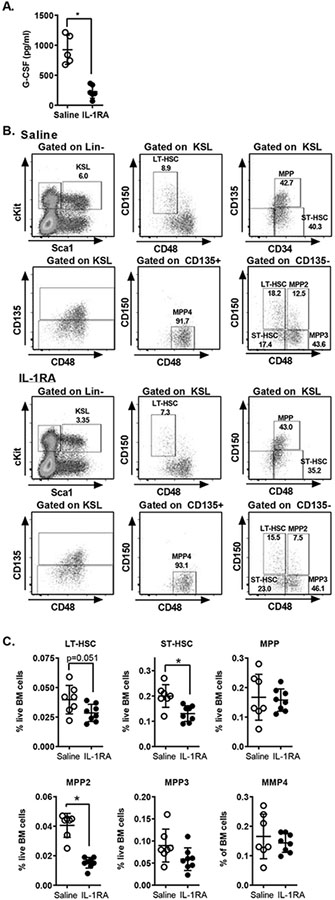
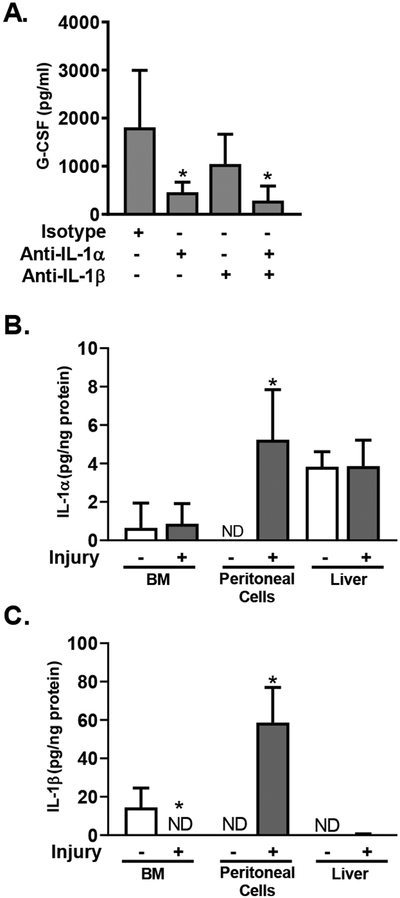
The inflammatory response to infection or injury dramatically increases the hematopoietic demand on the bone marrow to replace effector leukocytes consumed in the inflammatory response. In the setting of infection, pathogen-associated molecular patterns induce emergency hematopoiesis, activating hematopoietic stem and progenitor cells to proliferate and produce progeny for accelerated myelopoiesis. Sterile tissue injury due to trauma also increases leukocyte demand; however, the effect of sterile tissue injury on hematopoiesis is not well described. We find that tissue injury alone induces emergency hematopoiesis in mice subjected to polytrauma. This process is driven by IL-1/MyD88-dependent production of G-CSF. G-CSF induces the expansion of hematopoietic progenitors, including hematopoietic stem cells and multipotent progenitors, and increases the frequency of myeloid-skewed progenitors. To our knowledge, these data provide the first comprehensive description of injury-induced emergency hematopoiesis and identify an IL-1/MyD88/G-CSF-dependent pathway as the key regulator of emergency hematopoiesis after injury.


Figures

Figure 1.
Figure 1.
Injury Induces Expansion of Immature HSPC Populations. C57BL/6 mice (n=11–12) were subjected to polytrauma. 24 hours after injury, bone marrow was isolated from injured mice and naïve controls and analyzed by flow cytometry. A) Representative FACS plots for identification of hematopoietic progenitor cells. Early progenitor cells were gated as live, lineage-negative, CD117+ (cKit) Sca-1+ (KSL) cells with the following phenotypes: CD150+ CD48− (LT-HSC), CD34+ CD135− (ST-HSC), CD34+ CD135+ (MPP). The total number of cells per femur (B, mean+/− SD) and the frequency of each population among live bone marrow cells are shown (C, individual values shown, horizontal bar/whisker represent mean+/−SD). Data are combined from 3 independent series of experiments. *= p<0.05 by Mann-Whitney U test.
Figure 2.
Figure 2.
Time Course of Injury-Induced Changes of Hematopoietic Progenitor Frequencies. WT C57BL/6 mice were subjected to polytrauma. At 1, 10 and 21 days after injury, bone marrow was isolated (n=11–18 per time point for injured; n=19 for naive). and progenitor frequency assay by FACS as in Figure 1A. The frequency of each population among live bone marrow cells was calculated. *= p<0.05 by Mann-Whitney U test vs. naïve, mean+/−SD shown; data pooled from 2–4 independent experiments at each time point.
Figure 3.
Figure 3.
Injury Skews Immature Progenitors Toward Myeloid Cell Production. C57BL/6 mice were subjected to polytrauma. Bone marrow was isolated from naïve animals or injured animals 1 or 10 days after injury and analyzed by flow cytometry. A: left panel, representative histogram of CD41 expression on LT-HSC. Right panel, the frequency of CD41+ cells within LT-HSC. n=5/group; data pooled from 2 independent experiments; individual values shown, horizontal bar/whisker represent mean+/−SD; B. Representative FACS plots for identification of MPP subset populations within KSL; MPP2: CD135− CD150+ CD48+; MPP3: CD135− CD150− CD48+; MPP4: CD135+ CD150− CD48+. C. The frequency of MPP subsets within BM at 0, 1 and 10 days after injury * = p<0.05 by Mann-Whitney U test. D. Absolute number of each MPP subset per femur from naïve (Day 0) mice and at 1, 10, and 21 days after injury. *, #, @ = p<0.05 by Mann-Whitney U test vs. day 0 (naïve). C,D data represented as mean+/−SD. E. The distribution of MPP populations expressed as a frequency of total MPP at 0, 1, 10 and 21 days after injury. C-E n=11–19 per time point, data pooled from 3–4 independent experiments per time point.
Figure 4.
Figure 4.
Injury is Associated with Increased Myeloid Cell Numbers in the Bone Marrow and Spleen. WT mice were subjected to polytrauma; bone marrow (A), blood (B) and spleens (C) were harvested 10 or 21 days after injury (or from naïve animals) and analyzed by flow cytometry. Absolute numbers of cells (left y axis) and frequency among CD45+ cells (right y axis) are shown; horizontal bar/whisker represent mean+/−SD). Data are pooled from 2–3 independent experiments per time point. * = p<0.05 by Mann-Whitney U test. Cell subset gating was done as shown in Supplemental Figure 4; splenic dendritic cells were identified as CD3CD19NK1.1CD11b+CD11c+ cells.
Figure 5.
Figure 5.
G-CSF Drives Expansion of Immature Hematopoietic Progenitors after Injury. A. WT mice were subjected to polytrauma and plasma harvested at 3, 6, 24 and 48 hours after injury or from naïve mice (n=4–13/ time-point). Plasma G-CSF was measured by cytometric bead array. Data represented as mean+/−SD; *= p<0.05 vs. naive by ANOVA/Dunn’s Multiple Comparisons Test. Data are pooled from 2–4 independent experiments per time point. B-E: C57BL/6 mice were subjected to polytrauma. 15 hours before injury and at the time of injury, animals were treated with G-CSF blocking antibody or isotype control. 24 hours after injury, bone marrow was harvested and analyzed by flow cytometry for the frequencies of progenitor populations. B. Representative FACS plots showing progenitor subsets in mice with and without G-CSF blockade. C. Progenitor frequency with or without G-CSF blockade. D) MPP subset frequencies with and without G-CSF blockade. C/D: n=7–9, data pooled from 3 independent experiments. E. Frequency of CD41+ LT-HSC (n=3–4, data pooled from 2 independent experiments). Individual values shown, horizontal bar/whisker represent mean+/−SD.
Figure 6.
Figure 6.
MyD88 Drives G-CSF Production and Hematopoietic Progenitor Expansion after Injury. WT (C57BL/6) and MyD88−/− mice were subjected to polytrauma. 24 hours after injury bone marrow and plasma was harvested and G-CSF measured by cytometric bead array (CBA). A. Representative FACS plots showing progenitors in WT and MyD88−/− mice 24 hours after injury. B. Plasma G-CSF from WT and MyD88−/− mice 24 hours after injury C. HSPC frequency was assayed by flow cytometry; *= p<0.05 by Mann-Whitney U test. D. 104 bone marrow cells were cultured in methylcellulose media. The number of cell-colony-forming units was counted at day 7 of culture; (mean+/−SEM, n=3/group, *=p<0.05 by t-test). B,C: Data are pooled from 3 independent experiments. Individual values shown, horizontal bar/whisker represent mean+/−SD). C: Data are pooled from 2 independent experiments.
Figure 7.
Figure 7.
IL-1 Drives G-CSF Production and Progenitor Expansion after Injury. A. WT mice were treated with recombinant IL-1RA 1 hour before polytrauma; plasma G-CSF was measured by CBA. B, C. WT mice were treated with 3 doses of IL-1 RA (16 hours before injury, at the time of injury and 8 hours after injury). Bone marrow was harvested 24 hours after injury and analyzed by flow cytometry. B. Representative FACS plots showing progenitors in mice with and without IL-1RA. C. Frequency of LT-HSC, ST-HSC and MPP populations. *=p<0.05 by Mann-Whitney U Test. Data are pooled from 2–3 independent experiments. Individual values shown, horizontal bar/whisker represent mean+/−SD)
Figure 8.
Figure 8.
IL-1 Drives G-CSF Expression. A. WT mice were treated with antibodies against IL-1α and IL-1β alone or in combination as indicated, or with isotype control antibody, 1 hour before polytrauma. 6 hours after injury plasma G-CSF was measured. Data represented as mean+/−SD, n=4–5/group, data are pooled from 2 independent experiments. *=p<0.05 by Mann-Whitney U Test. B/C. IL-1 analysis in tissues from mice at 6h after injury vs. naive mice. IL-1α (B) and IL-1β (C) were measured by CBA in cell lysates from BM, peritoneal exudate, and blood, and in liver homogenates. Cytokine levels were normalized to total protein content. Data represented as mean+/−SD, n=4/group, data are pooled from 2 independent experiments. *=p<0.05 by Mann-Whitney U Test.

References

    1. Cullen SM, Mayle A, Rossi L, and Goodell MA. 2014. Hematopoietic stem cell development: an epigenetic journey. Current topics in developmental biology 107: 39–75. - PubMed
    1. Challen GA, Boles N, Lin KK, and Goodell MA. 2009. Mouse hematopoietic stem cell identification and analysis. Cytometry. Part A : the journal of the International Society for Analytical Cytology 75: 14–24. - PMC - PubMed
    1. Rossi L, Challen GA, Sirin O, Lin KK, and Goodell MA. 2011. Hematopoietic stem cell characterization and isolation. Methods in molecular biology (Clifton, N.J.) 750: 47–59. - PMC - PubMed
    1. Manz MG, and Boettcher S. 2014. Emergency granulopoiesis. Nature reviews. Immunology 14: 302–314. - PubMed
    1. Takizawa H, Boettcher S, and Manz MG. 2012. Demand-adapted regulation of early hematopoiesis in infection and inflammation. Blood 119: 2991–3002. - PubMed

Publication types

MeSH terms

Substances