. 2019 Jun 13;39(13):e00020-19.
doi: 10.1128/MCB.00020-19. Print 2019 Jul 1.

Growth Factor Independence 1B-Mediated Transcriptional Repression and Lineage Allocation Require Lysine-Specific Demethylase 1-Dependent Recruitment of the BHC Complex

Affiliations

Growth Factor Independence 1B-Mediated Transcriptional Repression and Lineage Allocation Require Lysine-Specific Demethylase 1-Dependent Recruitment of the BHC Complex

David McClellan et al. Mol Cell Biol. .

Abstract

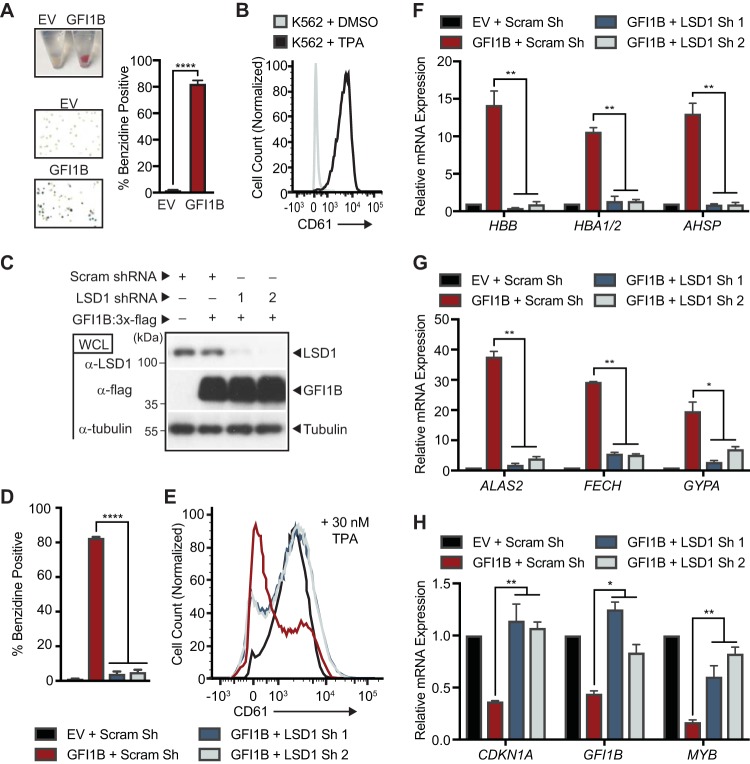
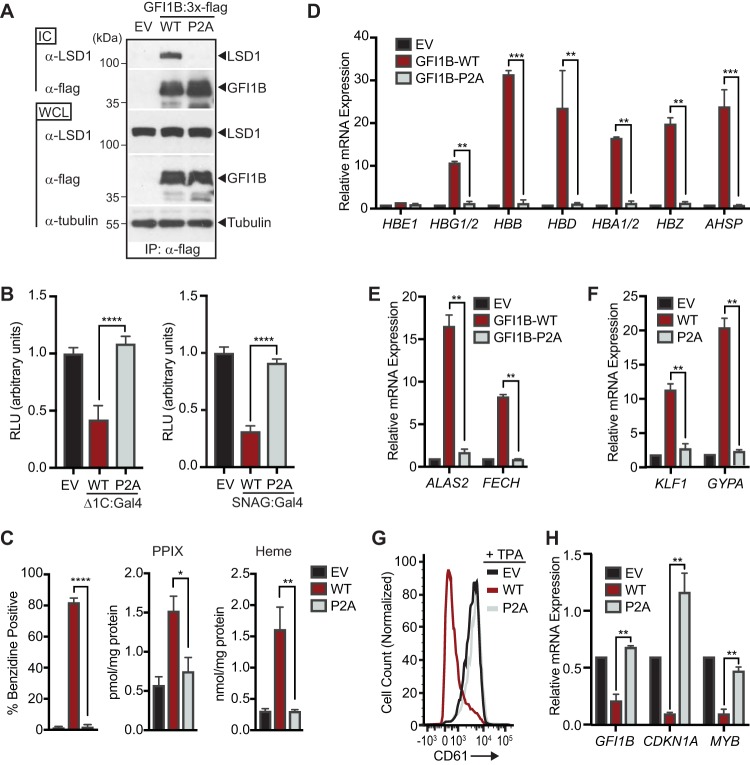
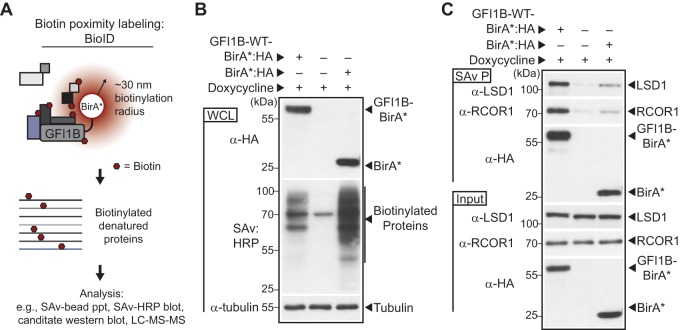
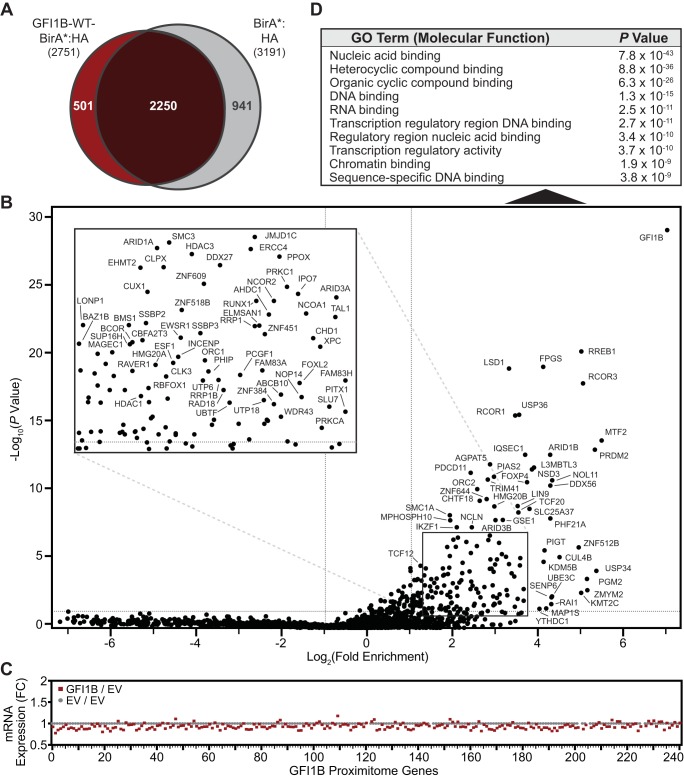
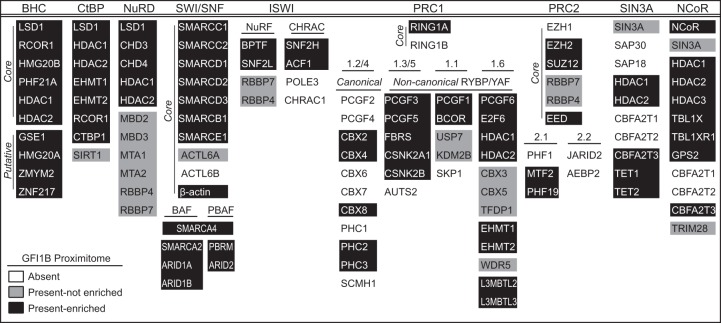
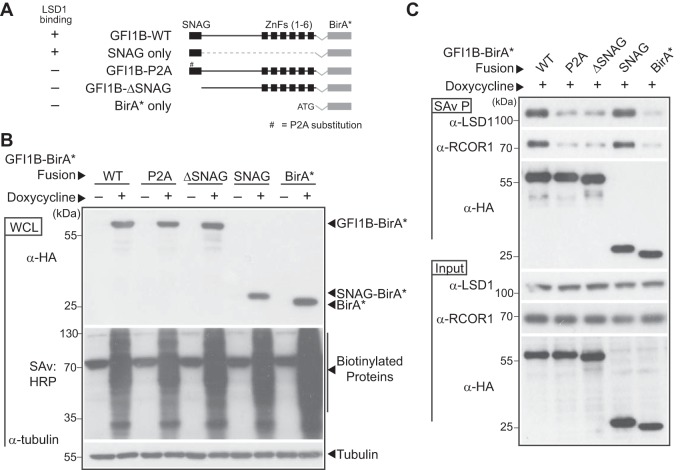
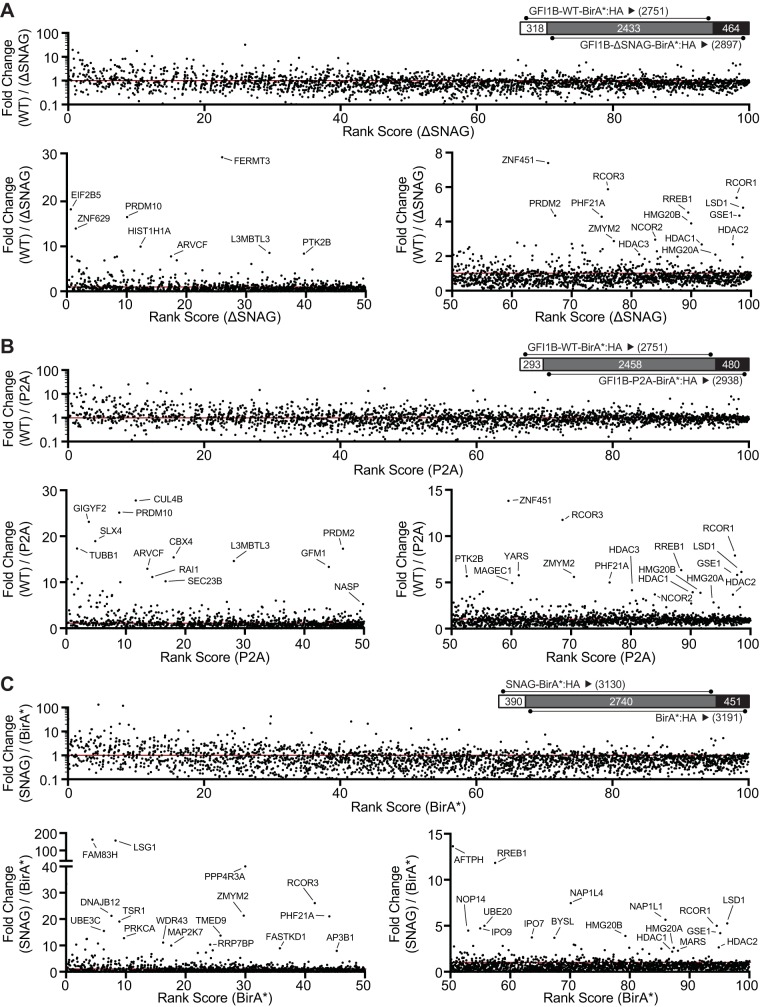
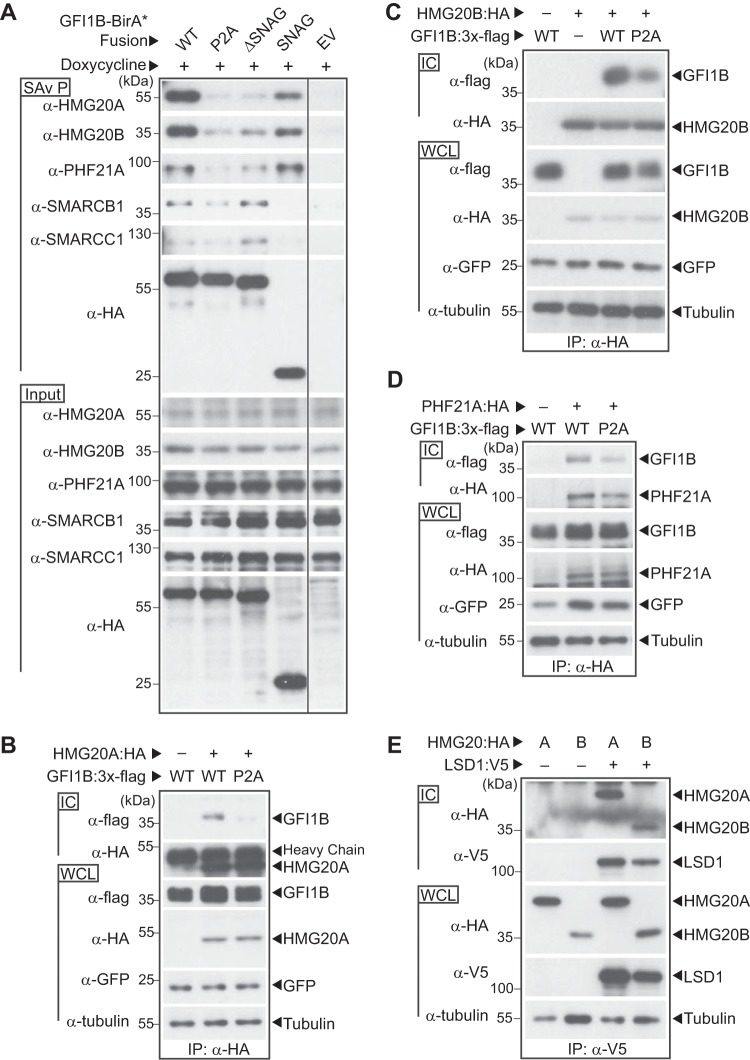
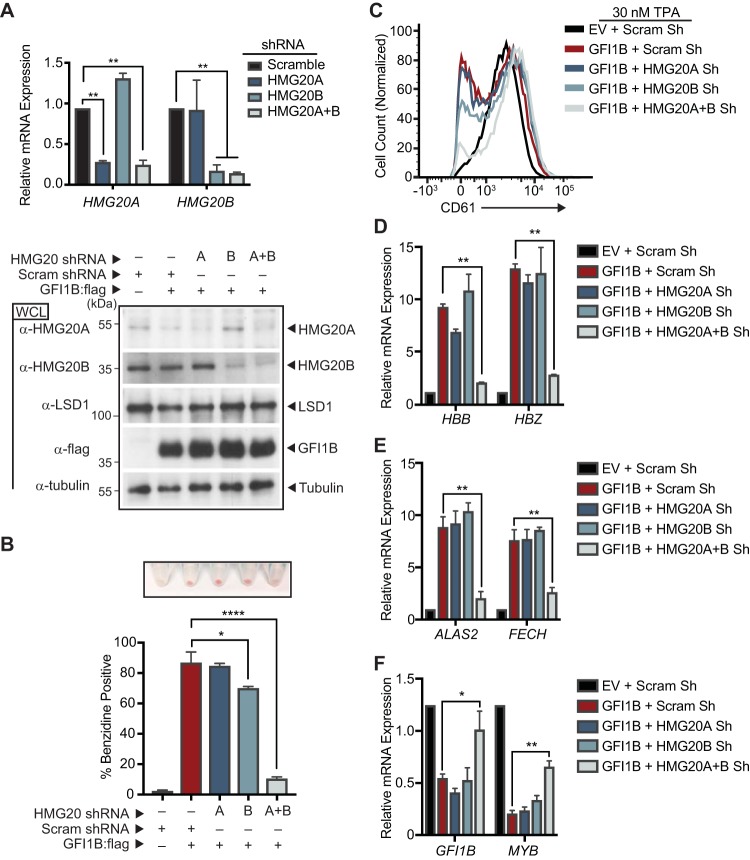
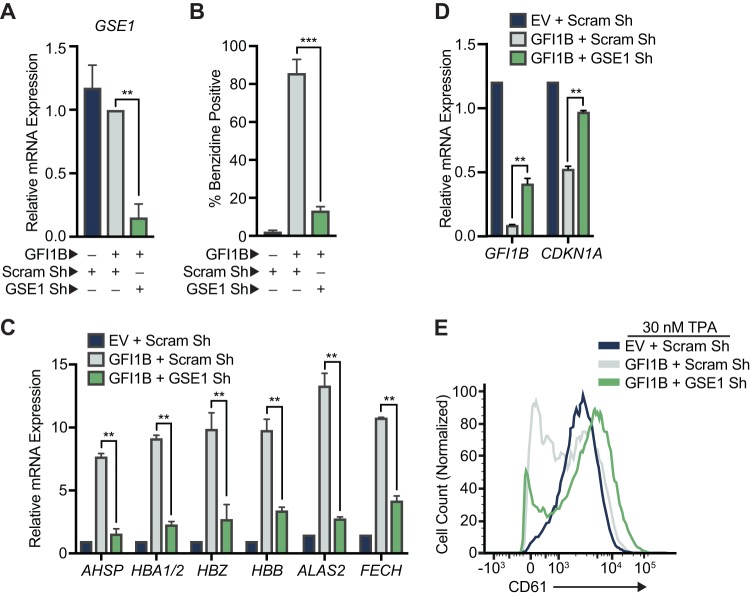
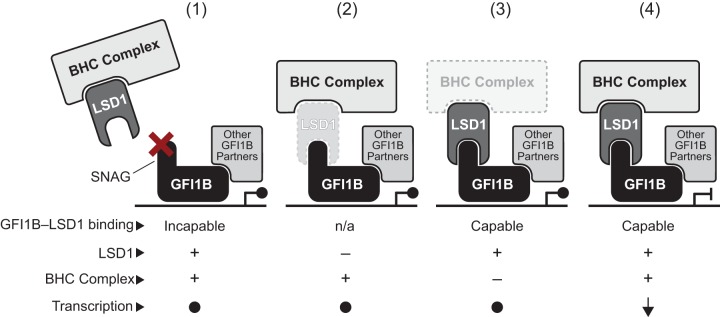
Growth factor independence 1B (GFI1B) coordinates assembly of transcriptional repressor complexes comprised of corepressors and histone-modifying enzymes to control gene expression programs governing lineage allocation in hematopoiesis. Enforced expression of GFI1B in K562 erythroleukemia cells favors erythroid over megakaryocytic differentiation, providing a platform to define molecular determinants of binary fate decisions triggered by GFI1B. We deployed proteome-wide proximity labeling to identify factors whose inclusion in GFI1B complexes depends upon GFI1B's obligate effector, lysine-specific demethylase 1 (LSD1). We show that GFI1B preferentially recruits core and putative elements of the BRAF-histone deacetylase (HDAC) (BHC) chromatin-remodeling complex (LSD1, RCOR1, HMG20A, HMG20B, HDAC1, HDAC2, PHF21A, GSE1, ZMYM2, and ZNF217) in an LSD1-dependent manner to control acquisition of erythroid traits by K562 cells. Among these elements, depletion of both HMG20A and HMG20B or of GSE1 blocks GFI1B-mediated erythroid differentiation, phenocopying impaired differentiation brought on by LSD1 depletion or disruption of GFI1B-LSD1 binding. These findings demonstrate the central role of the GFI1B-LSD1 interaction as a determinant of BHC complex recruitment to enable cell fate decisions driven by GFI1B.

Keywords: BHC complex; Erythropoiesis; GFI1B; GSE1; HMG20A; HMG20B; LSD1; SNAG domain; hematopoiesis; transcriptional repression.


Figures

FIG 1
FIG 1
LSD1 depletion impedes GFI1B-mediated erythroid differentiation. (A) GFI1B overexpression promotes K562 cell hemoglobinization. Cells were infected with empty vector (EV) or virus expressing GFI1B. GFI1B-expressing cells become red and are benzidine positive. Benzidine-positive cells are quantified as mean ± standard deviation (SD) from four biological replicates. (B) TPA triggers cell surface expression of CD61 in K562 cells. CD61 expression was quantified in vehicle- versus TPA-treated viable cells by flow cytometry. (C) LSD1 depletion and GFI1B overexpression in K562 cells. Small hairpin RNAs targeting LSD1 (LSD1 shRNA) or content-matched scramble control (Scram shRNA) were inducibly transcribed in K562 cells, followed by infection at day +3 with GFI1B:3×-Flag-expressing virus or EV. LSD1 and GFI1B were quantified by Western blotting of whole-cell lysates (WCLs). Tubulin served as a loading control. (D) LSD1 depletion blocks GFI1B-mediated K562 cell hemoglobinization. (E) LSD1 depletion enables TPA-induced CD61 expression in the context of GFI1B overexpression. (F and G) LSD1 depletion impairs expression of erythroid fate genes in response to GFI1B overexpression. Expression of the alpha- and beta-globin (HBA1/2 and HBB), alpha-globin-stabilizing protein (AHSP), aminolevulinic acid synthase 2 (ALAS2), ferrochelatase (FECH), and glycophorin A (GYPA) genes is shown. (H) LSD1 depletion restores expression of GFI1B-repressed target genes. Expression of the CDKN1A, GFI1B, and MYB genes is shown. Gene expression was quantified by RT-qPCR normalized to GUS. Results are expressed as mean ± 2 SD from two independent experiments performed in triplicate. *, P < 0.05; **, P < 0.005; ****, P < 0.00005.
FIG 2
FIG 2
LSD1 binding is required for GFI1B-regulated cell fate decisions in K562 cells. (A) P2A substitution in GFI1B impairs GFI1B-LSD1 binding. K562 cells were transduced with constructs expressing wild-type GFI1B:3×-Flag, its P2A variant, or empty vector (EV) as shown. GFI1B forms were immunopurified with anti-Flag (M2) antibody and protein G-Sepharose. LSD1 was quantified in immune complexes (ICs) by Western blotting. Equal expression (LSD1 and GFI1B) and precipitation (GFI1B) were evaluated by Western blotting of whole-cell lysates (WCLs) and ICs, respectively. Tubulin was used to confirm equal gel loading. (B) P2A substitution abolishes transcriptional repression by GFI1B. 293-T-Rex-5×Gal-luciferase cells were transfected with WT or P2A variants of GFI1B-Δ1C:Gal4 (left) or SNAG:Gal4 (right) fusion proteins. Firefly luciferase was measured and normalized to constitutively expressed, cotransfected Renilla luciferase. Reporter activity is expressed as mean ± 2 SD from two experiments performed in triplicate. (C) P2A substitution impairs GFI1B-mediated hemoglobinization. Benzidine staining was quantified as for Fig. 1A. Protoporphyrin IX (PPIX) and heme were quantified by UPLC in K562 cells transduced with EV, GFI1B-WT, or GFI1B-P2A. (D to F) P2A substitution impairs expression of erythroid fate genes in K562 cells. Expression of anti-globin cluster genes AHSP, ALAS2, FECH, GYPA, and Kruppel-like factor 1 gene (KLF1) are shown. (G) P2A substitution abolishes GFI1B-mediated suppression of TPA-induced CD61 expression. Cell surface expression of CD61 in TPA-treated cells expressing GFI1B-WT or its P2A variant was determined by flow cytometry. (H) P2A substitution reverses repression of GFI1B target genes GFI1B, CDKN1A, and MYB. Results expressed as mean ± 2 SD. *, P < 0.05; **, P < 0.005; ***, P < 0.0005; ****, P < 0.00005.
FIG 3
FIG 3
Proximity labeling of GFI1B binding proteins with GFIB-BirA*. (A) Schematic representation of the strategy for biotin modification of GFI1B partners. GFI1B-WT is fused to the promiscuous biotin ligase with an HA epitope tag (BirA*:HA) to form GFI1B-WT-BirA*:HA. GFI1B partners are spontaneously biotinylated due to their proximity to BirA*:HA anchored to GFI1B in cis. Biotinylated products are captured on streptavidin (SAv)-conjugated beads for downstream analysis via candidate-based or screening approaches. (B) BirA*:HA and GFI1B-WT-BirA*:HA fusion biotinylate diverse targets in K562 cells. Cells were transduced with constructs inducibly expressing GFI1B-WT-BirA*:HA, BirA*:HA, or EV, treated with doxycycline, and harvested. GFI1B-WT-BirA*:HA and BirA*:HA expression was confirmed by anti-HA Western blotting and biotinylated proteins detected by SAv:HRP. Tubulin served as a loading control. (C) GFI1B-interacting proteins LSD1 and RCOR1 are enriched among proteins biotinylated by GFI1B-WT-BirA*:HA compared to BirA*:HA or EV. Biotin-modified proteins were collected on SAv-Sepharose. LSD1, RCOR1, and the BirA*:HA fusion proteins themselves were quantified among purified proteins (SAv P) by Western blotting. Equal expression was confirmed by Western blotting in whole-cell lysates (input).
FIG 4
FIG 4
GFIB-WT-BirA*:HA defines a GFI1B-WT proximitome. (A) Venn diagram showing proteins identified from mass spectral screening of biotin-modified proteins from K562 cells expressing GFI1B-WT-BirA*:HA or BirA*:HA. Common and unique proteins are indicated. (B) GFI1B-WT-BirA*:HA identifies members of a GFI1B-WT proximitome. Factors enriched among biotinylated and SAv-Sepharose-purified proteins modified by GFI1-WT-BirA*:HA (test) compared to BirA*:HA (control) are shown. Fold enrichment is plotted logarithmically as a ratio of average sum read intensities between test and control samples against their P values calculated from their 20 closest-ranked neighbors in the data set as described in Materials and Methods. Individual proteins are labeled with their respective gene names. The inset shows an expanded view of the data contained in the boxed area. (C) Fold change in mRNA levels for the 241 hits identified in the GFI1B-WT proximitome. mRNAs for each hit are listed in rank order from highest to lowest to match their order in the GFI1B-WT proximitome, also from highest to lowest. (D) Gene ontology (GO) analysis for the 241 hits identified in the GFI1B-WT proximitome. The top 10 functional assignment are shown with their corresponding P values.
FIG 5
FIG 5
Components of transcriptional repression and chromatin-remodeling complexes identified by GFI1B-WT proximity labeling. A roster of transcriptionally relevant complexes and their component members are shown. Proteins are listed according to HUGO gene nomenclature. With respect to the GFI1B-WT proximitome (GFI1B-WT-BirA*:HA versus BirA*:HA), proteins present and enriched are shown on a black background. Those present but not significantly enriched (P < 0.05) are shown on a gray background. Those not present (average sum read intensity below that for EV) are shown on a white background. Where appropriate, complexes are subdivided into core and putative members and/or with canonical versus noncanonical designations.
FIG 6
FIG 6
LSD1-nonbinding variants of GFI1B-BirA*:HA fail to biotinylate LSD1 and RCOR1. (A) Graphical representation of GFI1B-BirA*:HA fusion proteins employed in experiments. Each fusion protein is comprised of the GFI1B regions shown in frame with the BirA* expression cassette and a C-terminal HA epitope tag to ensure equivalent expression of all forms. The BirA*:HA construct lacks GFI1B structures and instead begins with an ATG. Wild-type (WT) GFI1B is shown. The SNAG and zinc finger (ZnF) domains (1 to 6) of GFI1B are shown as black boxes. A thin line represents the GFI1B linker and connections between ZnFs. The proline-to-alanine substitution (P2A) in the GFI1B SNAG domain is indicated. ΔSNAG represents deletion of the SNAG domain but preservation of the remaining GFI1B primary structure. (B) Expression of GFI1B-BirA*:HA forms and proteome-wide biotin modification in K562 cells. K562 cells were transduced with lentivirus to inducibly express the GFI1B-BirA*:HA forms shown and stable isolates selected as polyclonal populations. Doxycycline-inducible expression of each fusion protein was confirmed by Western blotting against the common HA epitope tag and biotinylating activity confirmed proteome-wide by SAv:HRP detection of transblotted total cellular protein. Tubulin served as a loading control. (C) LSD1 and RCOR1 are enriched among biotinylated proteins generated by BirA*:HA fusions competent for LSD1 binding. Biotin-modified proteins from K562 cells transduced with the BirA*:HA fusion proteins shown were purified from whole-cell extracts (SAv P), fractionated by SDS-PAGE, and subjected to Western blotting with anti-LSD1, anti-RCOR1, and anti-HA antibodies. Equivalent expression of each protein in whole-cell lysates (input) was confirmed by Western blotting with these same antibodies.
FIG 7
FIG 7
GFI1B recruits the BHC complex in an LSD1-dependent manner via the SNAG domain. K562 cells stably and inducibly expressing the BirA*:HA fusion proteins shown in Fig. 6A were deployed to define GFI1B proximity partners whose recruitment is LSD1 dependent. Fusion protein expression was induced by doxycycline addition and biotinylation permitted in situ. Biotin-modified proteins were captured on SAv-Sepharose beads and analyzed by LC-MS/MS as described in Materials and Methods. Dot plots compare the fold change in average sum read intensity among fusion proteins with intact SNAG domains and capable of LSD1 binding (GFI1B-WT-BirA*:HA and SNAG-BirA*:HA) to those with disrupted or absent SNAG domains and deficient in LSD1 binding (GFI1B-P2A-BirA*:HA, GFI1B-ΔSNAG-BirA*:HA, and BirA*:HA). For each comparison (GFI1B-WT-BirA*:HA versus GFI1B-ΔSNAG-BirA*:HA [A], GFI1B-WT-BirA* versus GFI1B-P2A-BirA*:HA [B], and SNAG-BirA*:HA versus BirA*:HA [C]), average sum read intensities were ranked according to the LSD1-nonbinding sample and plotted on the x axis. The fold change in average sum read intensities, represented by a ratio between the LSD1 binding and LSD1 nonbinding samples in each comparison, is plotted on the y axis. Each comparison (A to C) is represented by three panels. On top in each is the entire data set for that comparison, along with a Venn diagram comparing common and unique proteins for each data set, and below are two panels dividing the percentile rank score from 0 to 50 and from 50 to 100 with expanded y axis limits to facilitate visualization of proteins enriched in the data set for the LSD1 binding form. Outlying proteins are labeled with their gene names. A line indicates equal read intensities, and thus no enrichment, for the LSD1 binding over the LSD1 nonbinding sample.
FIG 8
FIG 8
BHC complex components HMG20A, HMG20B, and PHF21A bind GFI1B in an LSD1-dependent manner. (A) BHC complex components are preferentially enriched in proximity labeling assays with fusion proteins competent for LSD1 binding. Biotin-modified proteins were purified from K562 cells inducibly expressing the BirA*:HA fusion proteins shown or an empty vector control (EV). HMG20A, HMG20B, PHF21A, SMARCB1, and SMARCC1, as well as the BirA*:HA fusion proteins, were quantified in SAv-Sepharose pulldowns (SAv P) by Western blotting. Equivalent input for each protein was confirmed by Western blotting of whole-cell lysates (input). (B to D) GFI1B binding to HMG20A, HMG20B, and PHF21A requires GFI1B-LSD1 binding. COS7L cells were transfected with HA-tagged HMG20A (B), HMG20B (C), or PHF21A (D) and wild-type (WT) or P2A variants of GFI1B:3×-Flag. HMG20A/B and PHF21A proteins and their binding partners were purified in anti-HA immune complexes (ICs). Coprecipitating GFI1B forms were detected in immune complexes by Western blotting using anti-Flag antibody. Equivalent expression and precipitation were evaluated in whole-cell lysates (WCLs) and immune complexes (ICs), respectively. GFP served as a transfection control. (E) HMG20A and HMG20B bind LSD1. COS7L cells were transfected with HA-tagged HMG20A or HMG20B along with a V5-tagged LSD1. LSD1 and its binding partners were collected in anti-V5 ICs. Coprecipitating HMG20A and HMG20B were detected in immune complexes by Western blotting using anti-HA antibody. Equivalent expression and precipitation were evaluated in the WCLs and ICs, respectively.
FIG 9
FIG 9
HMG20A and HMG20B are required for GFI1B-mediated cell fate changes in K562 cells. (A) HMG20A and HMG20B depletion in K562 cells. RNA (top) and protein (bottom) were collected from K562 cells transduced with shRNA targeting HMG20A, HMG20B, HMG20A, and HMG20B (HMG20A+B) or a content-matched scrambled control. HMG20A and HMG20B expression levels were evaluated by RT-qPCR and normalized to GUS. HMG20A, HMG20B, LSD1, and GFI1B:3×-Flag levels were determined by Western blotting. Tubulin served as a loading control. (B to F) HMG20A/B depletion abolishes GFI1B-dependent cell fate determination in K562 cells. K562 cells were transduced with inducible shRNAs targeting HMG20A, HMG20B, HMG20A, and HMG20B or a scrambled control. The shRNAs were induced with doxycycline, cells were infected with GFI1B:3×-Flag-expressing retrovirus, and erythroid differentiation was allowed to proceed. (B) Benzidine staining was quantified by counting positive cells in bright-field microscopy, while hemoglobinized cell pellets are shown above each condition shown in the bar graph. The experiment was performed in triplicate. (C) GFI1B-dependent inhibition of TPA-induced CD61 expression requires HMG20A/B. K562 cells overexpressing GFI1B and depleted of HMG20A, HMG20B, or HMG20A and -B were treated with TPA and cell surface expression of CD61 quantified by flow cytometry. The histograms presented are representative of three independent experiments. (D to F) mRNAs for globin genes HBB and HBZ (D), heme biosynthesis genes ALAS2 and FECH (E), and GFI1B-repressed target genes GFI1B and MYB (F) were quantified by RT-qPCR normalized to the GUS reference gene. Results are expressed as mean ± 2 SD. Statistical significance was determined by the two-sided unpaired t test: *, P < 0.05; **, P < 0.005; ****, P < 0.00005.
FIG 10
FIG 10
GSE1 is required for GFI1B-mediated cell fate changes in K562 cells. (A) GSE1 depletion in K562 cells. RNA was collected from K562 cells transduced with shRNA targeting GSE1 or a content-matched scrambled control. GSE1 expression levels were evaluated by RT-qPCR and normalized to GUS. (B to D) GSE1 depletion abolishes GFI1B-dependent cell fate determination in K562 cells. K562 cells were transduced with inducible shRNAs targeting GSE1 or a scrambled control. The shRNAs were induced with doxycycline, cells were infected with GFI1B:3×-Flag-expressing retrovirus, and erythroid differentiation was allowed to proceed. (B) Benzidine staining was quantified by counting positive cells in bright-field microscopy. (C and D) mRNAs for globin and related genes AHSP, HBA1/2, HBZ, and HBB and heme biosynthesis genes ALAS2 and FECH (C) and GFI1B-repressed target genes GFI1B and CDKN1A (D) were quantified by RT-qPCR and normalized to the GUS reference gene. Results are expressed as mean ± 2 SD. (E) GFI1B-dependent inhibition of TPA-induced CD61 expression requires GSE1. K562 cells overexpressing GFI1B and depleted of GSE1 were treated with TPA, and cell surface expression of CD61 was quantified by flow cytometry compared to control cells. The histograms presented are representative of three independent experiments. Statistical significance was determined by the two-sided unpaired t test: **, P < 0.005; ****, P < 0.00005.
FIG 11
FIG 11
A working model for contributions of the BHC complex to GF1B-mediated repression. LSD1 serves as a bridge between GFI1B and other components of the BHC complex, including HDAC1/2, HMG20A, HMG20B, PHF21A, RCOR1, ZMYM2, ZNF217, and GSE1. Therefore, BHC complex recruitment is rendered LSD1 dependent. A functional GFI1B transcriptional repression complex requires coincident recruitment of these factors, along with other partners brought to the promoter in an LSD1-independent manner by GFI1B or DNA binding proteins with which it collaborates. Dysfunction resulting from an impaired, SNAG-dependent GFI1B-LSD1 recruitment mechanism (1), LSD1 depletion or an intrinsic change that disrupts SNAG binding (2), or ineffective formation or operation of BHC complex components (3) could each poison the GFI1B-LSD1 functional axis to create a permissive state for misexpression of GFI1B-regulated genes. Only when each element is present and functioning properly (4) is the appropriate repressive outcome achieved. trans regulation by each component toward the others, or toward partners that engage GFI1B in an LSD1-independent manner, may also make important contributions to enabling and fine-tuning target gene expression.

References

    1. Feinberg AP, Koldobskiy MA, Göndör A. 2016. Epigenetic modulators, modifiers and mediators in cancer aetiology and progression. Nat Rev Genet 17:284–299. doi: 10.1038/nrg.2016.13. - DOI - PMC - PubMed
    1. Avgustinova A, Benitah SA. 2016. Epigenetic control of adult stem cell function. Nat Rev Mol Cell Biol 17:643–658. doi: 10.1038/nrm.2016.76. - DOI - PubMed
    1. Ntziachristos P, Abdel-Wahab O, Aifantis I. 2016. Emerging concepts of epigenetic dysregulation in hematological malignancies. Nat Immunol 17:1016–1024. doi: 10.1038/ni.3517. - DOI - PMC - PubMed
    1. Egger G, Liang G, Aparicio A, Jones PA. 2004. Epigenetics in human disease and prospects for epigenetic therapy. Nature 429:457–463. doi: 10.1038/nature02625. - DOI - PubMed
    1. van der Meer LT, Jansen JH, van der Reijden BA. 2010. Gfi1 and Gfi1b: key regulators of hematopoiesis. Leukemia 24:1834–1843. doi: 10.1038/leu.2010.195. - DOI - PubMed

Publication types