. 2019 May 28;116(22):10711-10716.
doi: 10.1073/pnas.1900888116. Epub 2019 Apr 15.

Indian annual ambient air quality standard is achievable by completely mitigating emissions from household sources

Affiliations

Indian annual ambient air quality standard is achievable by completely mitigating emissions from household sources

Sourangsu Chowdhury et al. Proc Natl Acad Sci U S A. .

Abstract

Exposures to ambient and household fine-particulate matter (PM2.5) together are among the largest single causes of premature mortality in India according to the Global Burden of Disease Studies (GBD). Several recent investigations have estimated that household emissions are the largest contributor to ambient PM2.5 exposure in the country. Using satellite-derived district-level PM2.5 exposure and an Eulerian photochemical dispersion model CAMx (Comprehensive Air Quality Model with Extensions), we estimate the benefit in terms of population exposure of mitigating household sources--biomass for cooking, space- and water-heating, and kerosene for lighting. Complete mitigation of emissions from only these household sources would reduce India-wide, population-weighted average annual ambient PM2.5 exposure by 17.5, 11.9, and 1.3%, respectively. Using GBD methods, this translates into reductions in Indian premature mortality of 6.6, 5.5, and 0.6%. If PM2.5 emissions from all household sources are completely mitigated, 103 (of 597) additional districts (187 million people) would meet the Indian annual air-quality standard (40 μg m-3) compared with baseline (2015) when 246 districts (398 million people) met the standard. At 38 μg m-3, after complete mitigation of household sources, compared with 55.1 μg m-3 at baseline, the mean annual national population-based concentration would meet the standard, although highly polluted areas, such as Delhi, would remain out of attainment. Our results support expansion of programs designed to promote clean household fuels and rural electrification to achieve improved air quality at regional scales, which also has substantial additional health benefits from directly reducing household air pollution exposures.

Keywords: PM2.5; air pollution; cooking; heating; lighting.


Conflict of interest statement

The authors declare no conflict of interest.

Figures
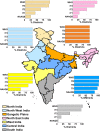
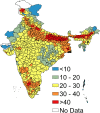
Fig. 1.
Fig. 1.
Annual ambient PM2.5 exposure exceedances in India with reference to Indian NAAQS and WHO air-quality guidelines in the baseline year, 2015. Indian NAAQS: 40 µg m−3; WHO-IT1: 35 µg m−3; WHO-IT2: 25 µg m−3; WHO-IT3: 15 µg m−3; WHO-AQG: 10 µg m−3. Statistics (as inset figures) are shown as percentage of districts in each region exceeding the standard/guidelines.
Fig. 2.
Fig. 2.
Percentage of ambient PM2.5 exposure that can be attributed to household PM2.5 sources at baseline, 2015.
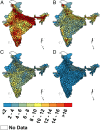
Fig. 3.
Fig. 3.
Relative contributions (%) of biomass use for (A) solid-fuel cooking, (B) space heating, and (C) water heating and kerosene use for (D) lighting to annual ambient PM2.5 exposure at the district level at baseline, 2015.
Fig. 4.
Fig. 4.
(A) Percentage of districts where ambient PM2.5 exposure exceeds various guidelines before and after mitigation of household emissions. Definition of the scenarios in the y axis are provided in Table 1 and (B) annual PM2.5 exposure that needs to be further mitigated in each district after complete mitigation of household PM2.5 to achieve Indian standard in that district.
Fig. 5.
Fig. 5.
Changes in population-weighted mean (±1σ shown by error bars) annual ambient PM2.5 exposure (Top) and percentage averted premature mortality based (Bottom). The range of baseline PM2.5 estimate is shaded in the top; the mean value is indicated by the dotted line. The dashed horizontal line in the top represents the Indian NAAQS. See text for details.

Comment in

  • Toward cleaner air for a billion Indians.
    Apte JS, Pant P. Apte JS, et al. Proc Natl Acad Sci U S A. 2019 May 28;116(22):10614-10616. doi: 10.1073/pnas.1905458116. Epub 2019 May 17. Proc Natl Acad Sci U S A. 2019. PMID: 31101719 Free PMC article. No abstract available.

References

    1. Lim SS, et al. A comparative risk assessment of burden of disease and injury attributable to 67 risk factors and risk factor clusters in 21 regions, 1990-2010: A systematic analysis for the global burden of disease study 2010. Lancet. 2012;380:2224–2260. - PMC - PubMed
    1. Pope CA, 3rd, et al. Lung cancer and cardiovascular disease mortality associated with ambient air pollution and cigarette smoke: Shape of the exposure-response relationships. Environ Health Perspect. 2011;119:1616–1621. - PMC - PubMed
    1. Gehring U, et al. Air pollution exposure and lung function in children: The ESCAPE project. Environ Health Perspect. 2013;121:1357–1364. - PMC - PubMed
    1. Gao Y, Chan EY, Li L, Lau PW, Wong TW. Chronic effects of ambient air pollution on respiratory morbidities among Chinese children: A cross-sectional study in Hong Kong. BMC Public Health. 2014;14:105. - PMC - PubMed
    1. Mitter SS, et al. Household fuel use and cardiovascular disease mortality: Golestan cohort study. Circulation. 2016;133:2360–2369. - PMC - PubMed

Publication types

LinkOut - more resources