. 2019 Apr 15;51(4):1-17.
doi: 10.1038/s12276-019-0240-4.

Blocking TBK1 alleviated radiation-induced pulmonary fibrosis and epithelial-mesenchymal transition through Akt-Erk inactivation

Affiliations

Blocking TBK1 alleviated radiation-induced pulmonary fibrosis and epithelial-mesenchymal transition through Akt-Erk inactivation

Hongjin Qu et al. Exp Mol Med. .

Abstract

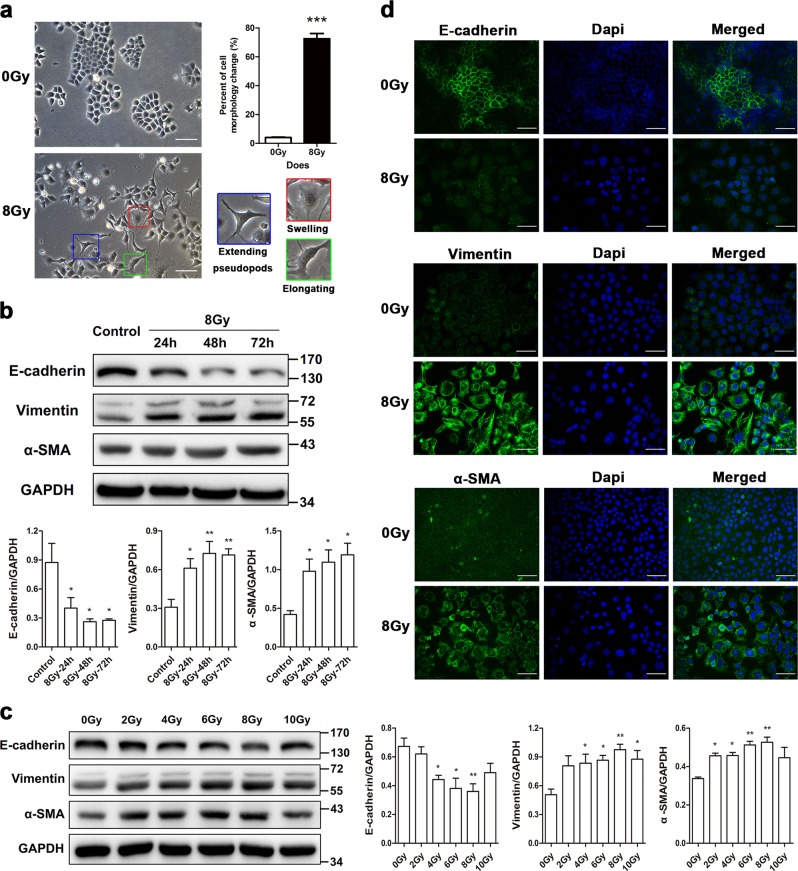
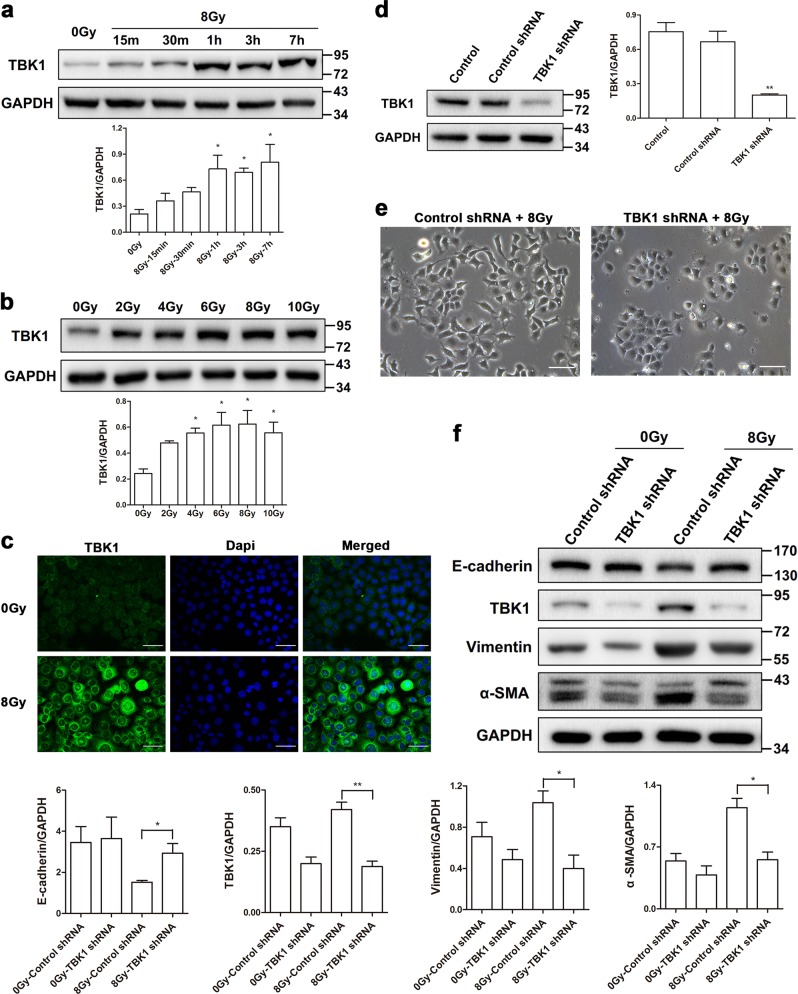
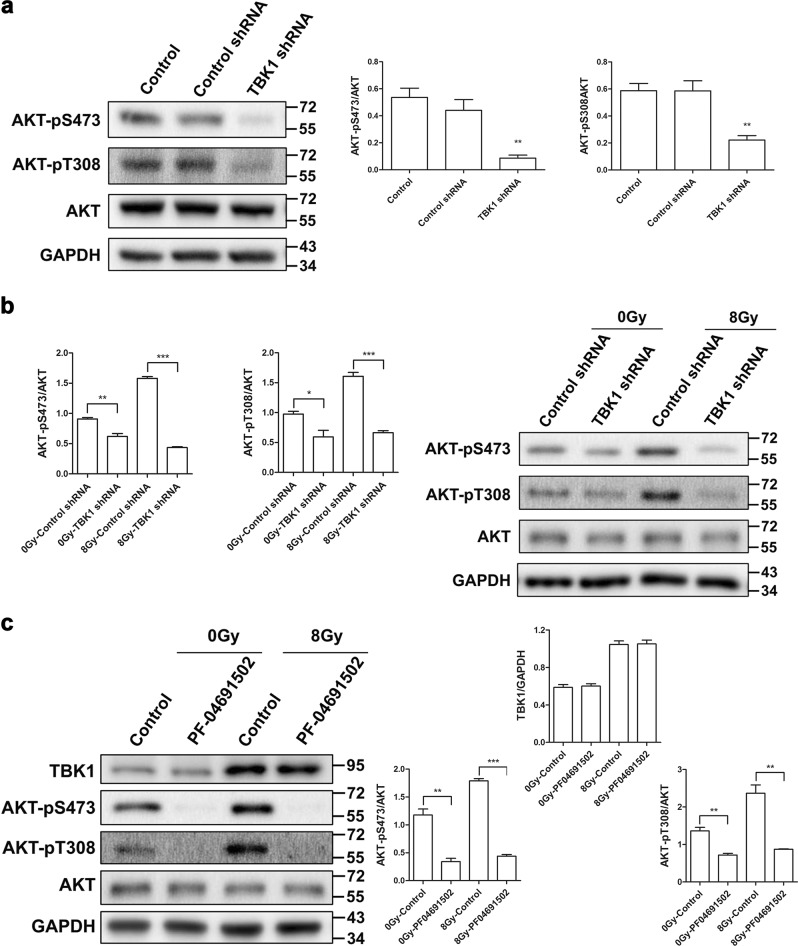
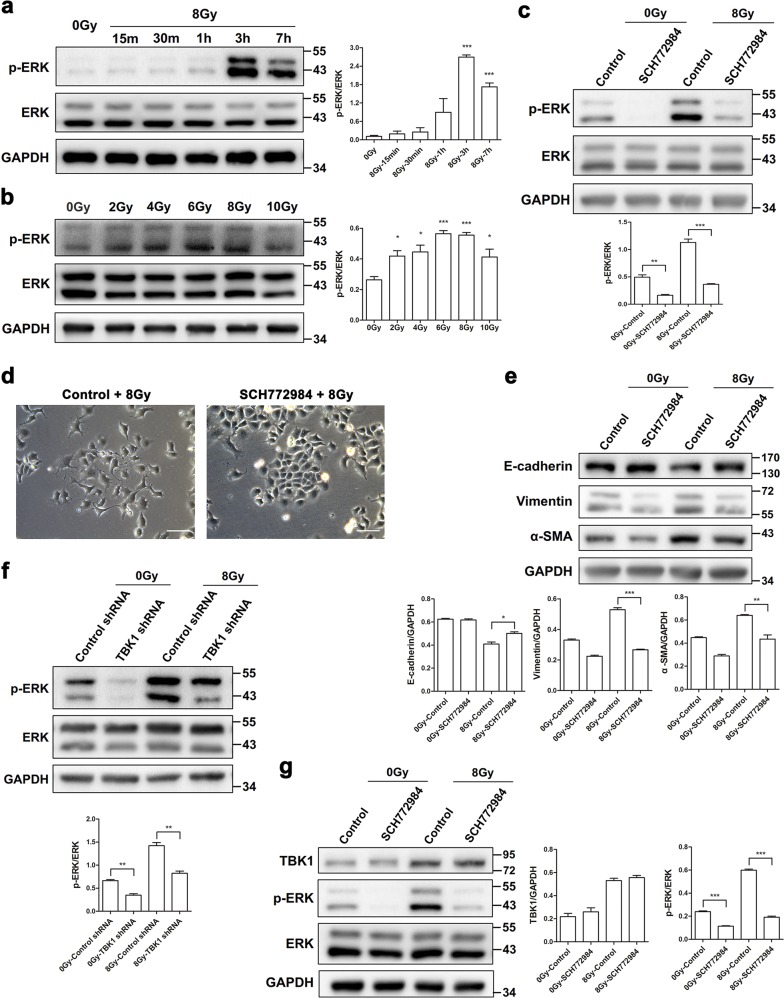
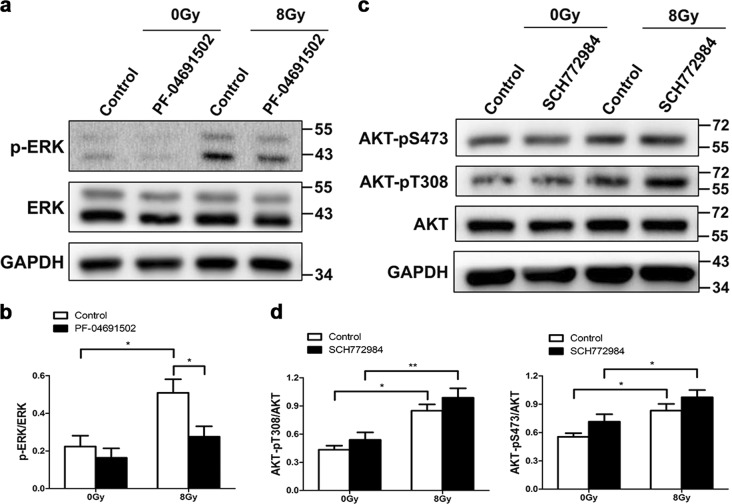
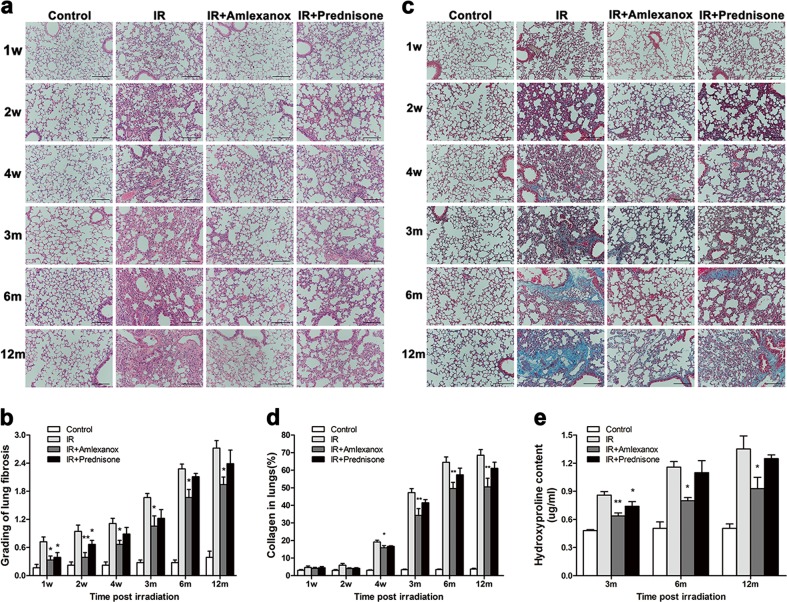
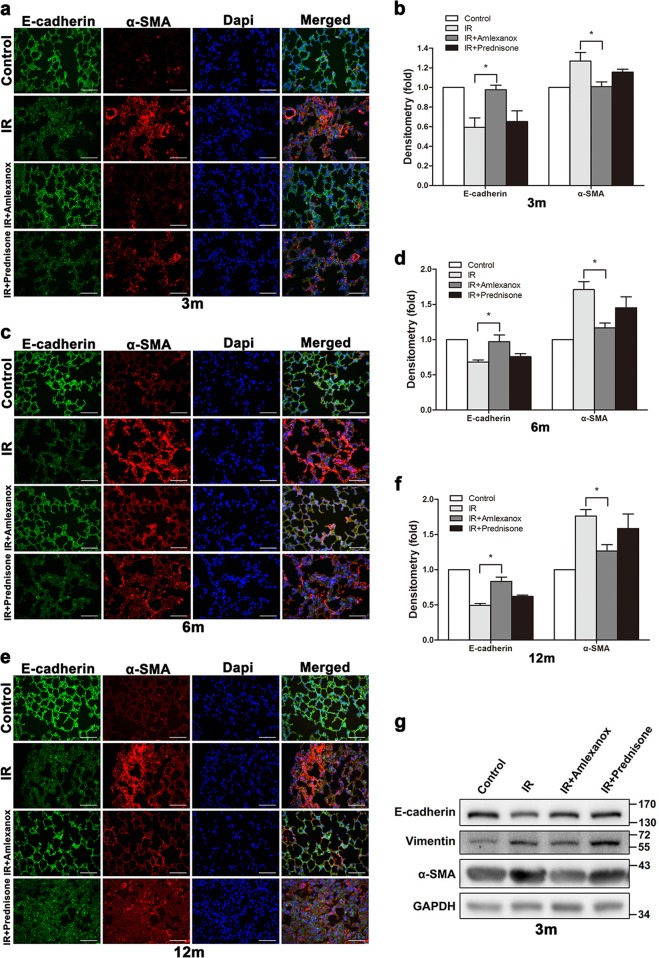
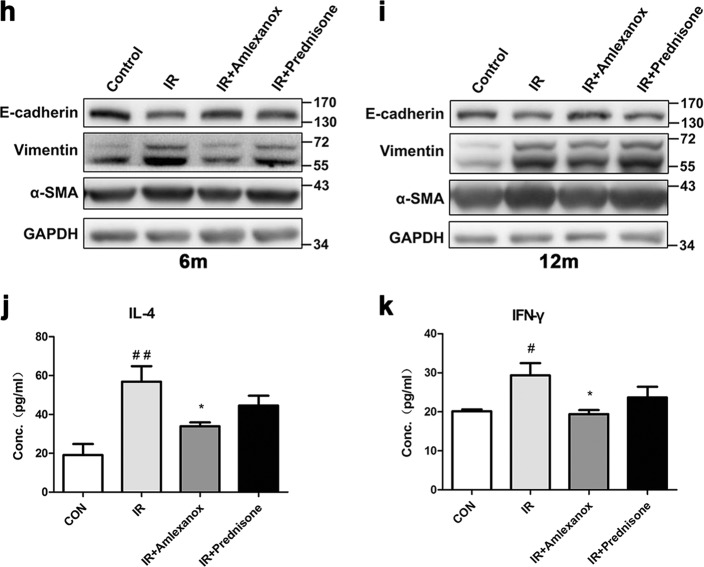
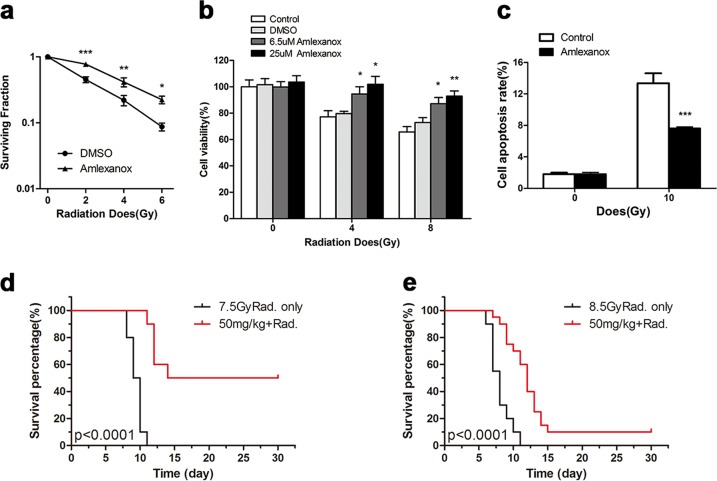
As a common serious complication of thoracic radiotherapy, radiation-induced pulmonary fibrosis (RIPF) severely limits radiation therapy approaches. Epithelial-mesenchymal transition (EMT) is a direct contributor to the fibroblast pool during fibrogenesis, and prevention of EMT is considered an effective strategy to inhibit tissue fibrosis. Our previous study revealed that TANK-binding kinase 1 (TBK1) regulates EMT in lung cancer cells. In the present study, we aimed to investigate the therapeutic potential of targeting TBK1 to prevent RIPF and EMT progression. We found radiation-induced EMT and pulmonary fibrosis in normal alveolar epithelial cells and lung tissues. TBK1 knockdown or inhibition significantly reversed EMT in vivo and in vitro and attenuated pulmonary fibrosis and collagen deposition. Moreover, we observed that TBK1 was elevated in a time- and dose-dependent manner by radiation. Meanwhile, radiation also induced time- and dose-dependent activation of AKT and ERK, each of whose inhibitors suppressed radiation-induced EMT. Intriguingly, silencing of TBK1 with shRNA also blocked the radiation-induced activation of AKT and ERK signaling. The ERK inhibitor did not obviously affect the expression of TBK1 or phosphorylated AKT, while AKT inhibition suppressed activation of ERK without changing the expression of TBK1. Finally, we found that a TBK1 inhibitor inhibited inflammatory cytokine expression in a RIPF model and Amlexanox protected normal cells and mice from ionizing radiation. In conclusion, our results indicate that the TBK1-AKT-ERK signaling pathway regulates radiation-induced EMT in normal alveolar epithelial cells, suggesting that TBK1 is a potential target for pulmonary fibrosis prevention during cancer radiotherapy.


Conflict of interest statement

The authors declare that they have no conflict of interest.

Figures

Fig. 1
Fig. 1. Radiation induces changes in cell morphology and EMT-associated protein expression in RLE-6TN cells.
Cells were irradiated with a single dose of 2, 4, 6, 8, or 10 Gy 60Co γ-rays, and cell morphology and EMT-associated protein markers were observed at 24, 48, and 72 h postirradiation. a Representative images of cell morphology (photographed at 48 h after 8 Gy irradiation or nonirradiation). Cells suffering morphologic changes were counted in random microscope fields according to whether cells became swollen (red outline), elongated (green outline), or exhibited extended pseudopodia (blue outline) compared with a cuboidal appearance, and the percentage was calculated. Scale bar represents 100 μm. The data are presented as the mean ± SEM (n = 10). ***P < 0.0001 vs. nonirradiated control. b, c Representative western blots and densitometric quantification of E-cadherin, vimentin, and α-SMA protein levels. GAPDH was used as the loading control. The data are presented as the mean ± SEM (n = 3). *P < 0.05 and **P < 0.01 vs. nonirradiated control. d Immunofluorescence staining for E-cadherin, vimentin, α-SMA (green), and DAPI (blue) in nonirradiated control and irradiated cells at 48 h postirradiation. Scale bar represents 50 μm
Fig. 2
Fig. 2. Radiation induced TBK1 expression and knockdown of TBK1 attenuates radiation-induced EMT.
a, b Representative western blots and densitometric quantification of TBK1 protein levels at different times and with different radiation doses. c Immunofluorescence staining for TBK1 (green) and DAPI (blue) in nonirradiated control and irradiated cells at 1 h postirradiation. Scale bar represents 50 μm. d Representative western blot and densitometric quantification of TBK1 following infection with TBK1-specific shRNA lentivirus to confirm target suppression. e Phase contrast microscopy images of cells expressing TBK1-specific shRNA and control shRNA at 48 h after 8 Gy irradiation. Scale bar represents 100 μm. f Western blot analysis of E-cadherin, vimentin, and α-SMA expression in TBK1 knockdown RLE-6TN cells. GAPDH was used as the loading control in all the above western blot analyses. All data are presented as the mean ± SEM (n = 3). *P < 0.05 and **P < 0.01 vs. nonirradiated control
Fig. 3
Fig. 3. Inhibition of AKT attenuates radiation-induced changes in cell morphology and the expression of EMT markers.
a, b Representative western blots and densitometric quantification of phosphorylated AKT on both S473 and T308 at different times and with different radiation doses. c Immunofluorescence staining for p-AKT (green) and DAPI staining (blue) in nonirradiated control and irradiated cells at 1 h postirradiation. Scale bar represents 50 μm. df RLE-6TN cells were incubated with/without the selective AKT inhibitor PF-04691502 for 2 h before irradiation with 8 Gy. d, f Western blot analysis of p-AKT, E-cadherin, vimentin, and α-SMA expression at 1 or 48 h postirradiation. e Phase contrast microscopy images of cells at 48 h after treatment with 8 Gy irradiation. Scale bar represents 100 μm. All the above western blot analyses use GAPDH or AKT as the loading control. The data are presented as the mean ± SEM (n = 3). *P < 0.05, **P < 0.01, and ***P < 0.001 vs. nonirradiated control
Fig. 4
Fig. 4. The involvement of TBK1 in radiation-induced EMT occurs through the AKT signaling pathway.
a, b The expression levels of AKT-pS473 and AKT-pT308 in TBK1 knockdown RLE-6TN cells treated with or without 8 Gy irradiation were detected via western blot analysis. GAPDH and AKT were used as loading controls. c RLE-6TN cells were incubated with/without PF-04691502 for 2 h before 8 Gy irradiation. Cell lysates were collected, and the protein levels of AKT-pS473, AKT-pT308, and TBK1 at 1 h postirradiation were measured via western blot. GAPDH and AKT were used as loading controls. The data are presented as the mean ± SEM (n = 3). *P < 0.05, **P < 0.01, and ***P < 0.001 vs. control group
Fig. 5
Fig. 5. The ERK signaling pathway accounts for the regulatory effects of TBK1 in radiation-induced EMT
a, b Representative western blots and densitometric quantification of phosphorylated ERK at different times and with different radiation doses. ce RLE-6TN cells were incubated with/without the selective ERK inhibitor SCH772984 for 2 h before irradiation with 8 Gy. c, e Western blot analysis of p-ERK, E-cadherin, vimentin, and α-SMA at 1 or 48 h postirradiation. d Phase contrast microscopy images of cells at 48 h after treatment with 8 Gy irradiation. Scale bar represents 100 μm. f The expression level of p-ERK in TBK1 knockdown RLE-6TN cells treated with or without 8 Gy irradiation was detected by western blot analysis. g RLE-6TN cells were incubated with/without SCH772984 for 2 h before irradiation with 8 Gy. Cell lysates were collected, and the protein levels of p-ERK and TBK1 at 3 h postirradiation were measured by western blot. GAPDH and ERK were used as loading controls. The data are presented as the mean ± SEM (n = 3). *P < 0.05, **P < 0.01, and ***P < 0.001 vs. nonirradiated control
Fig. 6
Fig. 6. AKT-mediated ERK signaling is critical for radiation-induced EMT downstream of TBK1.
RLE-6TN cells were incubated with/without inhibitor for 2 h before irradiation with 8 Gy. a, b Representative western blot and densitometric quantification of p-ERK at 3 h postirradiation. GAPDH and ERK were used as loading controls. c, d Representative western blot and densitometric quantification of AKT-pS473 and AKT-pT308 at 1 h postirradiation. GAPDH and AKT were used as loading controls. All data are presented as the mean ± SEM (n = 4). One-way ANOVA with Newman–Keuls post hoc analysis was used. *P < 0.05 and **P < 0.01
Fig. 7
Fig. 7. The TBK1 inhibitor Amlexanox alleviated radiation-induced pulmonary injury and fibrosis.
The lung area of mice was exposed to local irradiation at a dose of 15 Gy, and HE (a) and Masson staining (c) were conducted at 1 to 12 months postirradiation. Lung fibrosis (b) and collagen (d) deposition were quantified in lung sections from different groups. At different time points, hydroxyproline content was measured via ELISA in different groups (e). *P < 0.05 and **P < 0.01
Fig. 8
Fig. 8. Amlexanox inhibited EMT in lung tissues after irradiation.
At 3, 6, and 12 months after irradiation, lung tissues were isolated, and stained for EMT-related markers, including E-cadherin and α-SMA (a, c, e); fluorescence density was quantified in each group using software (b, d, f). *P < 0.05 and **P < 0.01. Expression levels of the EMT markers E-cadherin, Vimentin, and α-SMA were confirmed by western blot assay at 3 (g), 6 (h), and 12 (i) months after irradiation. Cytokines, such as IL-4 (j) and IFN-γ (k), were measured in bronchoalveolar lavage fluid (BALF) via ELISA 3 months after irradiation. ##P < 0.01 and #P < 0.05 vs. control group. *P < 0.05 vs. IR group
Fig. 9
Fig. 9. The TBK1 inhibitor Amlexanox protected cells and mice against lethal radiation damage.
After 2, 4, 6, or 8 Gy single-dose irradiation, cell survival was determined in the radiation- and Amlexanox-treated groups via colony formation (a) and CCK-8 (b) assays. Cell apoptosis was measured by flow cytometry 24 h after 10 Gy irradiation (c). For in vivo study, BALB/c mice with/without Amlexanox treatment were exposed to 7 or 8.5 Gy irradiation, and animal survival was monitored for up to 30 days after irradiation (d, e). *P < 0.05, **P < 0.01, and ***P < 0.001 vs. nonirradiated control

References

    1. Chen W, et al. Cancer statistics in China, 2015. CA Cancer J. Clin. 2016;66:115–132. - PubMed
    1. Siegel RL, Miller KD, Jemal A. Cancer statistics, 2015. CA Cancer J. Clin. 2015;65:5–29. - PubMed
    1. Mehta V. Radiation pneumonitis and pulmonary fibrosis in non-small-cell lung cancer: pulmonary function, prediction, and prevention. Int. J. Radiat. Oncol. Biol. Phys. 2005;63:5–24. - PubMed
    1. Ding NH, Li JJ, Sun LQ. Molecular mechanisms and treatment of radiation-induced lung fibrosis. Curr. Drug Targets. 2013;14:1347–1356. - PMC - PubMed
    1. Graves PR, Siddiqui F, Anscher MS, Movsas B. Radiation pulmonary toxicity: from mechanisms to management. Semin. Radiat. Oncol. 2010;20:201–207. - PubMed

Publication types

MeSH terms

Substances