. 2019 Apr 15;10(1):1758.
doi: 10.1038/s41467-019-09498-y.

Supersonic plasma turbulence in the laboratory

Affiliations

Supersonic plasma turbulence in the laboratory

T G White et al. Nat Commun. .

Abstract

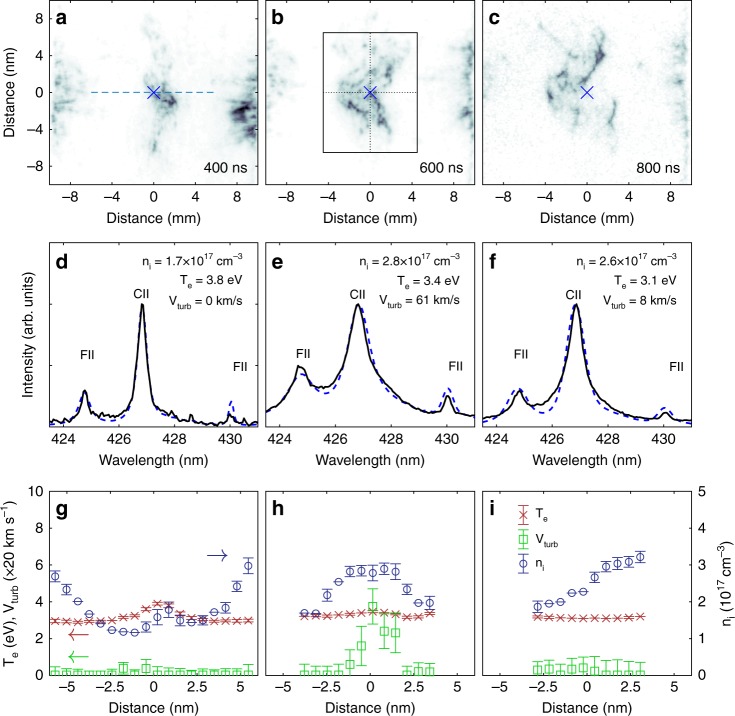
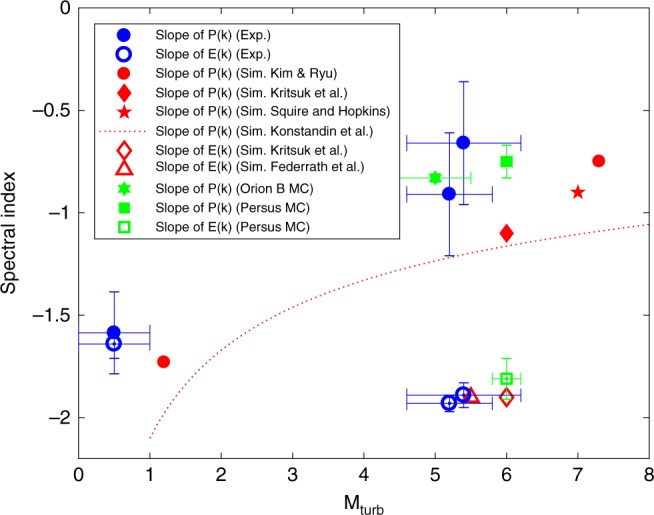
The properties of supersonic, compressible plasma turbulence determine the behavior of many terrestrial and astrophysical systems. In the interstellar medium and molecular clouds, compressible turbulence plays a vital role in star formation and the evolution of our galaxy. Observations of the density and velocity power spectra in the Orion B and Perseus molecular clouds show large deviations from those predicted for incompressible turbulence. Hydrodynamic simulations attribute this to the high Mach number in the interstellar medium (ISM), although the exact details of this dependence are not well understood. Here we investigate experimentally the statistical behavior of boundary-free supersonic turbulence created by the collision of two laser-driven high-velocity turbulent plasma jets. The Mach number dependence of the slopes of the density and velocity power spectra agree with astrophysical observations, and supports the notion that the turbulence transitions from being Kolmogorov-like at low Mach number to being more Burgers-like at higher Mach numbers.


Conflict of interest statement

The authors declare no competing interests.

Figures

Fig. 1
Fig. 1
Experimental configuration and magnetic-field fluctuations. a Experimental configuration. Two counter-propagating supersonic jets are launched by means of optical-laser ablation of thin fluorinated plastic foils separated by 4 cm. Each foil is irradiated by three frequency-doubled (527-nm-wavelength) lasers, each carrying 130 ± 20 J of energy in a 2 ns pulse. The jets are passed through two misaligned plastic grids and collide, forming a central region of supersonic turbulence. Magnetic fluctuations, created as the magnetic field imposed by external permanent magnets (gray dashed lines) is advected by the flow, are measured with an induction coil and used to deduce velocity fluctuations. b Temporal evolution of the y-component (vertical in the top panel) of the magnetic field, as measured by the induction loop. The shaded regions represent the intervals over which the FFT was performed in calculating the magnetic-field power spectra
Fig. 2
Fig. 2
Schlieren images and optical emission spectroscopy data. Schlieren images taken at a 400 ns, b 600 ns, and c 800 ns after the peak of the drive laser. The box in panel b shows the region over which the density power spectra, shown in Fig. 3a–c, are calculated. Panels df show experimental emission spectra (solid black lines) from the regions marked by × in panels ac, along with the best-fit theoretical spectrum (blue-dashed lines). The parameters given correspond to the plotted theoretical spectrum. Panels gi show corresponding profiles of temperature (red crosses), density (blue circles), and turbulent velocity (green squares) across the region indicated by a dashed line in panel a, as inferred from the optical emission spectroscopy. The error bars represent a 10% deviation between the calculated and measured emission spectra
Fig. 3
Fig. 3
Density and velocity power spectra. The blue dots in panels (ac) show the measured density power spectra at 500 ns, 600 ns, and 700 ns, respectively, obtained from the corresponding Schlieren images. The dashed line shows a fitted slope of the power spectrum, while the shaded regions mark the resolution limit of the imaging system (upper bound on wave numbers) and the size of the windowing function applied during the calculation (lower bound on wave numbers). The error bars show the standard deviation in the spectra based on measurements performed in four regions of the plasma—see box in Fig. 2b. The blue dots in panels (df) show the magnetic-field power spectra taken at 500 ns, 600 ns, and 700 ns, respectively, obtained from the induction-coil data (Fig. 1). The shaded region marks the resolution limit of the induction loop. Additional details on the calculation of resolution limits and error bars are given in the supplementary methods
Fig. 4
Fig. 4
Spectral index of density and velocity turbulence. The scaling exponent of the density power spectrum, P(k) (solid markers), and the velocity power spectrum, E(k) (open markers) is plotted against the turbulent Mach number. The results from this experiment are plotted in blue, and correspond to the times t = 500, 600, and 700 ns. Shown in red are hydrodynamic results from Kim & Ryu (circles), Kritsuk et al. (diamonds), Squire and Hopkins (star), Konstandin et al. (dotted line), and Federrath et al. (triangle). In green are astrophysical observations of the scaling exponent of the density power spectrum of the Orion B MC (star), the density power spectrum of the Perseus MC, (square), and the velocity power spectrum of the Perseus MC (square). The Mach number error bar is a consequence of uncertainties in the measurement of the thermodynamic conditions of the plasma (see Fig. 2). The error bars for the density spectral index show the variation across the four regions of the plasma highlighted in Fig. 2b, and the error bars in the velocity spectral index were found by shifting the Fourier transform window by 20 ns in either direction

References

    1. Ingenito A, Bruno C. Physics and regimes of supersonic combustion. AIAA J. 2010;48:515–525. doi: 10.2514/1.43652. - DOI
    1. Ogden DE, Glatzmaier GA, Wohletz KH. Effects of vent overpressure on buoyant eruption columns: implications for plume stability. Earth Planet. Sci. Lett. 2008;268:283–292. doi: 10.1016/j.epsl.2008.01.014. - DOI
    1. Papamoschou D. Evidence of shocklets in a counterflow supersonic shear layer. Phys. Fluids. 1995;7:233–235. doi: 10.1063/1.868621. - DOI
    1. Padoan, P. et al. Protostars and Planets VI, pp. 77–100 (University of Arizona Press, Tucson, 2014).
    1. Miniati F. The matryoshka run. II. Time-dependent turbulence statistics, stochastic particle acceleration, and microphysics impact in a massive galaxy cluster. Astrophys. J. 2015;800:60. doi: 10.1088/0004-637X/800/1/60. - DOI

Publication types