. 2019 Apr 15;9(1):6045.
doi: 10.1038/s41598-019-42480-8.

Effects of a phytogenic, alone and associated with potassium diformate, on tilapia growth, immunity, gut microbiome and resistance against francisellosis

Affiliations

Effects of a phytogenic, alone and associated with potassium diformate, on tilapia growth, immunity, gut microbiome and resistance against francisellosis

S A Suphoronski et al. Sci Rep. .

Abstract

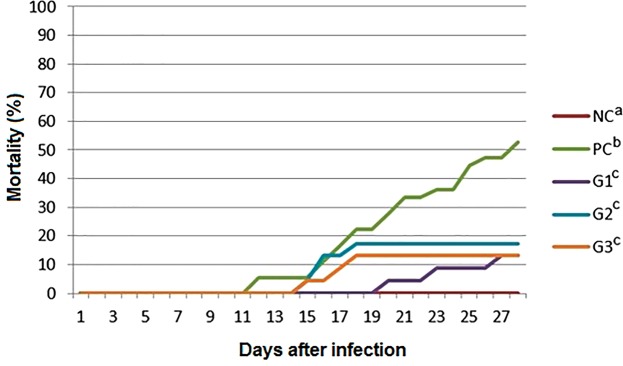
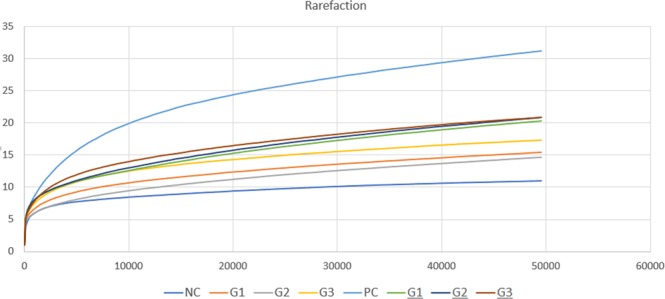
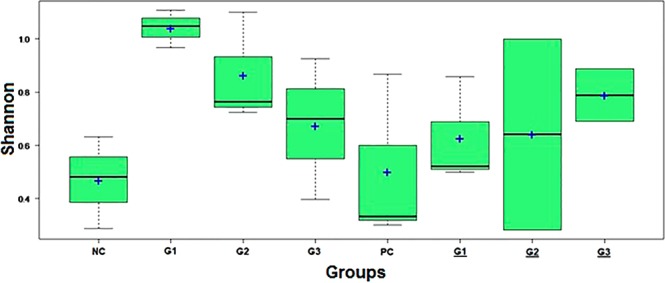
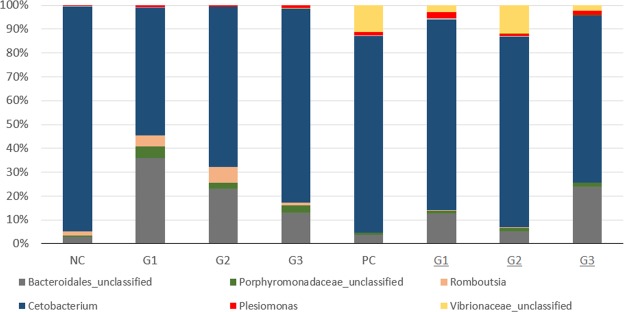
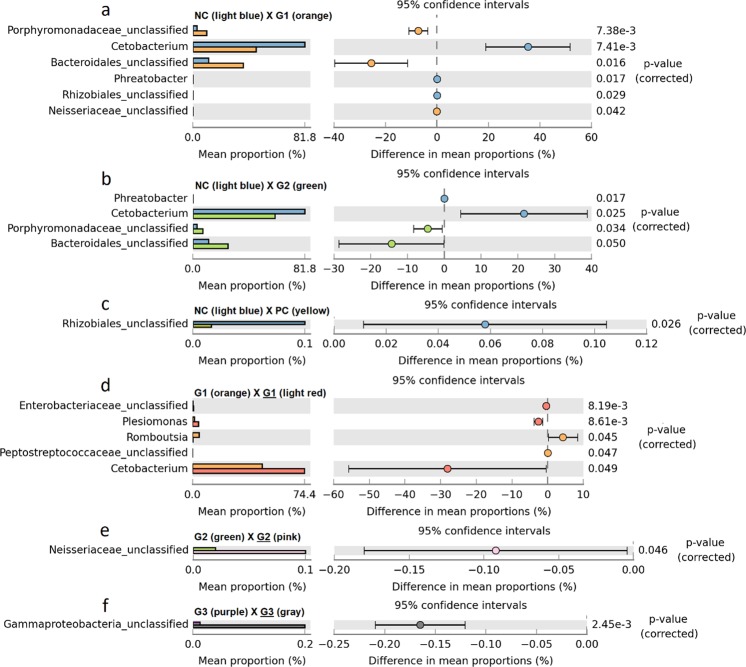
This work evaluated the effects of dietary supplementation of A-Live (phytogenic) either individually or in combination with Aquaform (potassium diformate, acidifier) on juvenile Nile tilapia (Oreochromis niloticus) growth performance, innate immune parameters, gut microbiome, and resistance against Francisella noatunensis subsp. orientalis challenge. Each experimental group contained 140 fishes (34.3 ± 0.33) in two 150L tanks. The experimental design consisted of five groups: a negative control; treated groups (G1, G2, G3) supplemented with different concentrations of A-Live and Aquaform in the feed; and a positive control (PC) for pathogen infection. Groups G1, G2, G3, and PC were challenged with Francisella spp. after 15 days. After infection, the mortality was significantly lower in groups G1, G2, and G3 (p < 0.01). Furthermore, these groups showed significant increase (p < 0.05) in daily weight gain, feed conversion rate, and specific growth rate. The PC group presented increase (p < 0.05) in the leukocytes and neutrophils number. Innate immunity parameters showed no difference between treatments after infection. Microbiome analysis revealed an increased number of bacteria belonging to the Vibrionaceae family after pathogen infection suggesting a secondary pathogen function of these bacteria. These results validate the beneficial effects of these products in tilapia farming.


Conflict of interest statement

The authors declare no competing interests.

Figures

Figure 1
Figure 1
Visualization of number of cells of Francisella spp. F1 strain by electron microscopy after 30 min of exposure with both products applied either at 0.1% or 1%, (A) (Francisella spp. without the products); (B) (Francisella spp. with A-Live 0.1% and Aquaform 0.1%); (C) (Francisella spp. with A-Live 1% and Aquaform 1%). Cellular damages are shown using white arrows (B,C).
Figure 2
Figure 2
Cumulative mortality observed in the different groups after disease challenge by immersion with Francisella noatunensis subsp. orientalis. NC negative control: No challenge with bacteria and no A-Live or Aquaform (2 tanks); PC positive control: Challenge with Francisella spp. and no A-Live or Aquaform; G1- fish that received A-Live at 0.2% in the feed for 15 days prior to experimental infection with Francisella spp. (2 tanks); G2- fish that received the product A-Live at 0.2% and Aquaform at 0.2% in the feed for 15 days prior to experimental infection with Francisella spp.; G3- fish that received the product A-Live at 0.5% and Aquaform at 0.2% in the feed for 15 days prior to experimental infection with Francisella spp. (2 tanks).
Figure 3
Figure 3
Histomorphology of the gut with different treatments after 15 days of experimental infection. Shrinkage of intestinal villi are shown using black arrow. Goblet cells are denoted by “*”. (A) G1 group (A-Live at 0.2%); (B) G2 group (A-Live at 0.2% and Aquaform at 0.2%); (C,F): G3 group (A-Live at 0.5% and Aquaform at 0.2%); (D,E) PC group.
Figure 4
Figure 4
Rarefaction curve showing increasing species along the number of reads in different trial groups.
Figure 5
Figure 5
Shannon index in different trial groups after 15 days of treatment and after experimental infection with Francisella spp. (underlined).
Figure 6
Figure 6
Abundance of noninfected and infected groups (underlined) with information on the percentage of sequences in each group. Cetobacterium (dark blue), Bacteroidales_unclassified (gray), Vibronaceae_unclassified (yellow), Porphyromonadaceae_unclassified (green), Romboutsia (pink) and Plesiomonas (red).
Figure 7
Figure 7
Comparisons of bacterial abundance among groups. The left side presents the abundance proportion of each sample. The right side shows the difference in abundance within 95% confidence intervals with the p-value of the significance test. Only significant results are displayed (p < 0.05).

References

    1. FAO. Regional Review on Status and Trends in Aquaculture Development in Asia-Pacific – 2010. 5, (2010).
    1. FAO. The State of World Fisheries and Aquaculture 2014. (2014).
    1. FAO, AND, F. & Circular, A. Regional Review on Status and Trends in Aquaculture Development in Asia-Pacific – 2015. 5, (2017).
    1. FAO, Apfic: Its Changing Role. (1999).
    1. Sargent JR, Tacon AGJ. Development of farmed fish: A nutritionally necessary alternative to meat. Proc. Nutr. Soc. 1999;58:377–383. doi: 10.1017/S0029665199001366. - DOI - PubMed

Publication types

MeSH terms